

Bitcoin’s latest correction has unnerved traders. BTC fell from above $120,800 to near $102,000 before recovering nearly 9% to above $111,000. While altcoins like Ethereum and XRP fell more than 13%, Bitcoin’s 7% drop at press time shows it has held up better — suggesting underlying strength even amid massive liquidations.
The big question, however, remains: Can Bitcoin hold above $100,000, or will the price fall further below this important psychological level soon? Three charts provide the answer.
Holders grow and veteran investors stay calm amid market crash
The first sign of support comes from the behavior of on- chain investors.
Despite the drop, the total number of Bitcoin holders has increased from 56.92 million to 56.98 million since yesterday, showing that investors have increased their investments as prices have fallen. This shows confidence in buying on dips, not panic selling.
Want more information on Token like this? Sign up for Editor Harsh Notariya's daily Crypto Newsletter here .
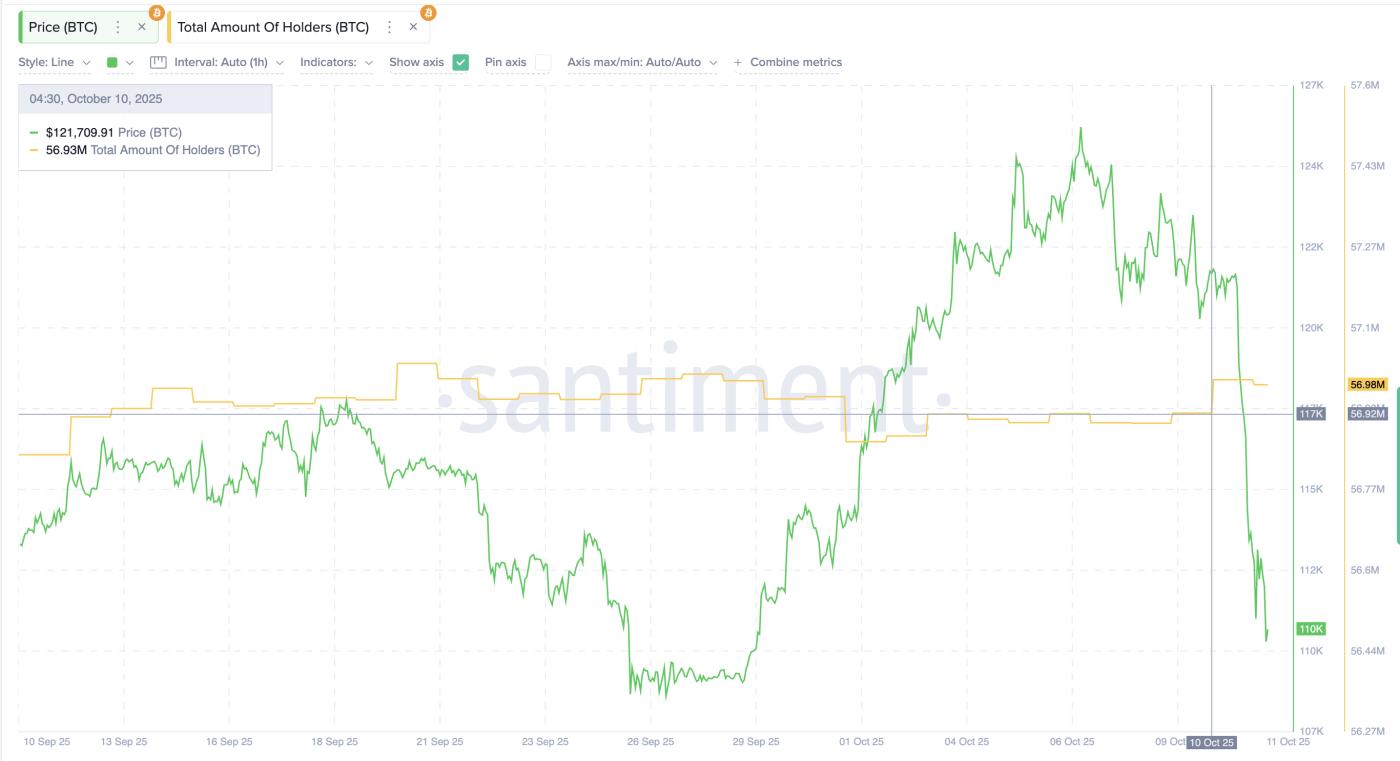 Number of Bitcoin Holders Increases: Santiment
Spent Coins Age Bands (SCAB) reinforces this. This metric tracks the age of the coins being moved — in short, whether old or new holders are spending their Bitcoin .
When the decline began on October 10, 2023, the overall SCAB stood at around 17,100 BTC, while the 180–365-day band (red) was near 9,995 BTC, and the 365-day–2-year band (blue) was near 2,452 BTC.
As the sell-off took place, the overall SCAB surged to 23,086 BTC, confirming an increase in spending activity among newer holders.
Conversely, the red band dropped slightly to 9,646 BTC, and the blue band dropped sharply to 535 BTC — clear evidence that long-term holders remained silent.
This means that panic selling is mainly led by new or medium-term wallets, while long-term holders continue to hold. And long-term holders usually hold unless they expect the price to drop sharply, like below $100,000.
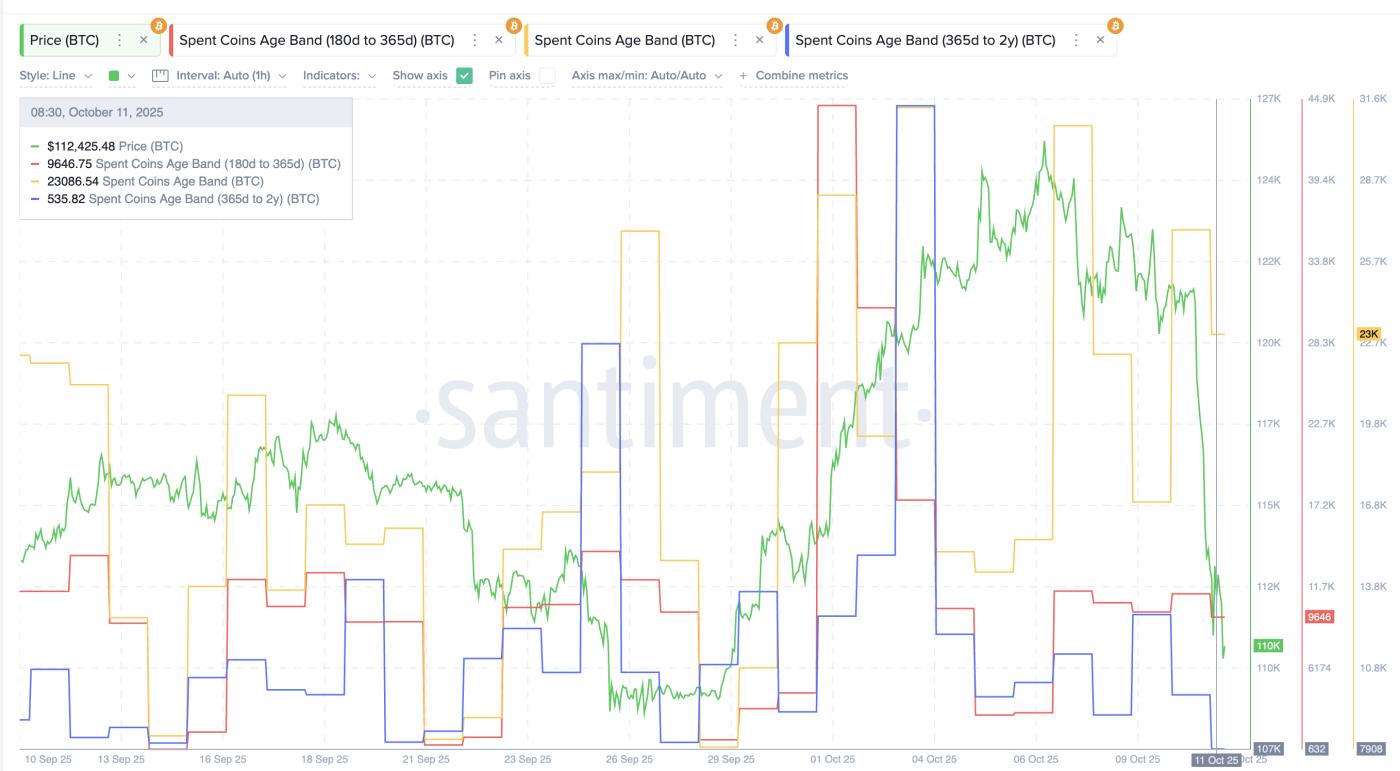 Bitcoin Spent Coins Age Band Index: Santiment
When long-term holders become inactive and the total number of holders increases, this usually signals that strong hands are replacing weak hands in the market. It is the type of correction that helps stabilize a psychological decline before the next uptrend.
Bitcoin Price Setup Turns From Bearish to Bullish
Bitcoin's price action tells a clearer story. The recent drop isn't just psychological — it follows a technical setup that often marks turning points.
The key factor is the bearish divergence on the Relative Strength Index (RSI), which measures buying and selling momentum on a scale of 0 to 100.
A divergence forms when RSI and price move in opposite directions — for example, when price makes a higher high but RSI makes a lower high. This pattern often signals that momentum is weakening before a reversal.
That's exactly what happened from mid-July to early October. Bitcoin made new highs on the chart, but the RSI didn't confirm them, creating lower highs.
The result was a sharp 19.1% correction (yesterday), which more closely resembles a divergence-driven drop earlier this year by 14%. These setups show how strongly Bitcoin reacts to RSI signals.
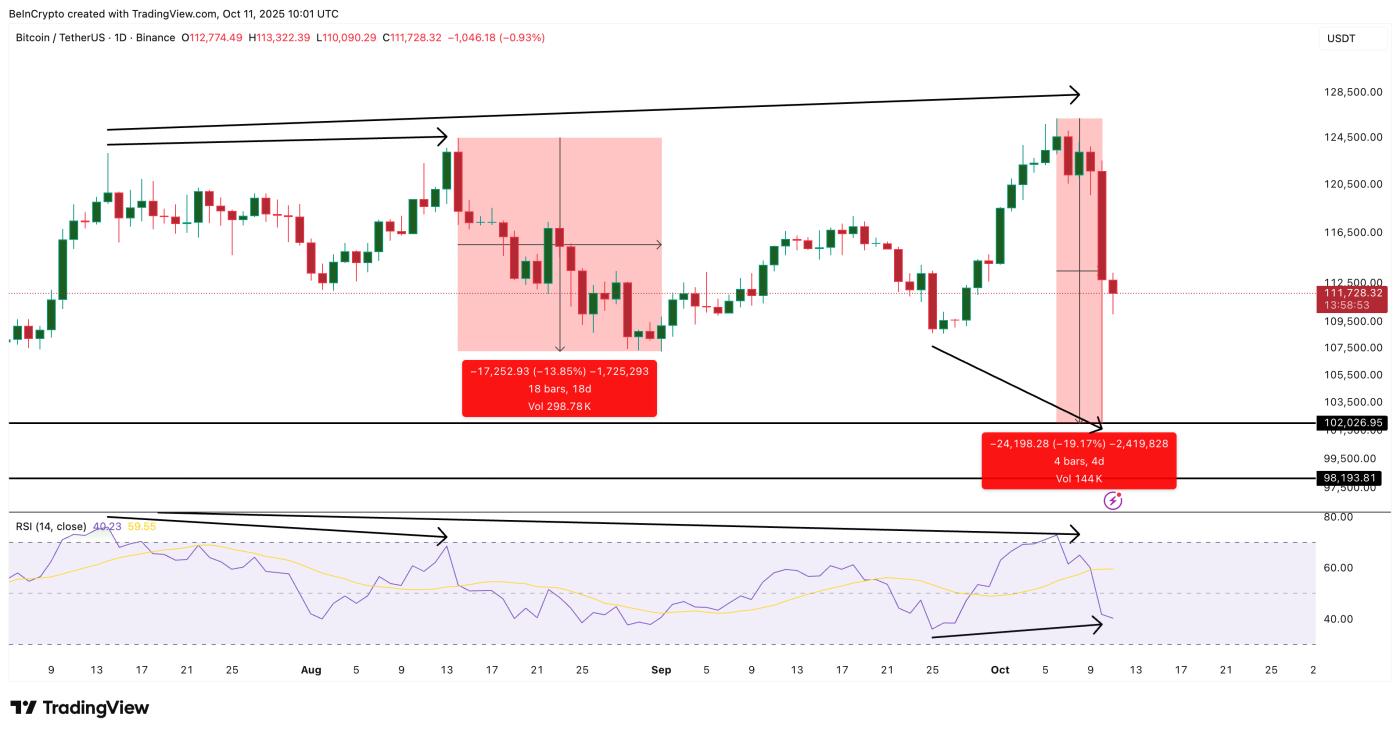 Bitcoin Price Divergence: TradingView
Now, the pattern has reversed. Between September 25 and October 11, a bullish divergence appeared—price made a lower Dip while RSI made a higher Dip . This suggests that selling pressure is losing strength, and momentum may be quietly building for a recovery.
At the time of writing, Bitcoin is trading near $111,600, which is in line with the 0.5 Fibonacci level ($111,400). A daily close above this level could confirm renewed strength towards $113,600, $116,800, and $120,800.
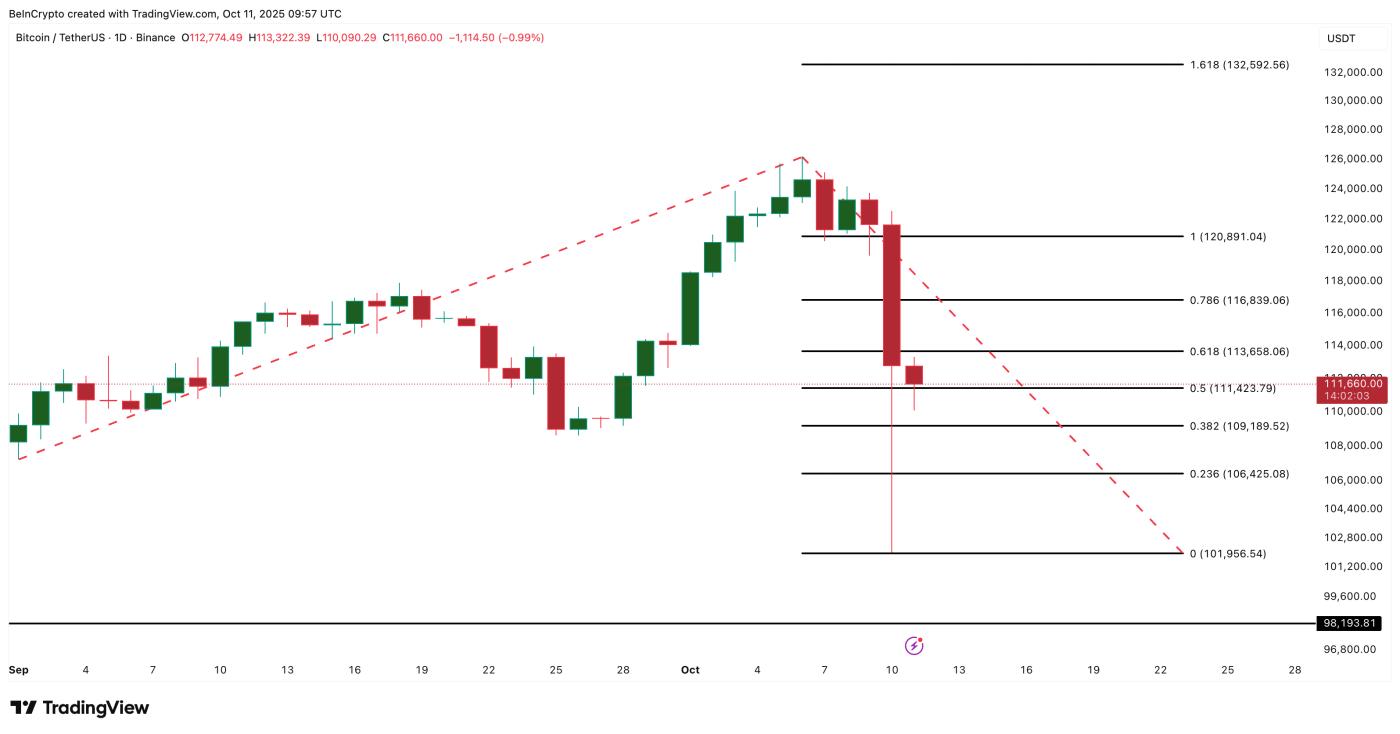 Bitcoin Price Analysis: TradingView
The invalidation point is below $109,100, with downside potential limited to $106,400 and $101,900, making a drop below $100,000 unlikely in the short term. Only a daily candle close below $101,900 could push Bitcoin below $100,000.


