

The market remains bearish after yesterday's sharp dump, according to CoinStats.
BTC/USD
The price of Bitcoin (BTC) has dropped by 8% since yesterday.
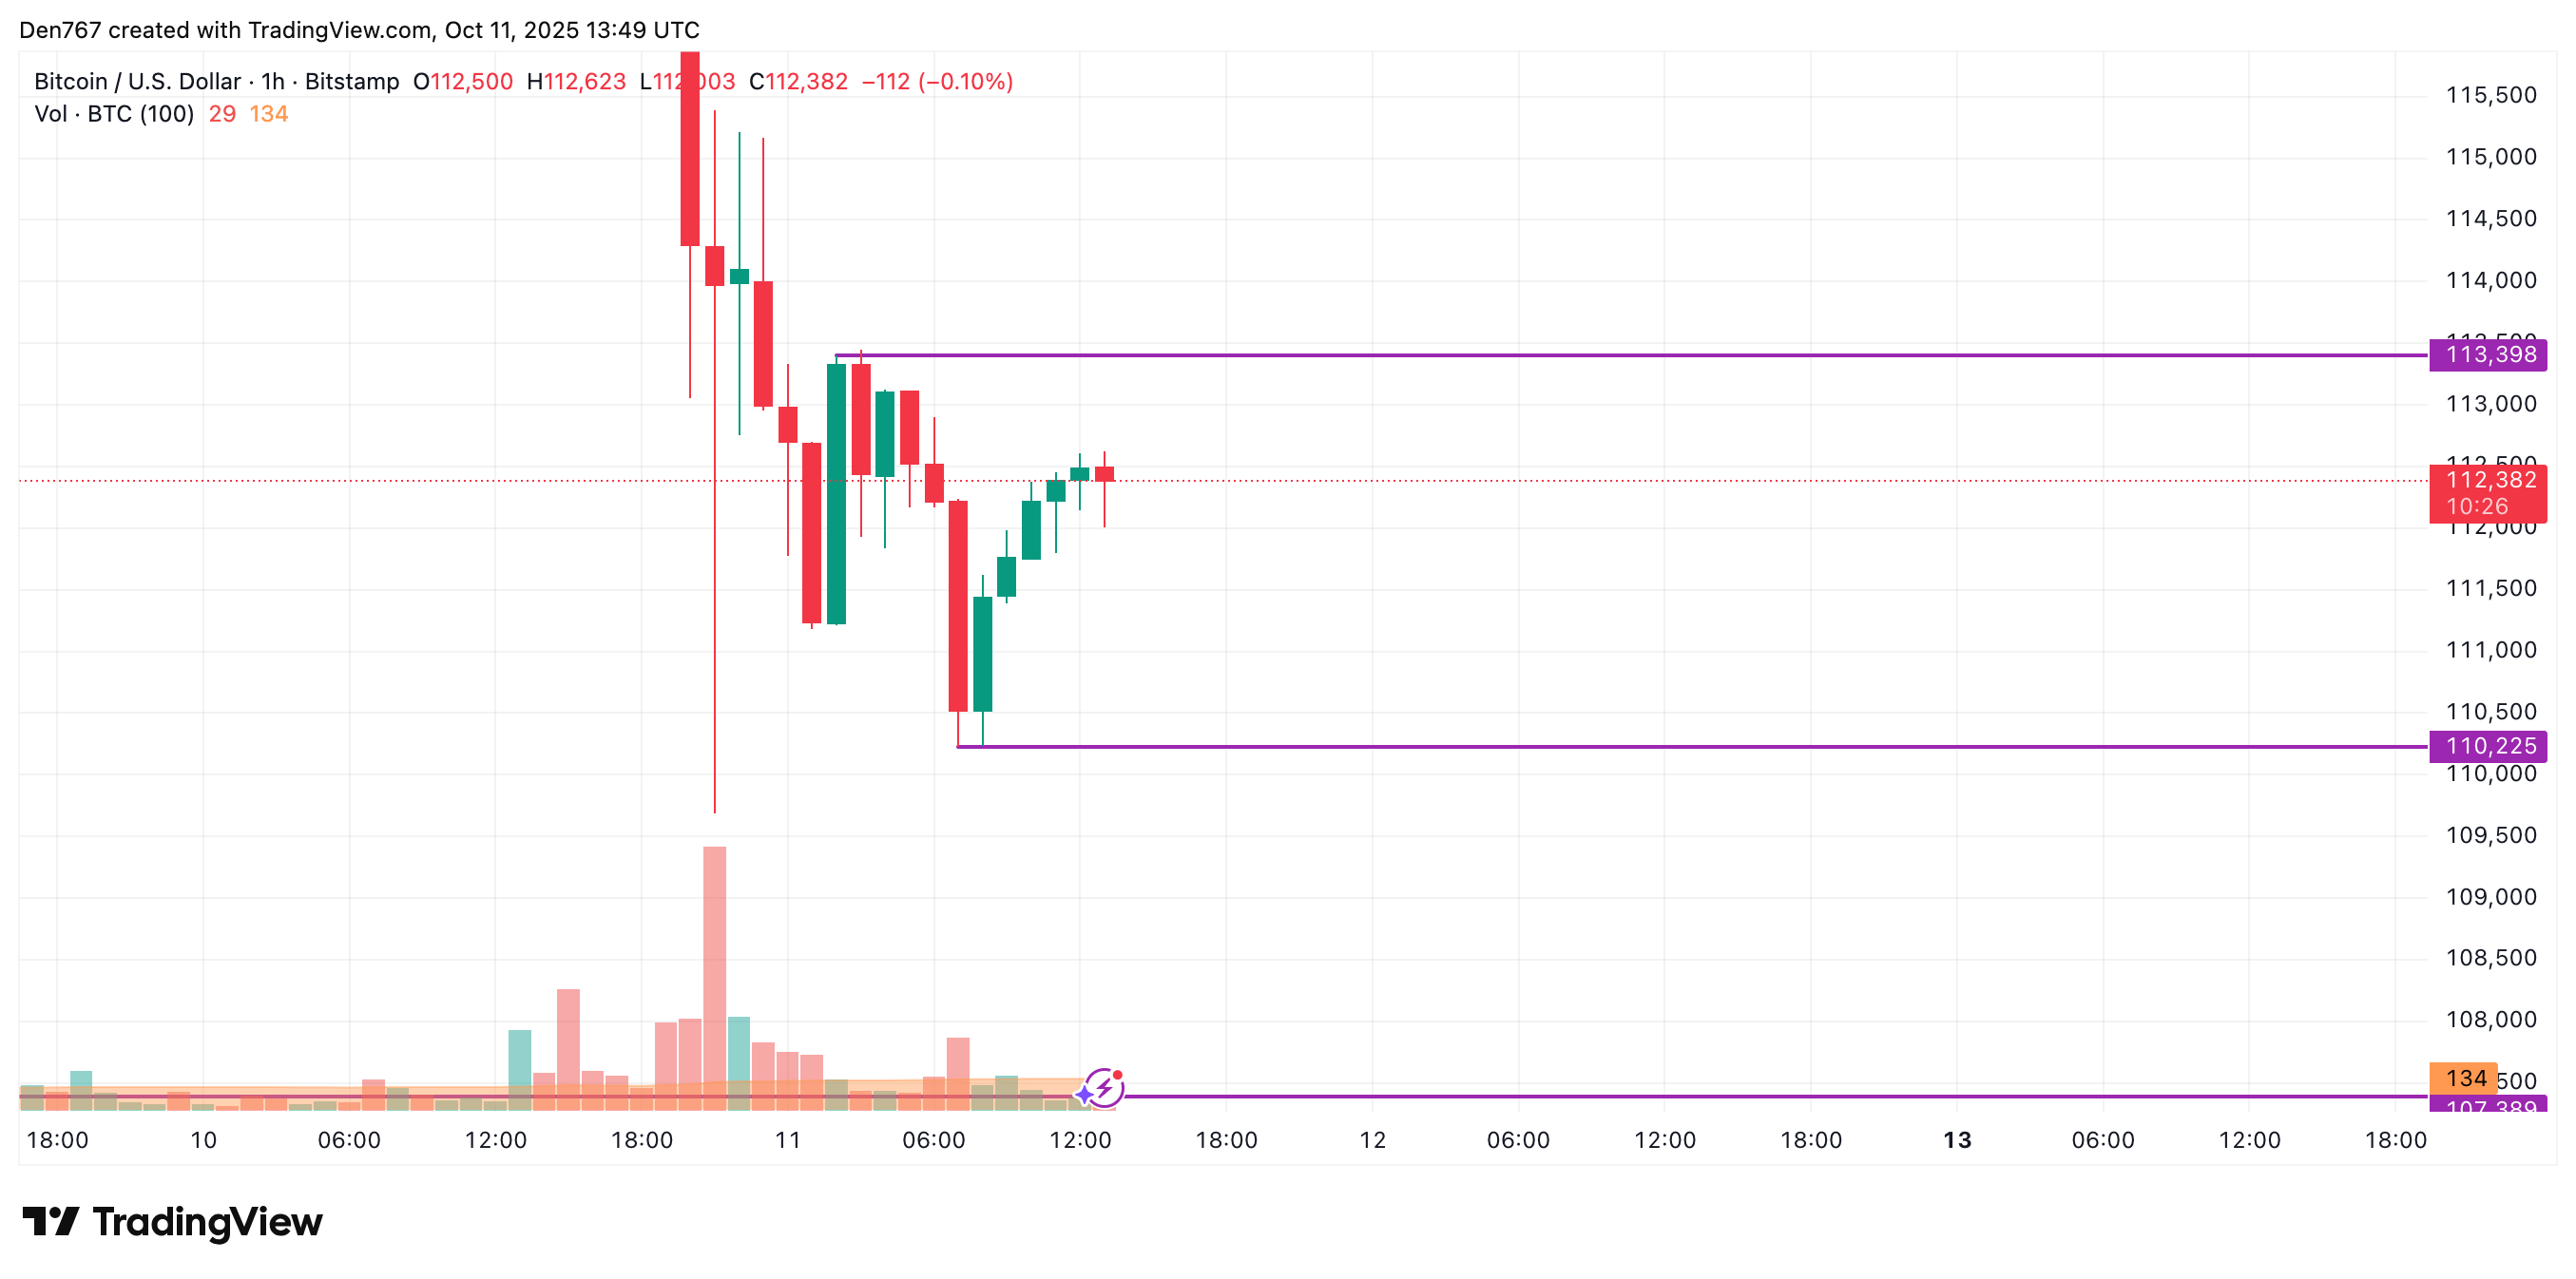
On the hourly chart, the rate of BTC is closer to the resistance than to the support level. If buyers' pressure continues, one can expect a breakout, followed by a further upward move to the $114,500-$115,000 zone.
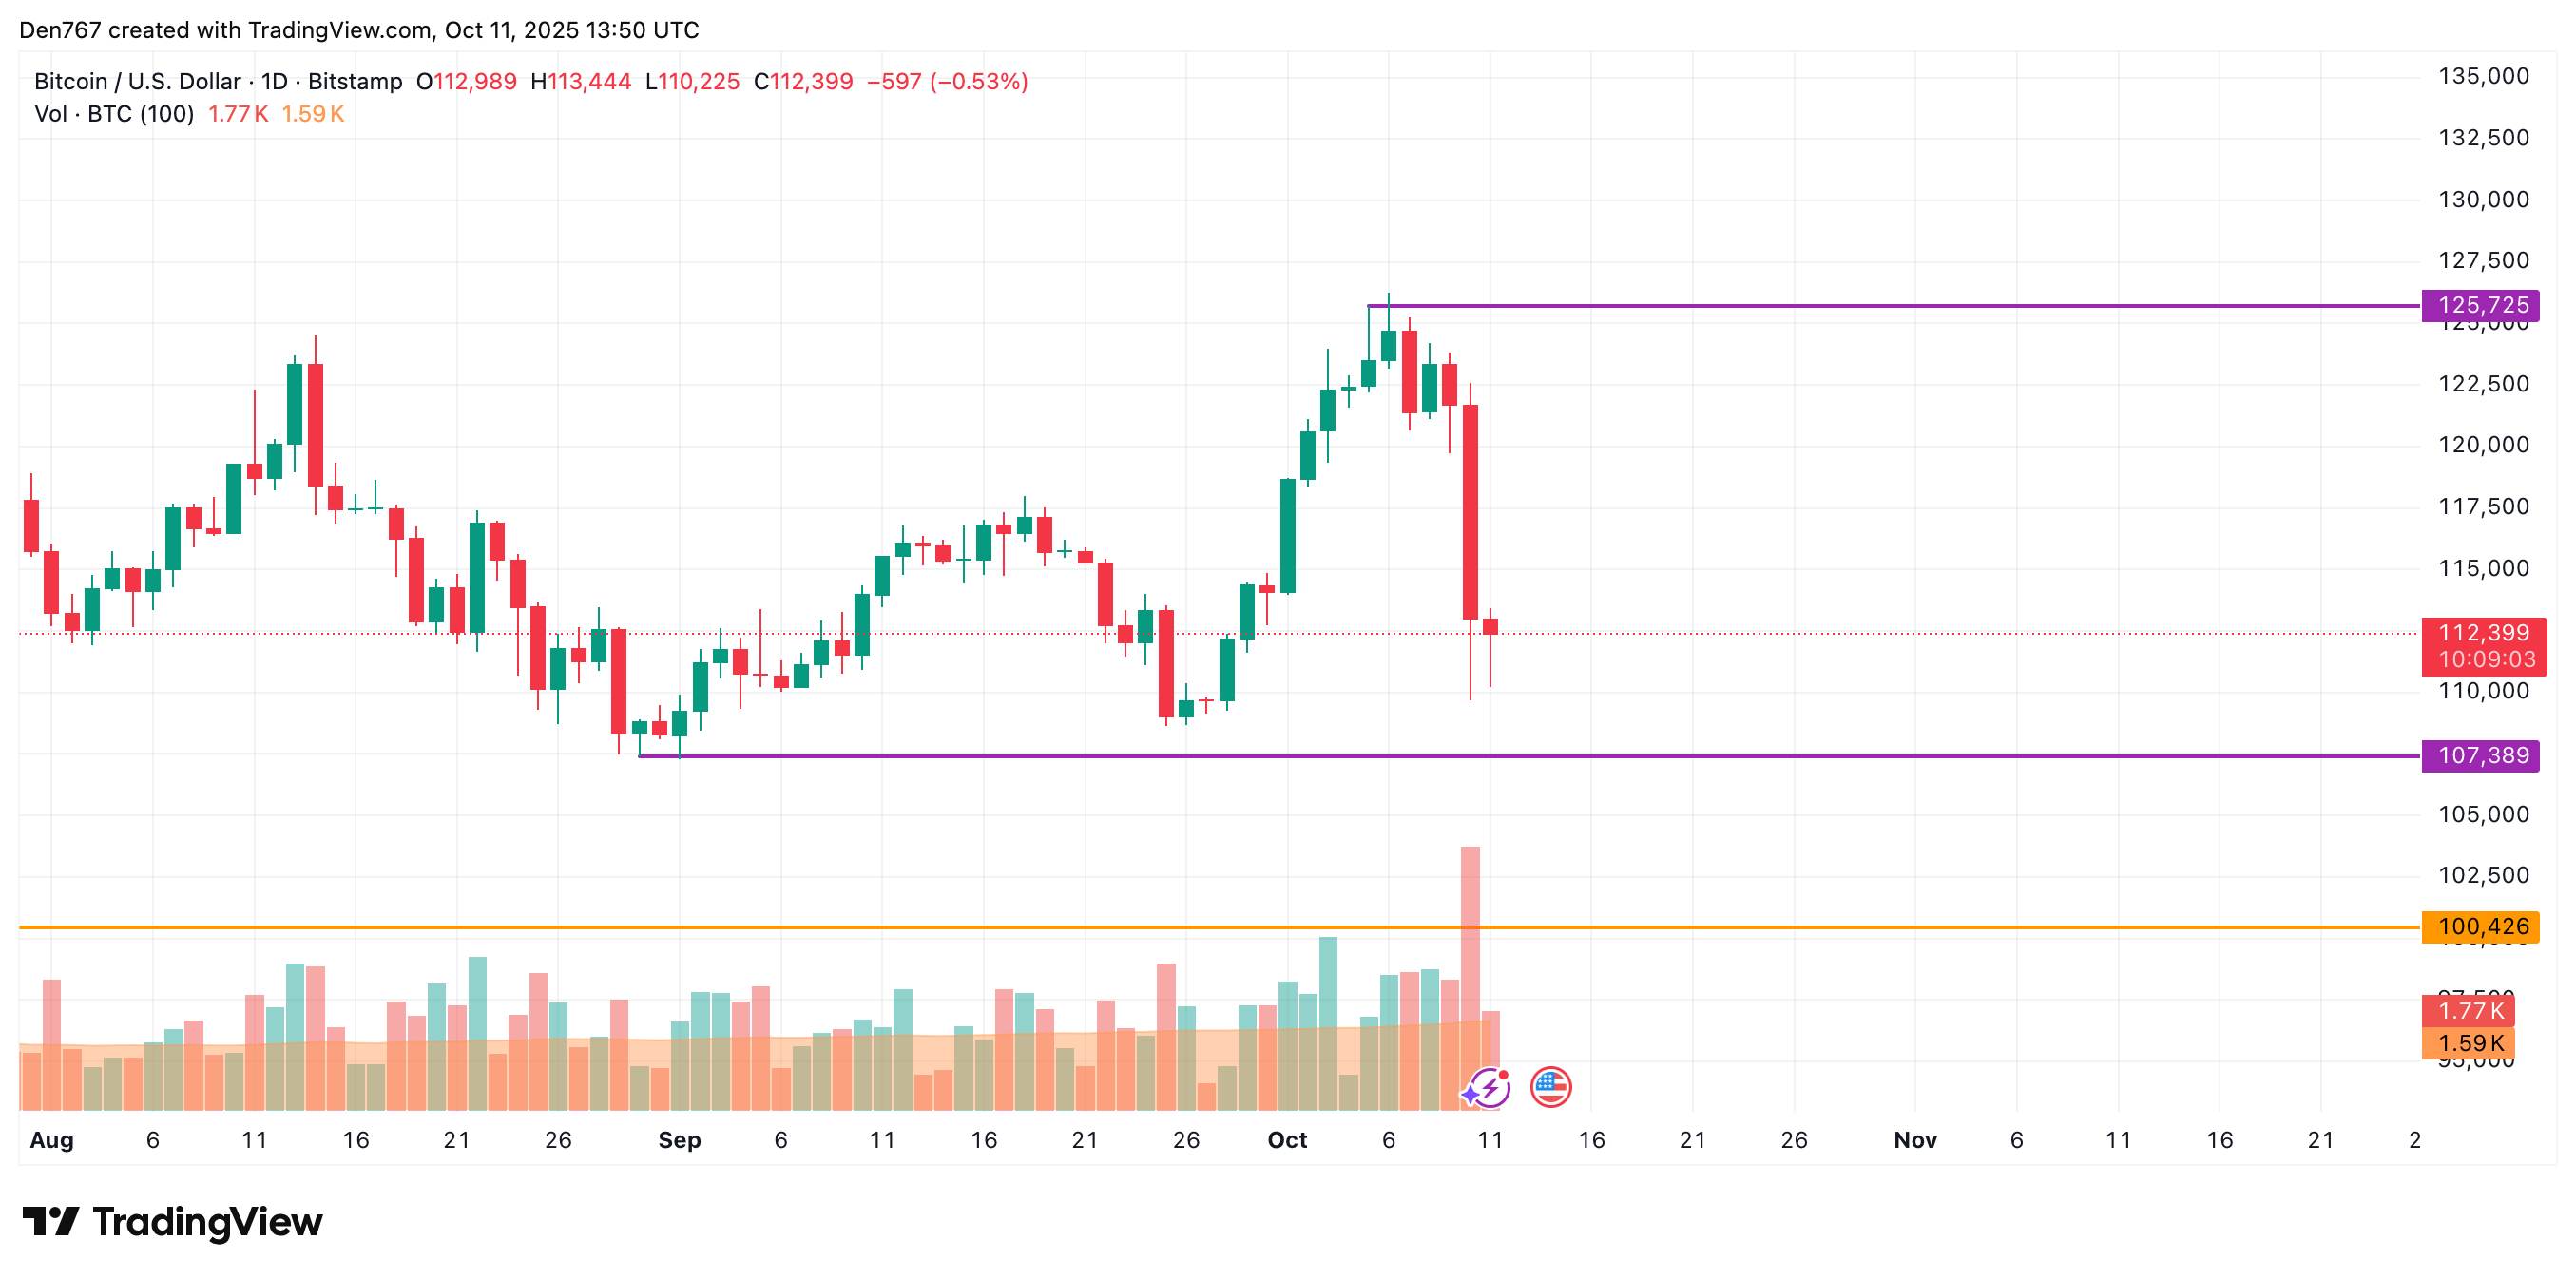
On the bigger time frame, the picture remains bearish as the price of the main crypto has not bounced back far from the support level.
In this case, sideways trading in the range of $111,000-$114,000 is the more likely scenario.
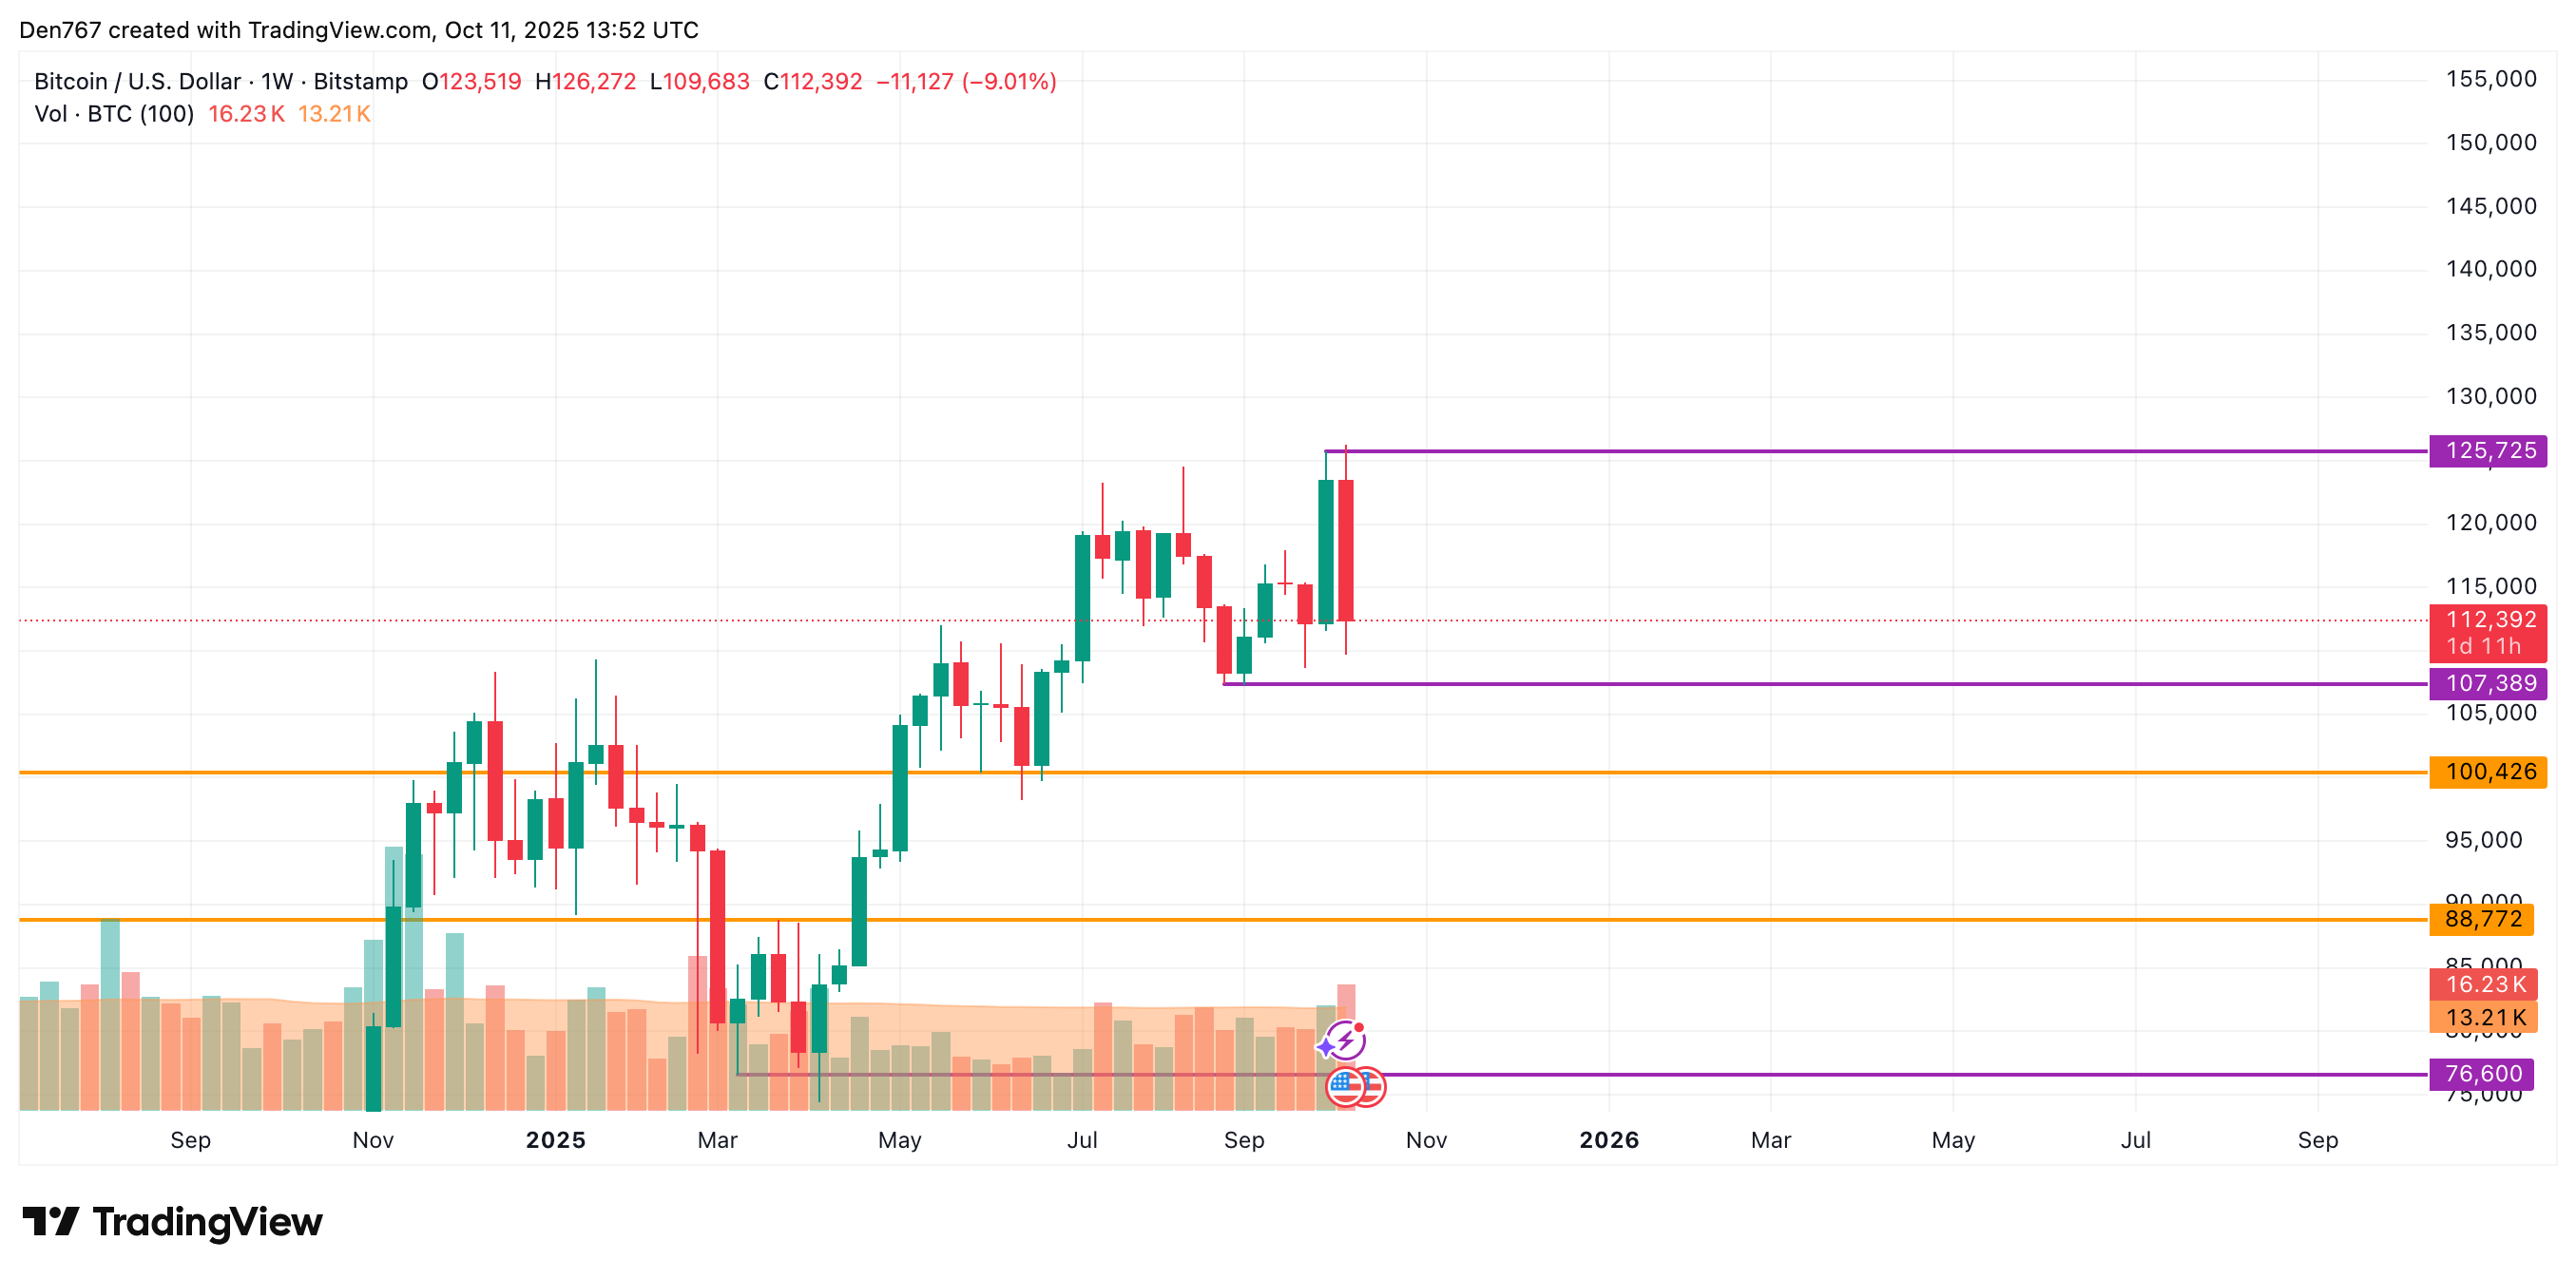
From the midterm point of view, sellers have seized the initiative. If the weekly bar closes below the previous candle low at $111,597, the drop may lead to a test of the $100,000-$105,000 zone soon.
Bitcoin is trading at $112,392 at press time.


