Pi Coin has held up better than most major cryptocurrencies as the crypto market corrected more than 3% today. While Bitcoin, Ethereum, and BNB fell between 3% and 12%, Pi Coin's price has only fallen 1.5% in the past 24 hours — a rare display of resilience. However, traders are now faced with a puzzle: two opposing chart signals that could determine whether the next move will bring a recovery or another drop.
Currently, Pi Coin's structure is caught between cautious optimism and fading power.
Two signals, one uncertain outcome
Pi Coin's chart shows an interesting clash between buying power and momentum weakness — two signals that often guide short-term price direction.
The Money Flow Index (MFI), which tracks money flowing in and out of assets, rose even as Pi Coin's price made lower lows from August 1 to October 9. This is often considered a bullish divergence, indicating that while the price has been falling, new buying has quietly emerged in the market. It reflects growing interest from retail investors — the kind of slow accumulation that often forms the basis for a recovery.
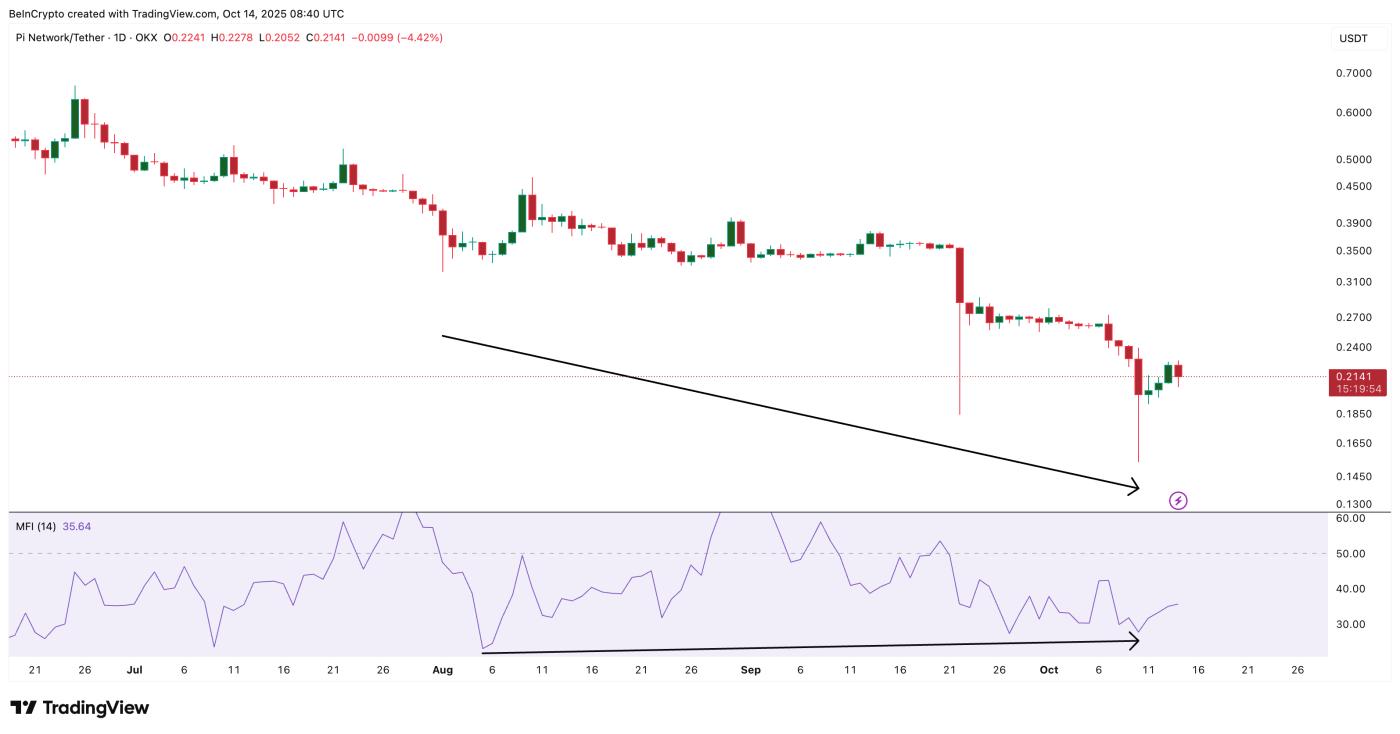 Pi Coin Showing Money Flow: TradingView
Want more information about Token like this? Sign up for Editor Harsh Notariya's daily Crypto Newsletter here .
However, from October 6 to October 13, PI's Relative Strength Index (RSI) — a measure of market momentum — painted a hidden bearish divergence. Price made lower highs while RSI made higher highs, suggesting that buying momentum was fading even amid short-term recovery attempts.
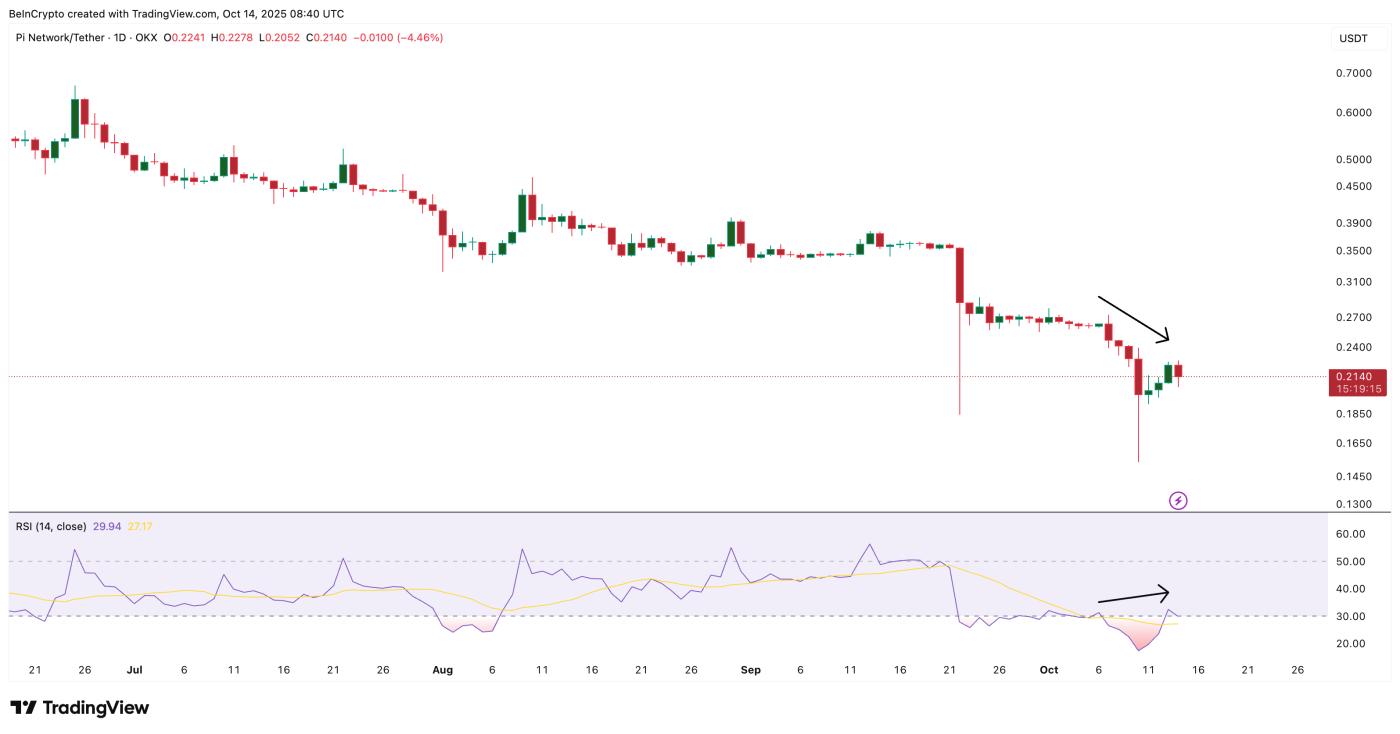 Pi Coin RSI Showing Bearishness: TradingView
Rather than being completely at odds with each other, the two indicators may be showing different stages of the same process: the MFI points to initial consolidation, while the RSI warns that a recovery may face resistance before stronger confirmation. For traders, that means the setup remains neutral — with a slight tilt toward caution until the next breakout or breakdown confirms the direction.
More on this in the next section where we discuss Pi Coin price action .
Pi Coin Price Setup Reveals Falling Wedge Pattern
From a structural perspective, Pi Coin price is trading within a Falling Wedge pattern — a pattern that often hints at a potential bullish reversal on the daily chart.
To confirm strength, a daily Pi Coin price candle must move above $0.29, which would indicate a breakout from the wedge and potentially attract new buying volume.
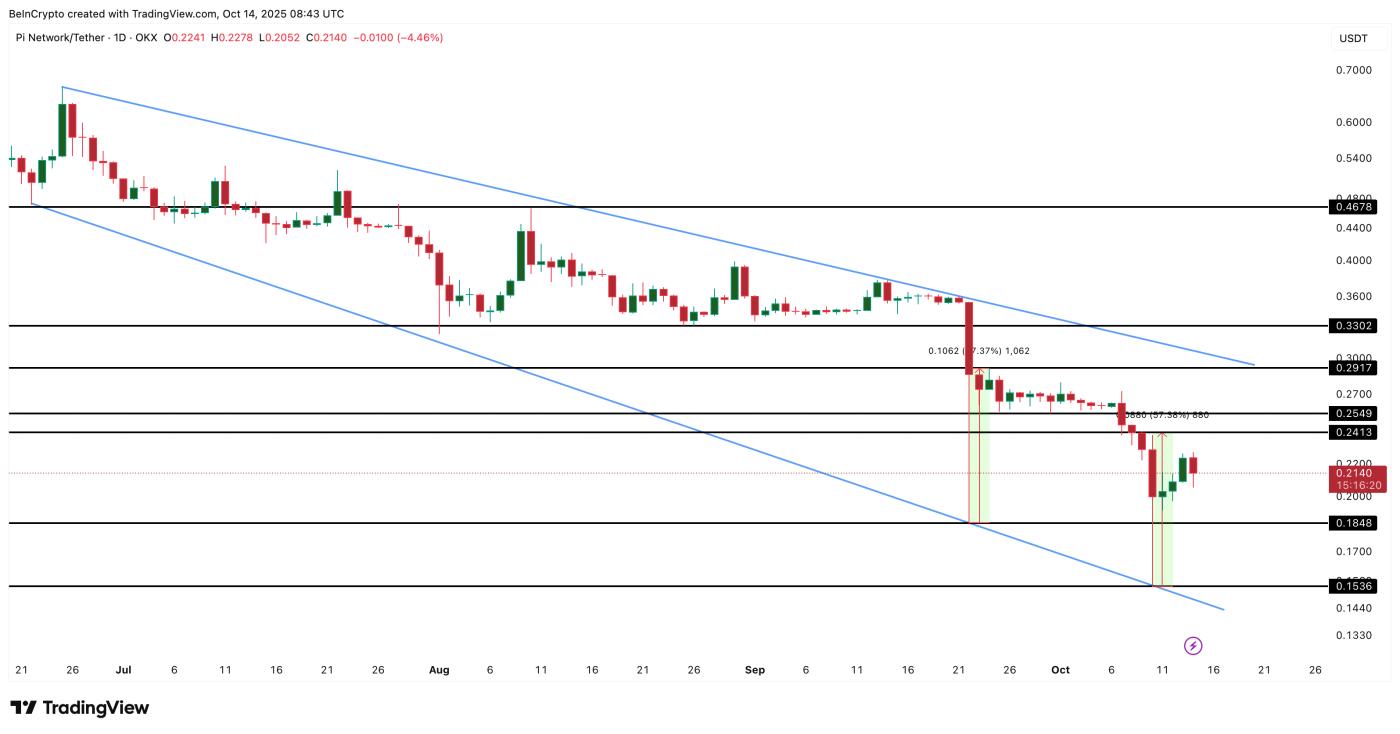 Pi Coin Price Analysis: TradingView
However, if we look at recent history alone, a similar rally as September 22, when PI rose 57% from $0.18 to $0.29, could be possible. This implies short-term targets around $0.24–$0.25, with an extended move towards $0.29 possible if momentum picks up. And a clear break of $0.29 would mean bullish strength for Pi Coin price.
At the time of writing, Pi Coin (PI) is trading near $0.21, with strong support around $0.18 and $0.15. A daily close below $0.15 would break the falling wedge, invalidating the bullish setup.
Currently, PI remains one of the few coins that has outperformed the market but is still walking a thin line. Whether MFI-led accumulation prevails or RSI-led weakness prolongs the correction, the Falling Wedge will be the final judge of where Pi Coin price will go next.