#TRX
- TRX is trading near Bollinger Band support with positive MACD momentum indicating potential upward movement
- Market sentiment shows TRX gaining recognition amid selective altcoin strength and whale activity focus
- The 20-day moving average at 0.330965 represents key resistance that must be breached for sustained bullish momentum
TRX Price Prediction
TRX Technical Analysis: Current Market Position and Indicators
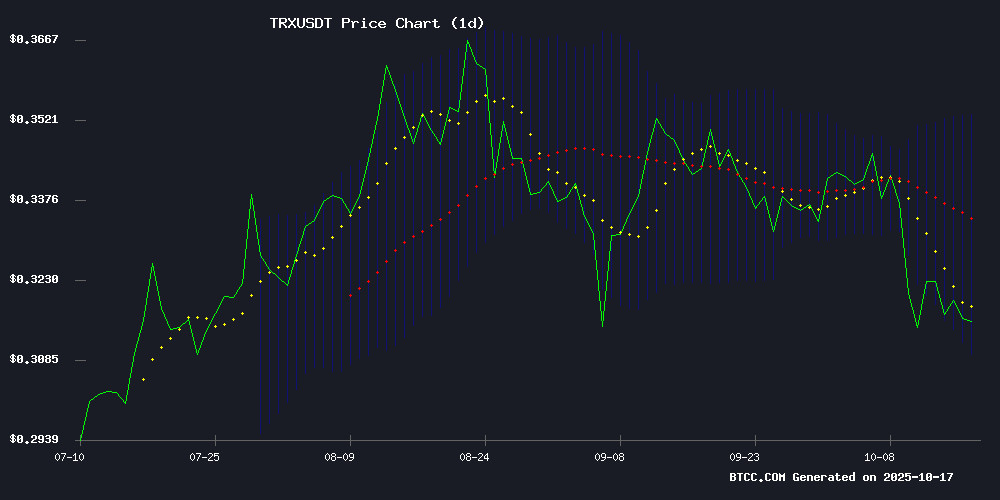
According to BTCC financial analyst Emma, TRX is currently trading at 0.31030000 USDT, positioned NEAR the lower Bollinger Band at 0.308294. The 20-day moving average stands at 0.330965, indicating the current price is below this key level. The MACD reading of 0.009709 above the signal line at 0.005317 shows positive momentum, though the histogram value of 0.004392 suggests moderate bullish strength.
Emma notes that TRX is testing support at the lower Bollinger Band while maintaining above this critical level. The proximity to the moving average resistance at 0.330965 will be crucial for determining near-term direction.
Market Sentiment: TRX Gains Traction Amid Selective Altcoin Strength
BTCC financial analyst Emma observes that recent market developments show TRX gaining attention while broader altcoin markets display selective strength. The current sentiment reflects growing interest in TRX as it emerges among highlighted cryptocurrencies this month, alongside stable Bitcoin performance and emerging projects like BullZilla.
Emma emphasizes that whale activity and altcoin stability patterns are drawing attention to selective opportunities, with TRX positioned as one of the beneficiaries of this market dynamic. The technical outlook aligns with this positive sentiment, though investors should monitor broader market conditions.
Factors Influencing TRX's Price
Whale Activity and Altcoin Stability Highlight MoonBull ($MOBU) as Top Crypto Pick
Binance (BNB) and TRON (TRX) are anchoring altcoin stability this October, with BNB navigating exchange policy shifts while TRX holds above $0.32. Against this backdrop, MoonBull ($MOBU) emerges as the week's standout high-growth candidate, drawing whale wallets and analyst attention.
MoonBull's Mobunomics framework combines liquidity reinforcement (2% per transaction), reflections (2%), and deflationary burns (1%) with a 95% APY staking incentive from Stage 10. The Ethereum-based project allocates 14.6 billion tokens to rewards, while its Stage 12 governance model enforces a one-token-one-vote principle.
Altcoin Market Shows Selective Strength Amid Broad Weakness
The Altcoin Season Index hovers NEAR 28, signaling subdued breadth across the sector. Yet beneath the surface, targeted activity persists as traders focus on assets demonstrating clear technical or liquidity signals.
DeXe Network (DEXE) rises 5% to $7.12, showcasing orderly accumulation patterns rather than speculative spikes. The governance token's steady volume and tight spreads suggest sustained institutional interest despite broader market lethargy.
Tron (TRX) stabilizes after successfully retesting support levels, while Jupiter (JUP) attracts heightened trading activity despite flat price action. These movements paint a picture of disciplined capital allocation rather than euphoric speculation.
Best Cryptos to Buy This Month: BTC Holds Steady, TRX Gains Traction, and BullZilla Emerges as a Dark Horse
Bitcoin maintains its position at $110K, demonstrating resilience amid market fluctuations. tron hits a significant milestone with 3 million active accounts, signaling growing adoption.
Meanwhile, BullZilla's presale performance—boasting a 3,200% ROI—has captured market attention. The Ethereum-based project combines narrative-driven tokenomics with mechanical scarcity through its 'Roar Burn' mechanism. A 70% APY HODL Furnace further intensifies investor interest.
Is TRX a good investment?
Based on current technical indicators and market sentiment analyzed by BTCC financial analyst Emma, TRX presents a mixed but cautiously optimistic investment case. The cryptocurrency is currently trading near support levels with positive momentum indicators, while market sentiment shows growing recognition of TRX's potential.
| Indicator | Current Value | Interpretation |
|---|---|---|
| Current Price | 0.31030000 USDT | Near lower Bollinger Band support |
| 20-day MA | 0.330965 | Resistance level above current price |
| MACD | 0.009709 | Positive momentum signal |
| Bollinger Bands | 0.308294-0.353636 | Trading near lower range |
Emma suggests that while TRX shows technical strength with the MACD in positive territory and holding above key support, investors should consider the proximity to moving average resistance and monitor for breakout confirmation. The combination of technical positioning and positive market sentiment makes TRX worth monitoring for potential entry opportunities, though prudent risk management remains essential.