Bitcoin Price Crash Toward $100K Amid Heavy Selling Pressure
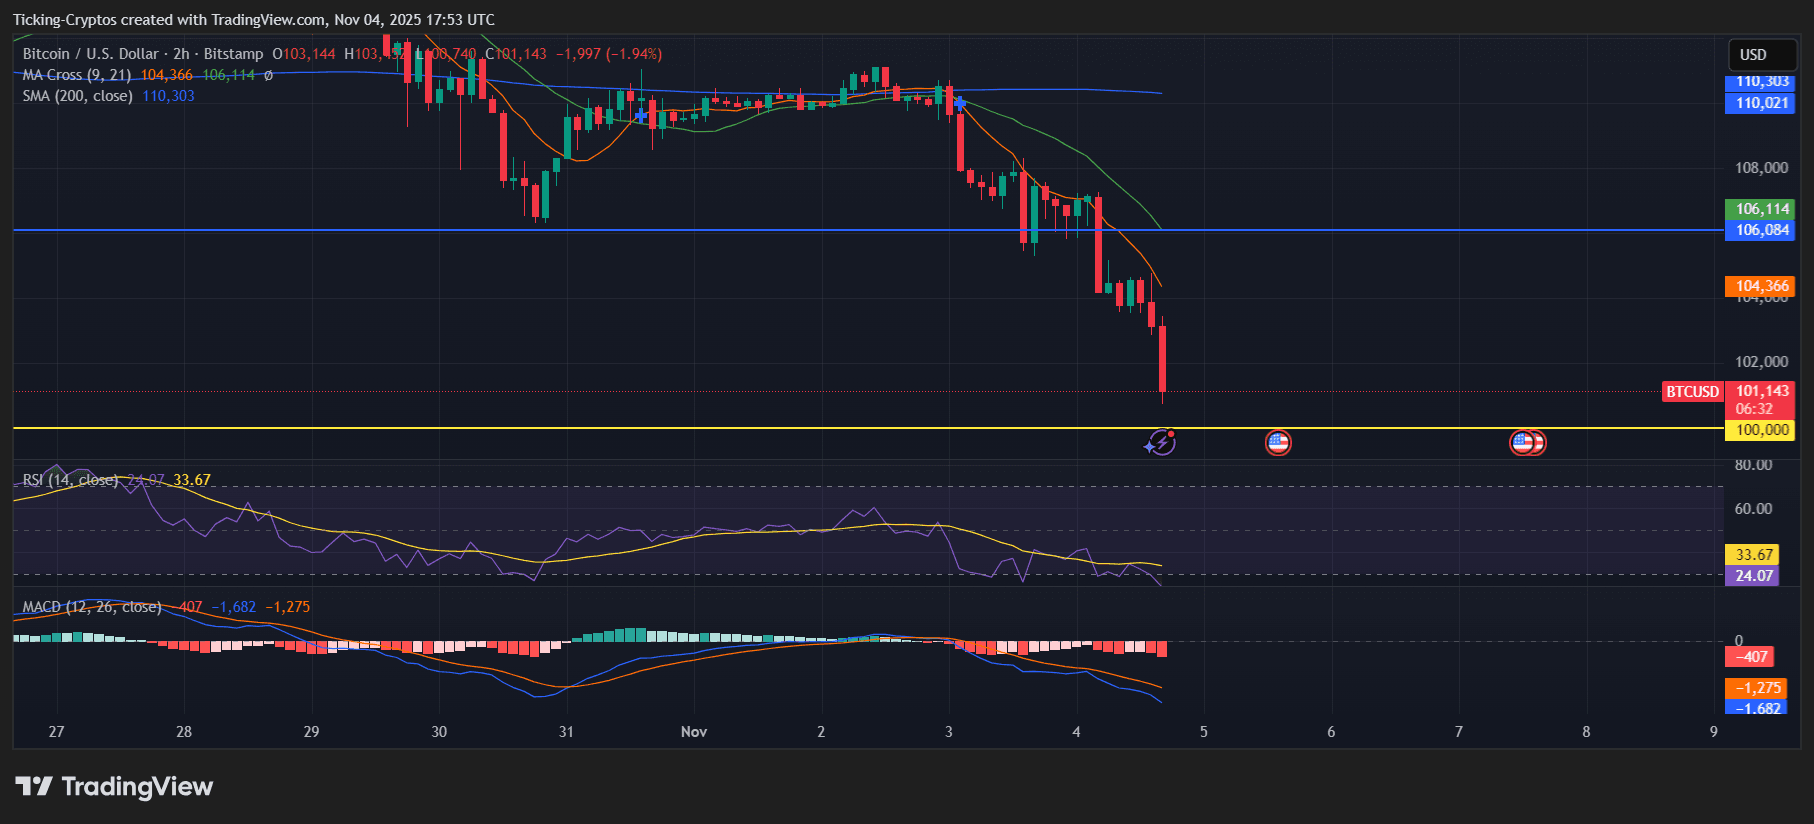
Bitcoin ($BTC) has tumbled close to the key $100,000 mark — its most critical psychological and technical level this quarter. Over the past 48 hours, BTC fell from around $107K to just above $100K, breaking below major supports around $104K and $106K.

BTC/USD 2-hour chart - TradingView
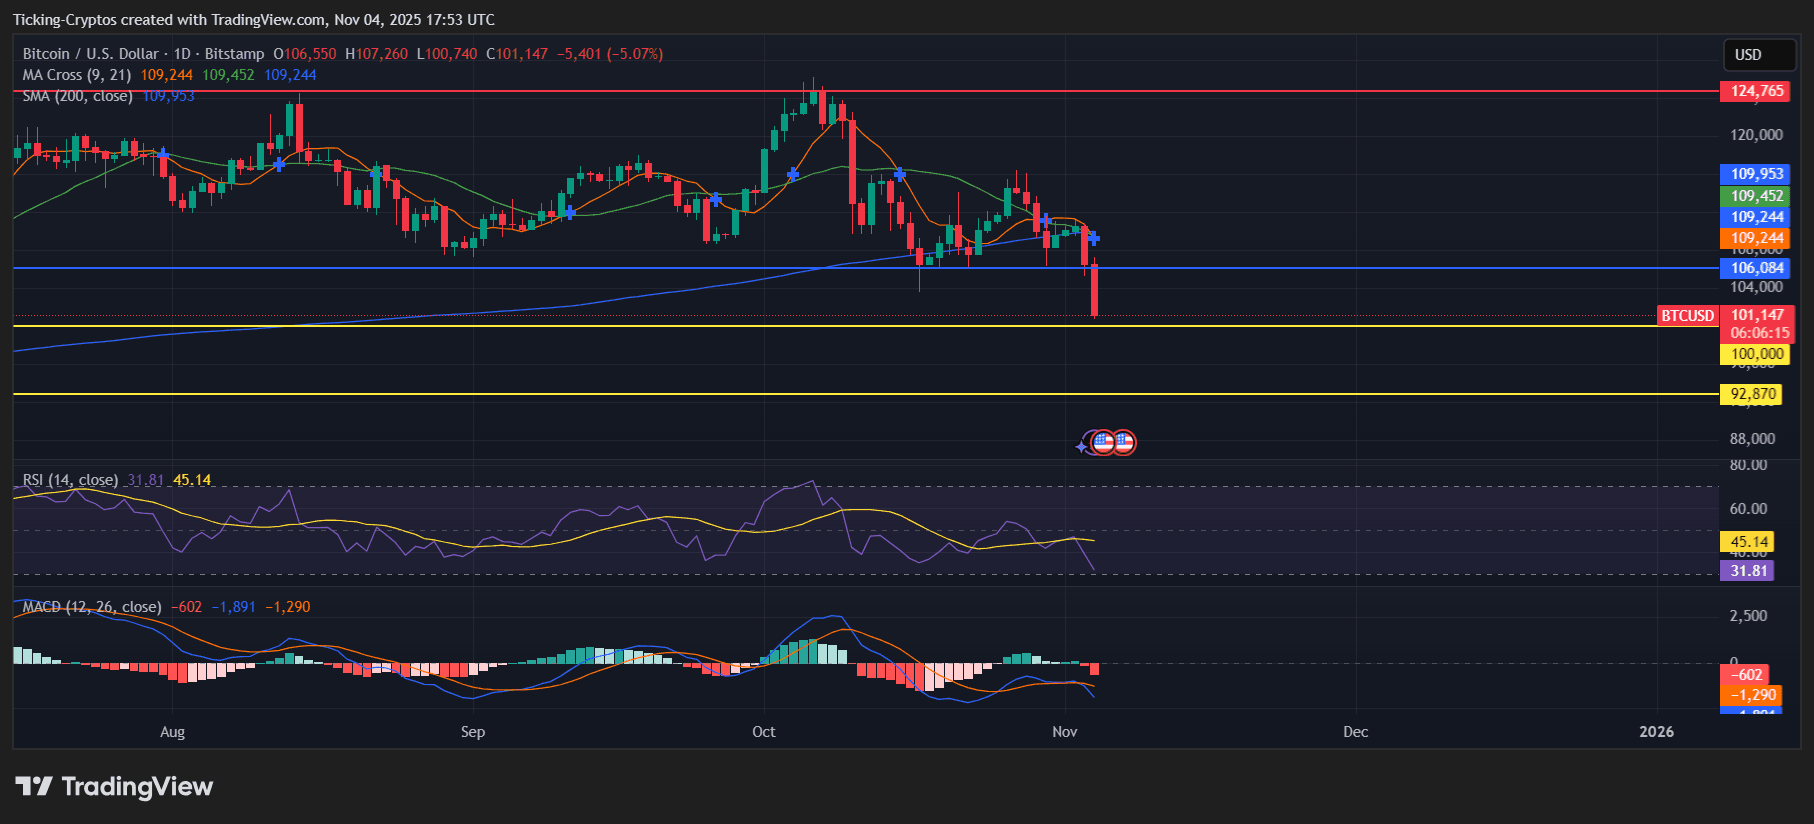
The daily chart shows a confirmed bearish crossover between the 9-day and 21-day moving averages, both now trending below the 200-day SMA at $109K. This alignment confirms short-term momentum has shifted firmly to the downside.
Bitcoin Price Analysis Today: Exhaustion but No Reversal Yet
RSI (Relative Strength Index):
On the 2-hour chart, RSI sits around 33.6, approaching oversold levels, which often precede short-term relief rallies. On the daily timeframe, RSI has slipped to 31.8, signaling that BTC is in oversold territory but not yet showing bullish divergence.

BTC/USD 1-day chart - TradingView
MACD (Moving Average Convergence Divergence):
The MACD lines remain sharply below zero on both short and long-term timeframes, with histogram bars widening. This reflects intensifying bearish momentum — a sign that the downtrend could extend if volume remains high.
Next Downside Targets if the Correction Continues
If $Bitcoin fails to defend the $100K area, the next potential downside targets are:
- $97K – $95K: initial liquidity pocket that may trigger a short bounce.
- $92,870: historical support from previous accumulation phases.
- $90K – $88K: stronger demand zone where buyers could re-enter aggressively.
A sustained close below $100K would likely confirm a deeper corrective leg, potentially extending to $85K, marking a 50% retracement from the $125K highs.
Upside Scenarios if BTC Holds the Line
If Bitcoin manages to stabilize above $100K, a short-term rebound could form.
Resistance levels to monitor:
- $104K: former support turned resistance.
- $106K – $109K: confluence zone with key moving averages.
- $112K – $114K: reclaiming this area would restore mid-term bullish structure.
A breakout and daily close above $110K could shift sentiment back toward bullish, targeting $120K and potentially retesting $124K–$125K, the previous all-time high region.


