Bitcoin (BTC) and safe haven assets like Gold (XAU) and Silver (XAG) are on the verge of a price decline, leaving traders and investors on edge as key support levels are broken.
Analysts predict continued volatility, as the Supreme Court is expected to decide on Wednesday whether Trump's taxes are legal.
Bitcoin Heads to June Low as Drop Below $100,000 Seems More Likely
Cryptocurrency markets are poised for volatility on Wednesday, as the Supreme Court is expected to decide whether Trump’s tariffs are legal.
“They can say whatever they want. I'm here to emphasize that this is an economic emergency,” said Finance Minister Scott Bessent in an interview with Fox.
Meanwhile, Bitcoin continued to fall after falling to the $103,000 price zone on Tuesday. The possibility of further declines remains, with worrying actions from major players in the market making traders nervous.
From a technical perspective, selling pressure is overwhelming buying pressure, as evident by the yellow volume charts (bears) dominating over the grey volume charts (bulls). Meanwhile, momentum indicators like the RSI (Relative Strength Index) show that buying power is receding, as it continues to record lower highs.
Based on this, Bitcoin could continue to fall, possibly reaching the psychological level of $100,000 . A candle close below $100,300, the midpoint of the demand zone from $102,120 to $98,200, could confirm a continuation of the downtrend.
Such a move would pave the way for further declines, with bulls waiting for Bitcoin price around $93,708. This could be the turning point, opening the door for the pioneer coin to recover and creating an entry point for later bulls.
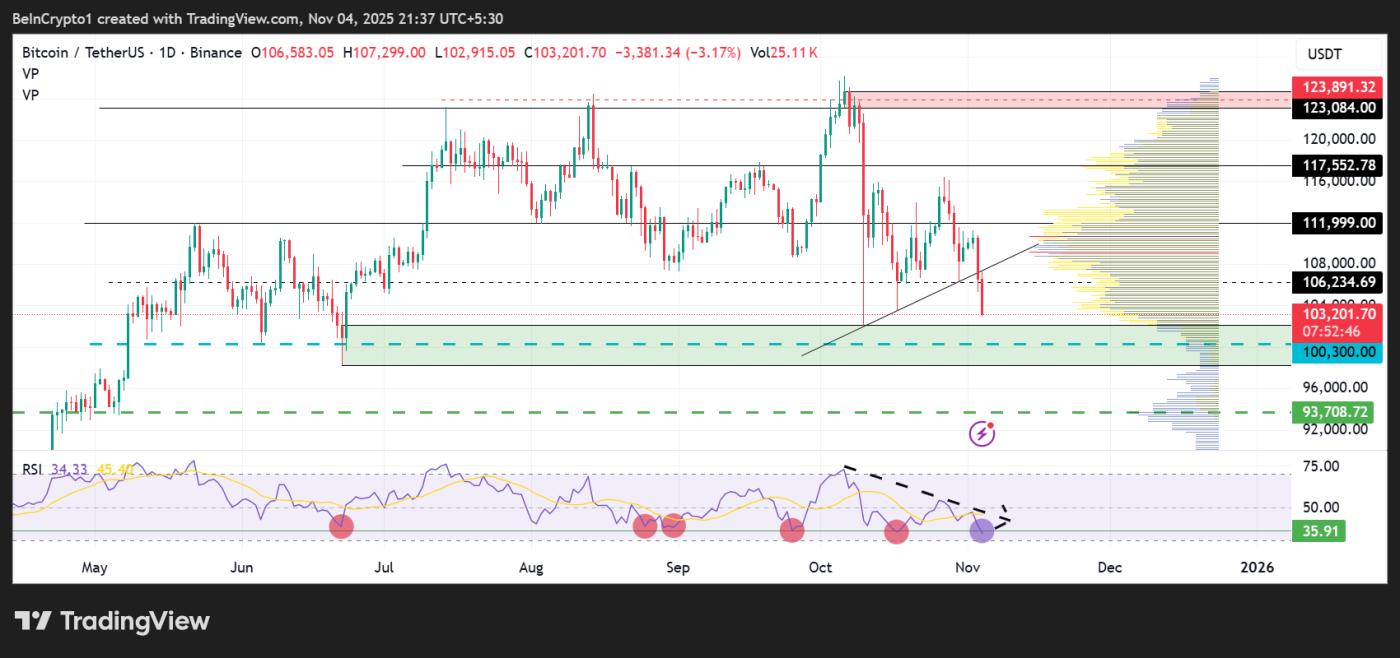 Bitcoin (BTC) Price Performance. Source: TradingView
Conversely, the position of the RSI, marked by a purple area, suggests that momentum could be about to increase if history repeats itself. Looking back, every time the RSI has dropped near 35, the momentum index has recovered and the price has followed suit.
Furthermore, the RSI is approaching the oversold zone, which usually signals a bullish recovery. Increased buying pressure, therefore, could send Bitcoin price back towards the top of the ascending trendline.
However, while a breakout above $111,999 and $117,552 would be ideal, only a break and close above $123,891 on the daily chart could indicate the possibility of a new all-time high.
Gold prices fall below $4,000 as hopes of a Fed rate cut fade
While Bitcoin hinted at a deeper decline, Gold was also falling, slipping below the psychological $4,000 level on Tuesday. Analysts attributed the decline to fading hopes of a rate cut in 2025.
Data from the CME FedWatch Tool shows a 69.9% probability of a drop to the 3.50 to 3.75% range, while the probability is increasing that it will remain at 3.75 to 4.00% . Against this backdrop, gold prices are falling.
The decline came after gold prices formed a symmetrical triangle , with the break of the lower trendline indicating a bearish trend. Currently, with support at $3,938, XAU prices are at a turning point.
A break of this support level could extend the downtrend, with a 4-hour candle close below $3,915 setting the stage for an extended leg down. This could see gold prices fall to collect selling liquidation below $3,899, potentially reaching the level last tested on October 28, 2023, at $3,886.
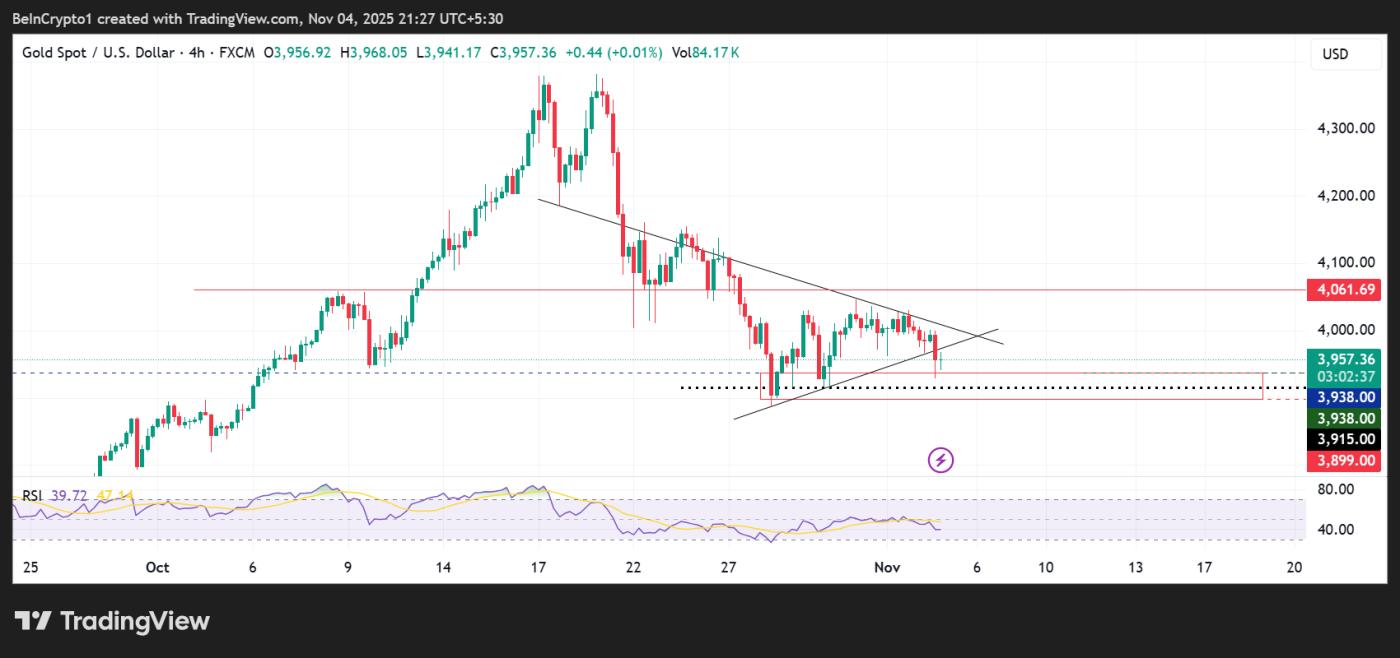 Gold (XAU) price performance. Source: TradingView
On the other hand, if buying momentum increases above current levels, gold prices could resume trading within the triangle, increasing the possibility of a breakout above the upper boundary.
However, only a decisive candle close above $4,061 on the 4-hour timeframe would make the precious metal attractive to buy again.
Pressure from above brings silver to the brink of falling to $46.24
Silver could take its cue from gold prices , dropping to $46.24 (marked by the 38.2% Fibonacci retracement level) before recovering.
Facing pressure from above due to the crossover of resistance levels between the 50-day and 100-day SMA lines at $48.08 and $49.76, XAG price fell below the midpoint of the gold zone (50% Fibonacci retracement level) at $47.82.
If the $46.24 support fails to hold, bulls could look for the next buying opportunity at $44.30, which coincides with the 23.6% Fibonacci retracement level.
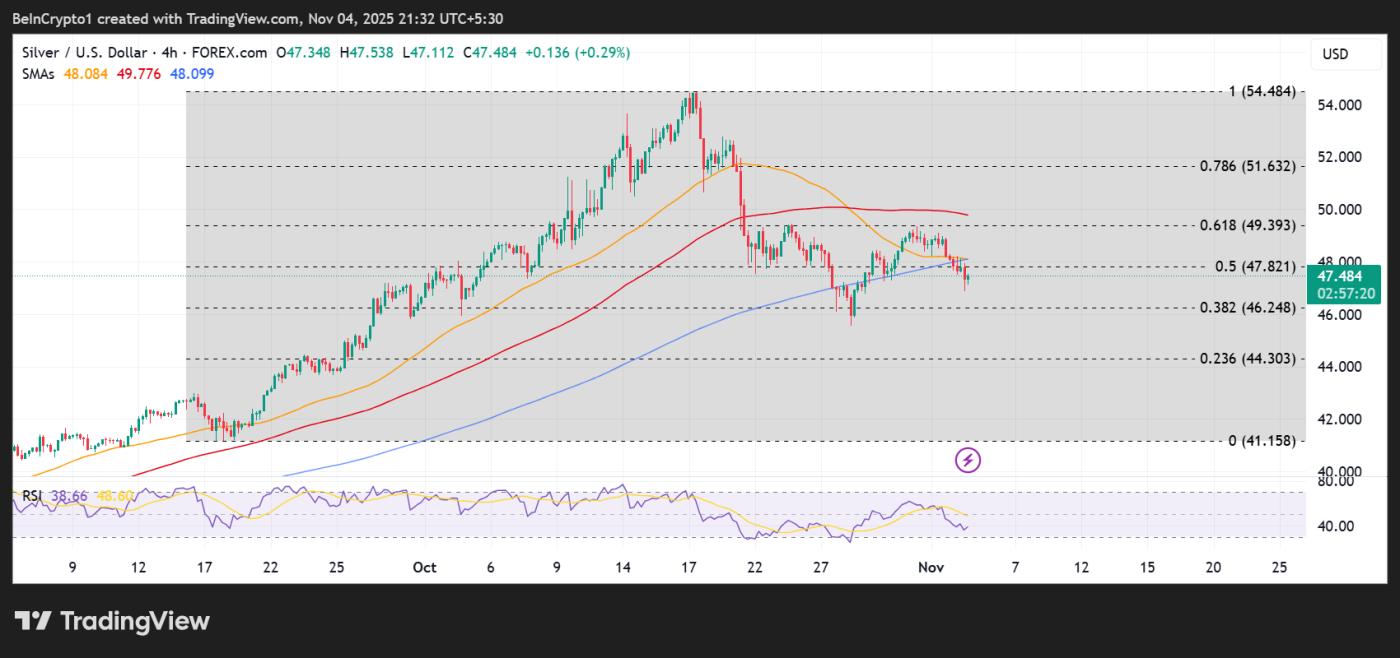 Silver (XAG) price movement. Source: TradingView
Conversely, when the RSI is trending north, momentum is bullish. If sustained, XAG price could rebound, turning the $47.82 resistance into support.
Traders should look out for a bullish crossover, which occurs when the RSI crosses above its signal line (yellow) to the upside. This move could attract further buying, with further buying pressure likely to push silver prices higher.