OFFICIAL TRUMP is showing signs of a short-term recovery after weeks of declines, but the recovery may not be as promising as it seems. The meme coin is trading cautiously, as both Bitcoin's momentum and lack of interest from traders limit its upside potential.
Current market models suggest that the year-end recovery may be pushing towards a deeper correction in Q4.
Official Trump Loses Bitcoin and Its Broad Market Impact
At this point, OFFICIAL TRUMP's correlation with Bitcoin is quite weak, at -0.44. Simply put, this means that TRUMP's price tends to move inversely to Bitcoin. This inverse relationship can be challenging, especially since Bitcoin typically performs strongly in Q4.
Want more information on Token like this? Subscribe to Editor Harsh Notariya's Crypto Daily Newsletter here .
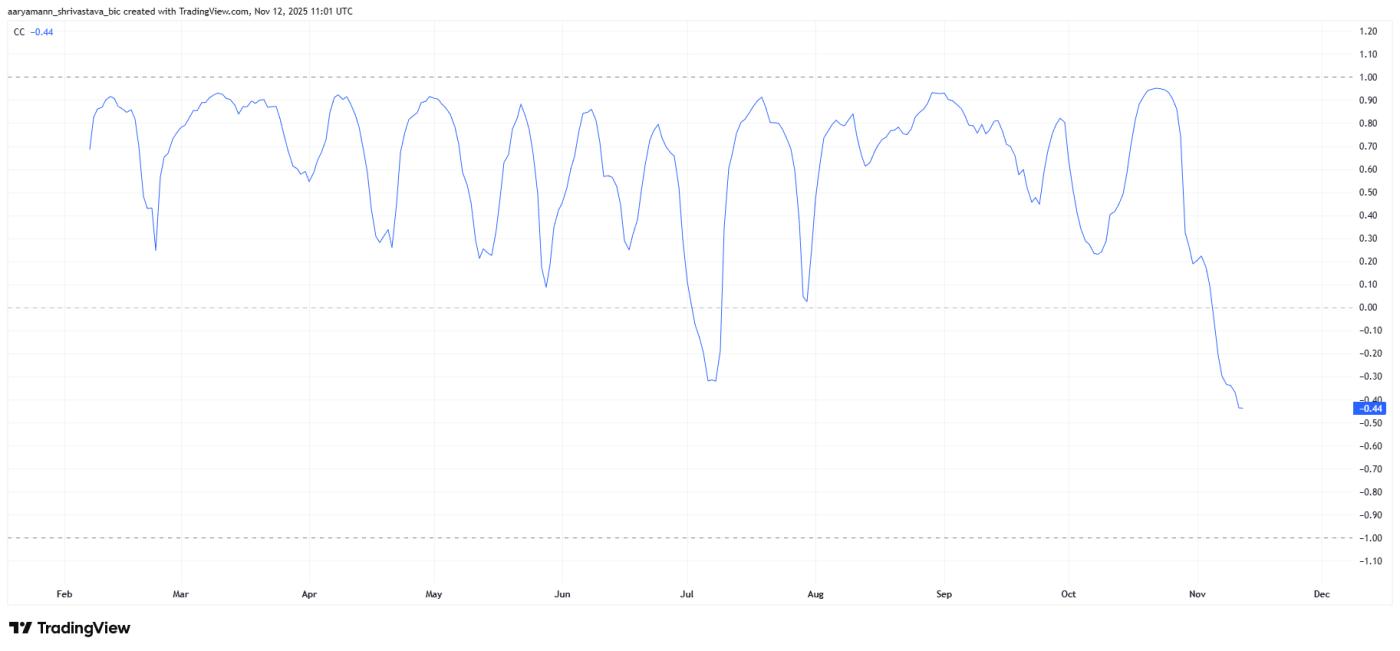 TRUMP Correlation with Bitcoin. Source: TradingView
If Bitcoin maintains its upward momentum in the final months of 2025, TRUMP could face downward pressure. While this separation may have protected it during Bitcoin's previous declines, the same independence could leave the meme currency vulnerable to a broader market rally without its participation.
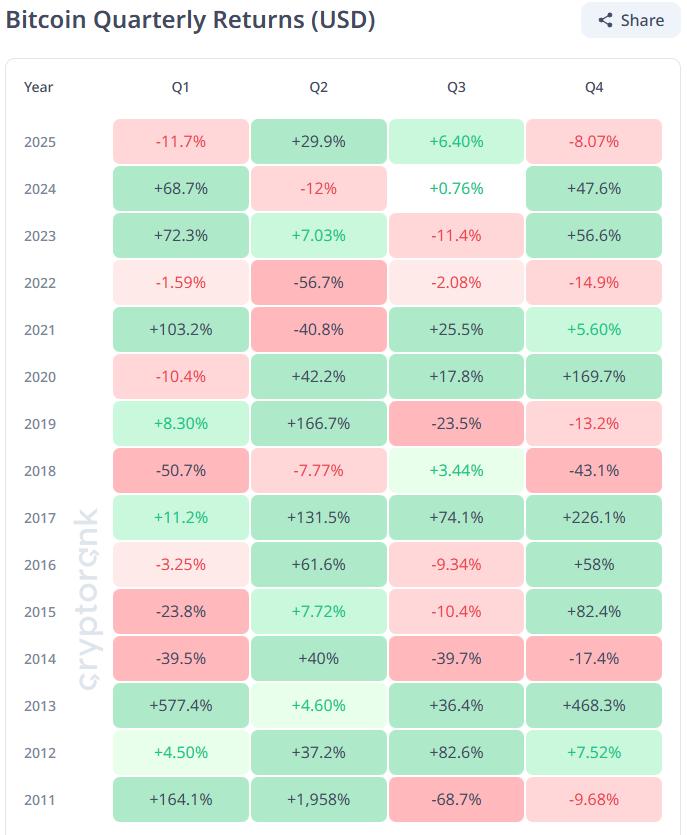 Bitcoin's quarterly performance. Source: CryptoRank
The Future of TRUMP
The funding rate paints a worrying picture for TRUMP’s macro outlook . Short positions have dominated the market for longer than long contracts, reflecting growing skepticism among traders. This imbalance signals declining investor confidence and a lack of a clear directional pattern, both necessary for a recovery.
Without renewed commitment from long-term holders, any sustained recovery is fragile. The lack of positive funding momentum underscores trader caution and the risk that additional liquidation could exacerbate downside volatility in the coming weeks.
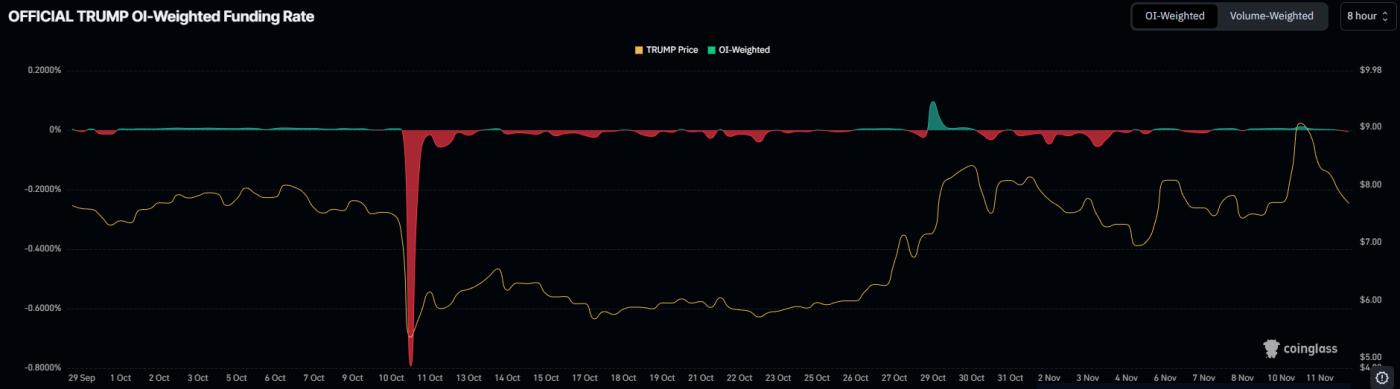 TRUMP's funding rate. Source: Coinglass
TRUMP holders can reverse the results
Despite the macro weakness, the Chaikin Money Flow (CMF) indicator offers some hope. Currently hovering near -10.0, the indicator has previously signaled a rally for TRUMP . This level typically marks consolidation zones where buyers step in temporarily before a broader correction continues.
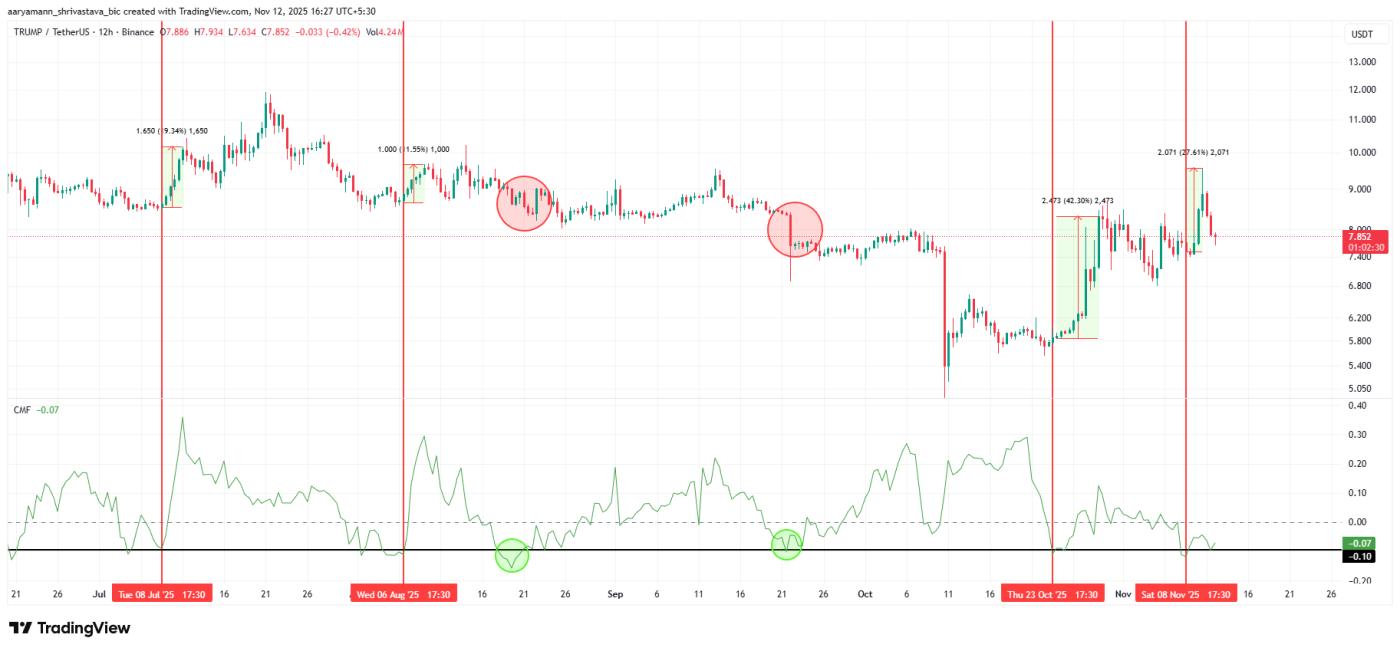 TRUMP CMF. Source: TradingView
With a rising wedge forming on the charts, TRUMP could see a short-term rally before facing fresh selling pressure. This pattern suggests a short-term recovery but the overall bearish structure remains dominant as 2025 comes to a close.
TRUMP price may face a decline
OFFICIAL TRUMP has been trading in a rising wedge for the past two and a half weeks, at $7.86. This chart formation is typically a bearish signal, often foreshadowing moves down.
If the TRUMP price faces any bearish signals, either from investors or from the factors mentioned, it will break below the level. Weak buying could extend the decline, pushing it down another 19% to the support level of $6.24.
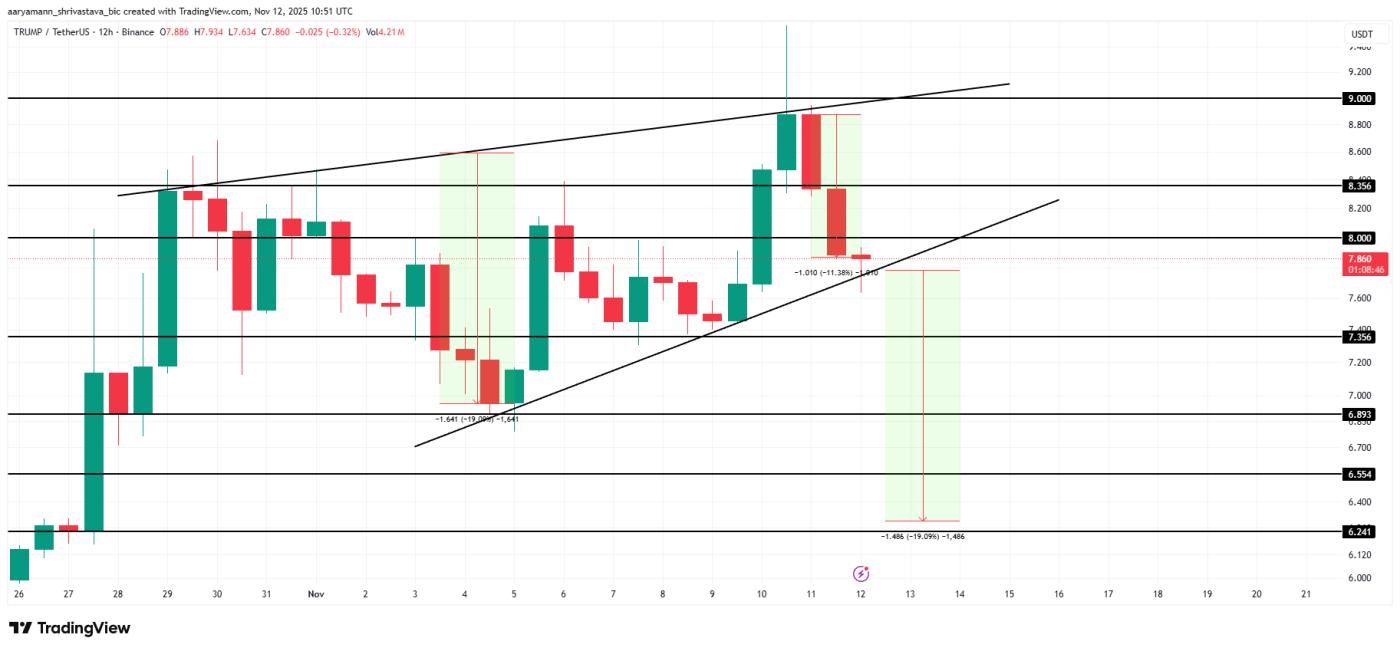 TRUMP Price Analysis. Source: TradingView
On the other hand, if the CMF pattern holds, TRUMP could bounce from the lower trendline and break above $8.36 to test $9.00. While such a move would invalidate the short-term bearish outlook, the overall downtrend remains intact.