Pi Coin just printed something unusual. Three major timeframes are green at the same time. The one-month chart is up 9.5%, the seven-day chart is up 2.1%, and the last 24 hours are up 3.5%.
This is rare because the Pi Coin price is still down almost 40% in the three-month window. The token is showing early strength while most of the market is still stuck in a slow bleed. The question now is simple: is this just a brief bounce, or the start of a larger move?
Symmetrical Triangle Breakout Surfaces As Money Flow Turns Positive
PI has been stuck inside a symmetrical triangle for weeks. This pattern typically indicates indecision, rather than a trend direction.
However, yesterday, the Pi Coin price broke through the upper boundary and is now testing the confirmation level near $0.229, a key level. A clean candle close above that line is the first sign that buyers are finally taking control.
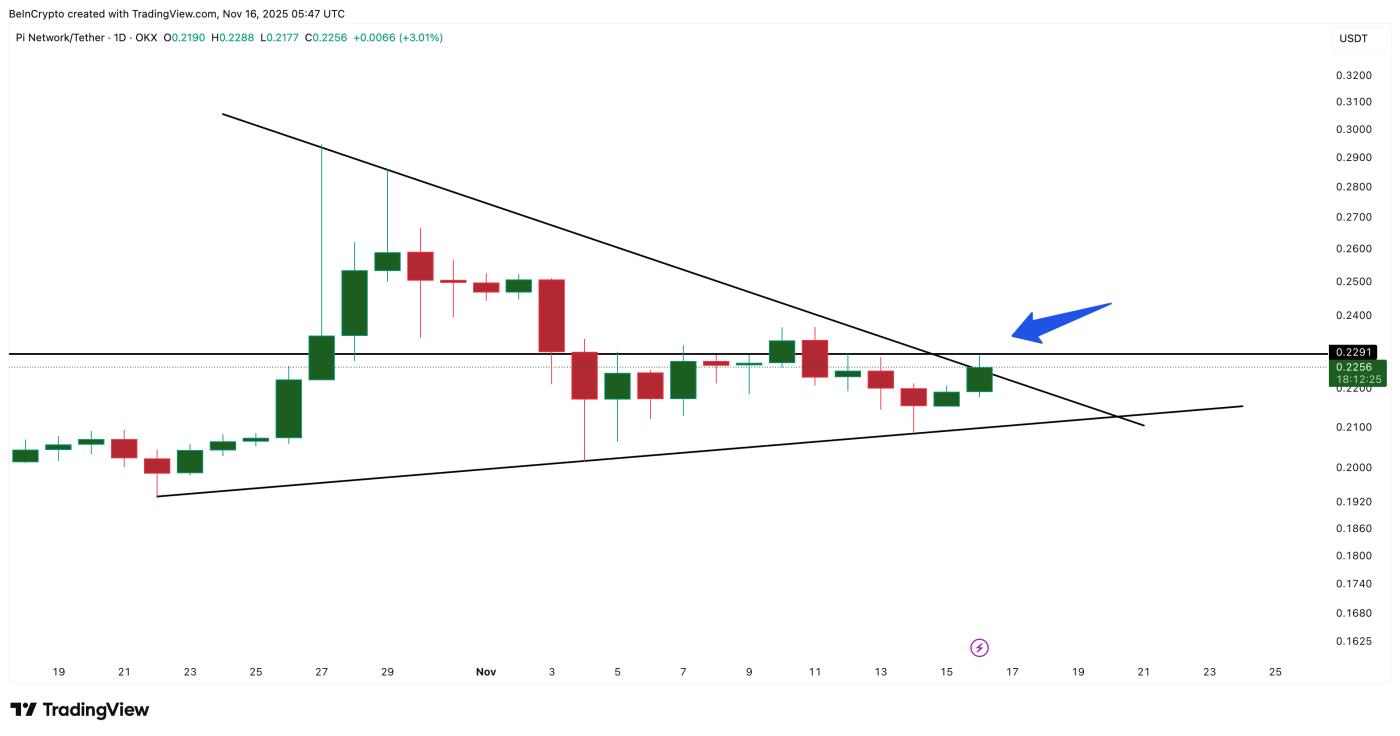 Pi Coin Breaks Out: TradingView
Want more token insights like this? Sign up for Editor Harsh Notariya’s Daily Crypto Newsletter here.
The next clue comes from the Chaikin Money Flow (CMF). CMF measures whether money is moving into or out of an asset. Two days ago, CMF broke out of its descending trend line, rising sharply from –0.09 to +0.05.
This jump shows that the breakout is not random. Bigger Pi Coin wallets may be stepping in as the pattern flips bullish.
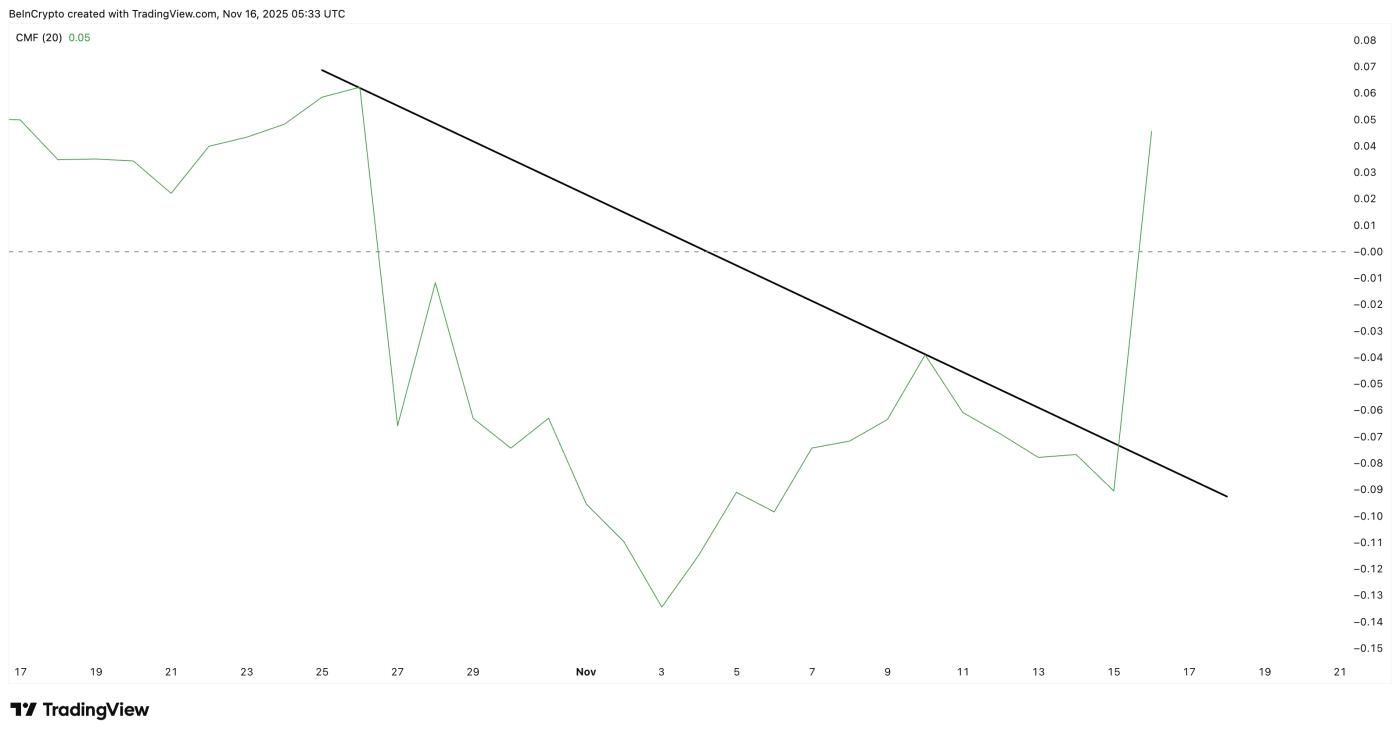 Big Money Flows In: TradingView
The On-Balance Volume (OBV) tells the other half of the story. OBV tracks buying and selling volume to show whether traders support the move. OBV touched lower, back to its rising trend line on November 12–13, hinting that retail volume wasn’t ready.
However, since November 14, OBV has begun to curl upward again. If OBV breaks its upper trend line, it confirms that retail Pi Coin buyers are now joining the move sparked by the CMF breakout.
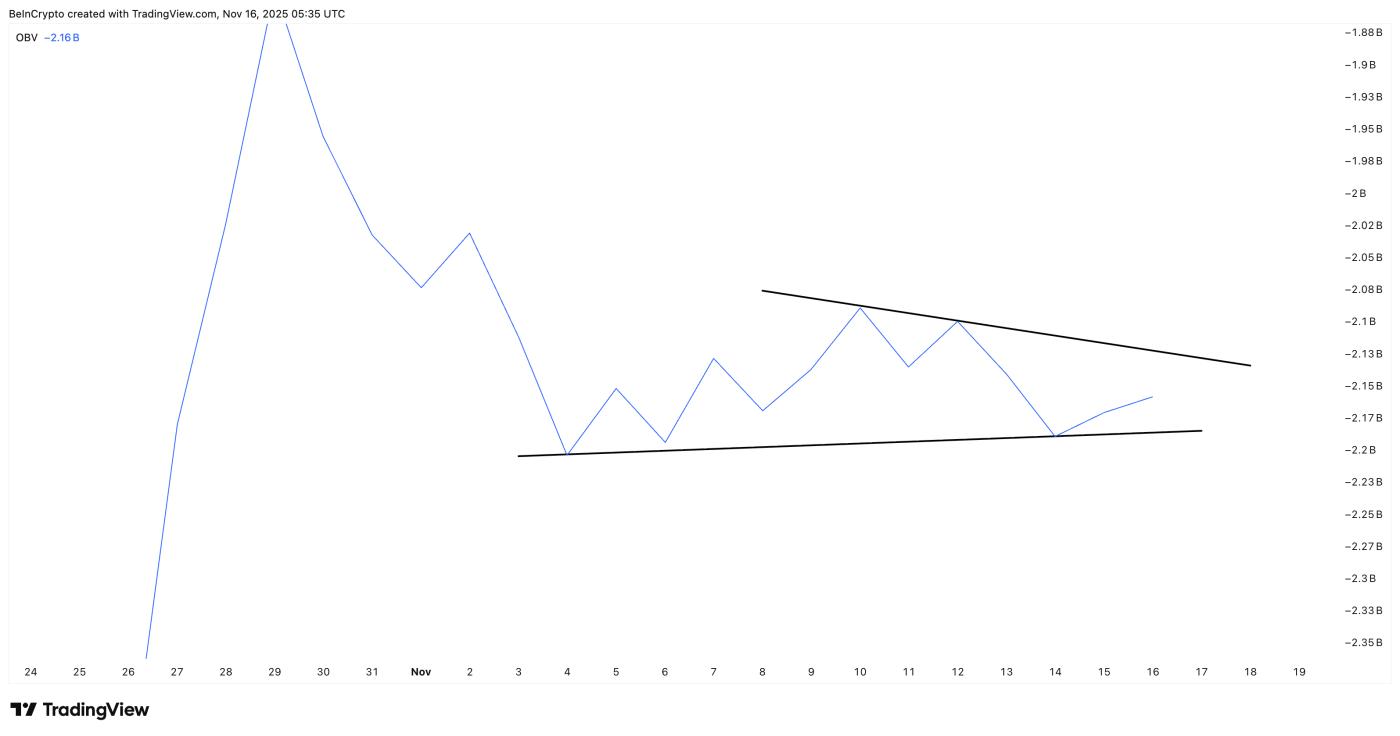 Retail Volume Coming Back: TradingView
The combination of a technical breakout, rising money flow, and recovering OBV gives Pi Coin its strongest setup in weeks.
Pi Coin Price Levels To Watch As Momentum Builds
If the Pi Coin price closes above $0.229, the move could extend to $0.236, representing a gain of approximately 4.2% from current levels. If momentum holds, the next target is near $0.252, which has previously acted as strong resistance.
However, the bullish setup can fail if the OBV rolls over again or the CMF slips back into negative territory. A drop below $0.215 weakens the structure and exposes a slide toward $0.208.
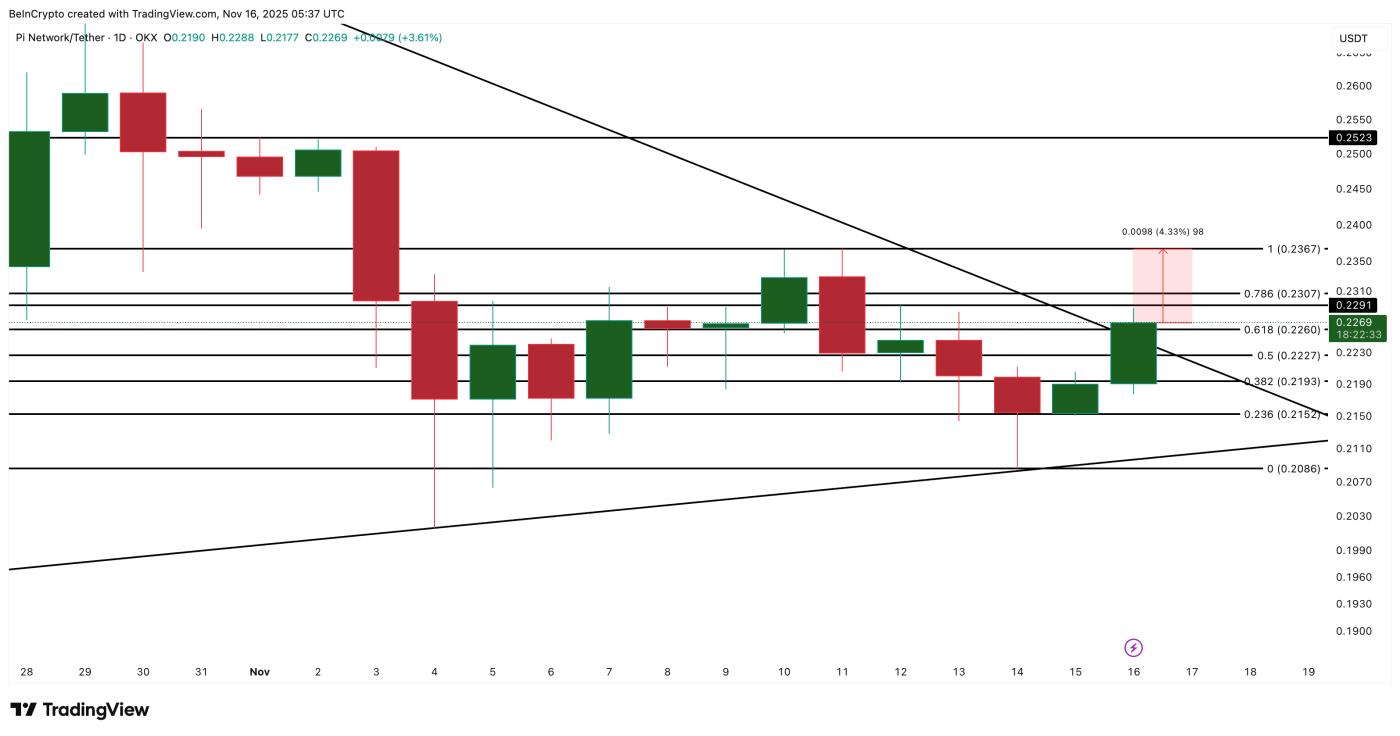 Pi Coin Price Analysis: TradingView
Currently, the Pi Coin price is exhibiting rare strength across multiple timeframes. Whether that strength lasts comes down to one line: $0.229. If the bulls defend it, PI’s green streak may have more room to run.