

XRP climbed back over $2 after a run of selling the past week, and the latest Bollinger Bands setup now points to the strongest upward scenario on the TradingView chart. The Bands use a 20-period average with two curves around it that expand and contract with volatility, giving the market a clear view of where the next move can go.
On the daily chart, XRP trades around $2.04, which puts it back above the middle band at $2.02. This matters because the price recently stayed close to the lower band near $1.92, a level that usually signals heavy pressure. Moving back above the middle band often marks a change in behavior, showing that buyers have stepped in and sellers are losing control.
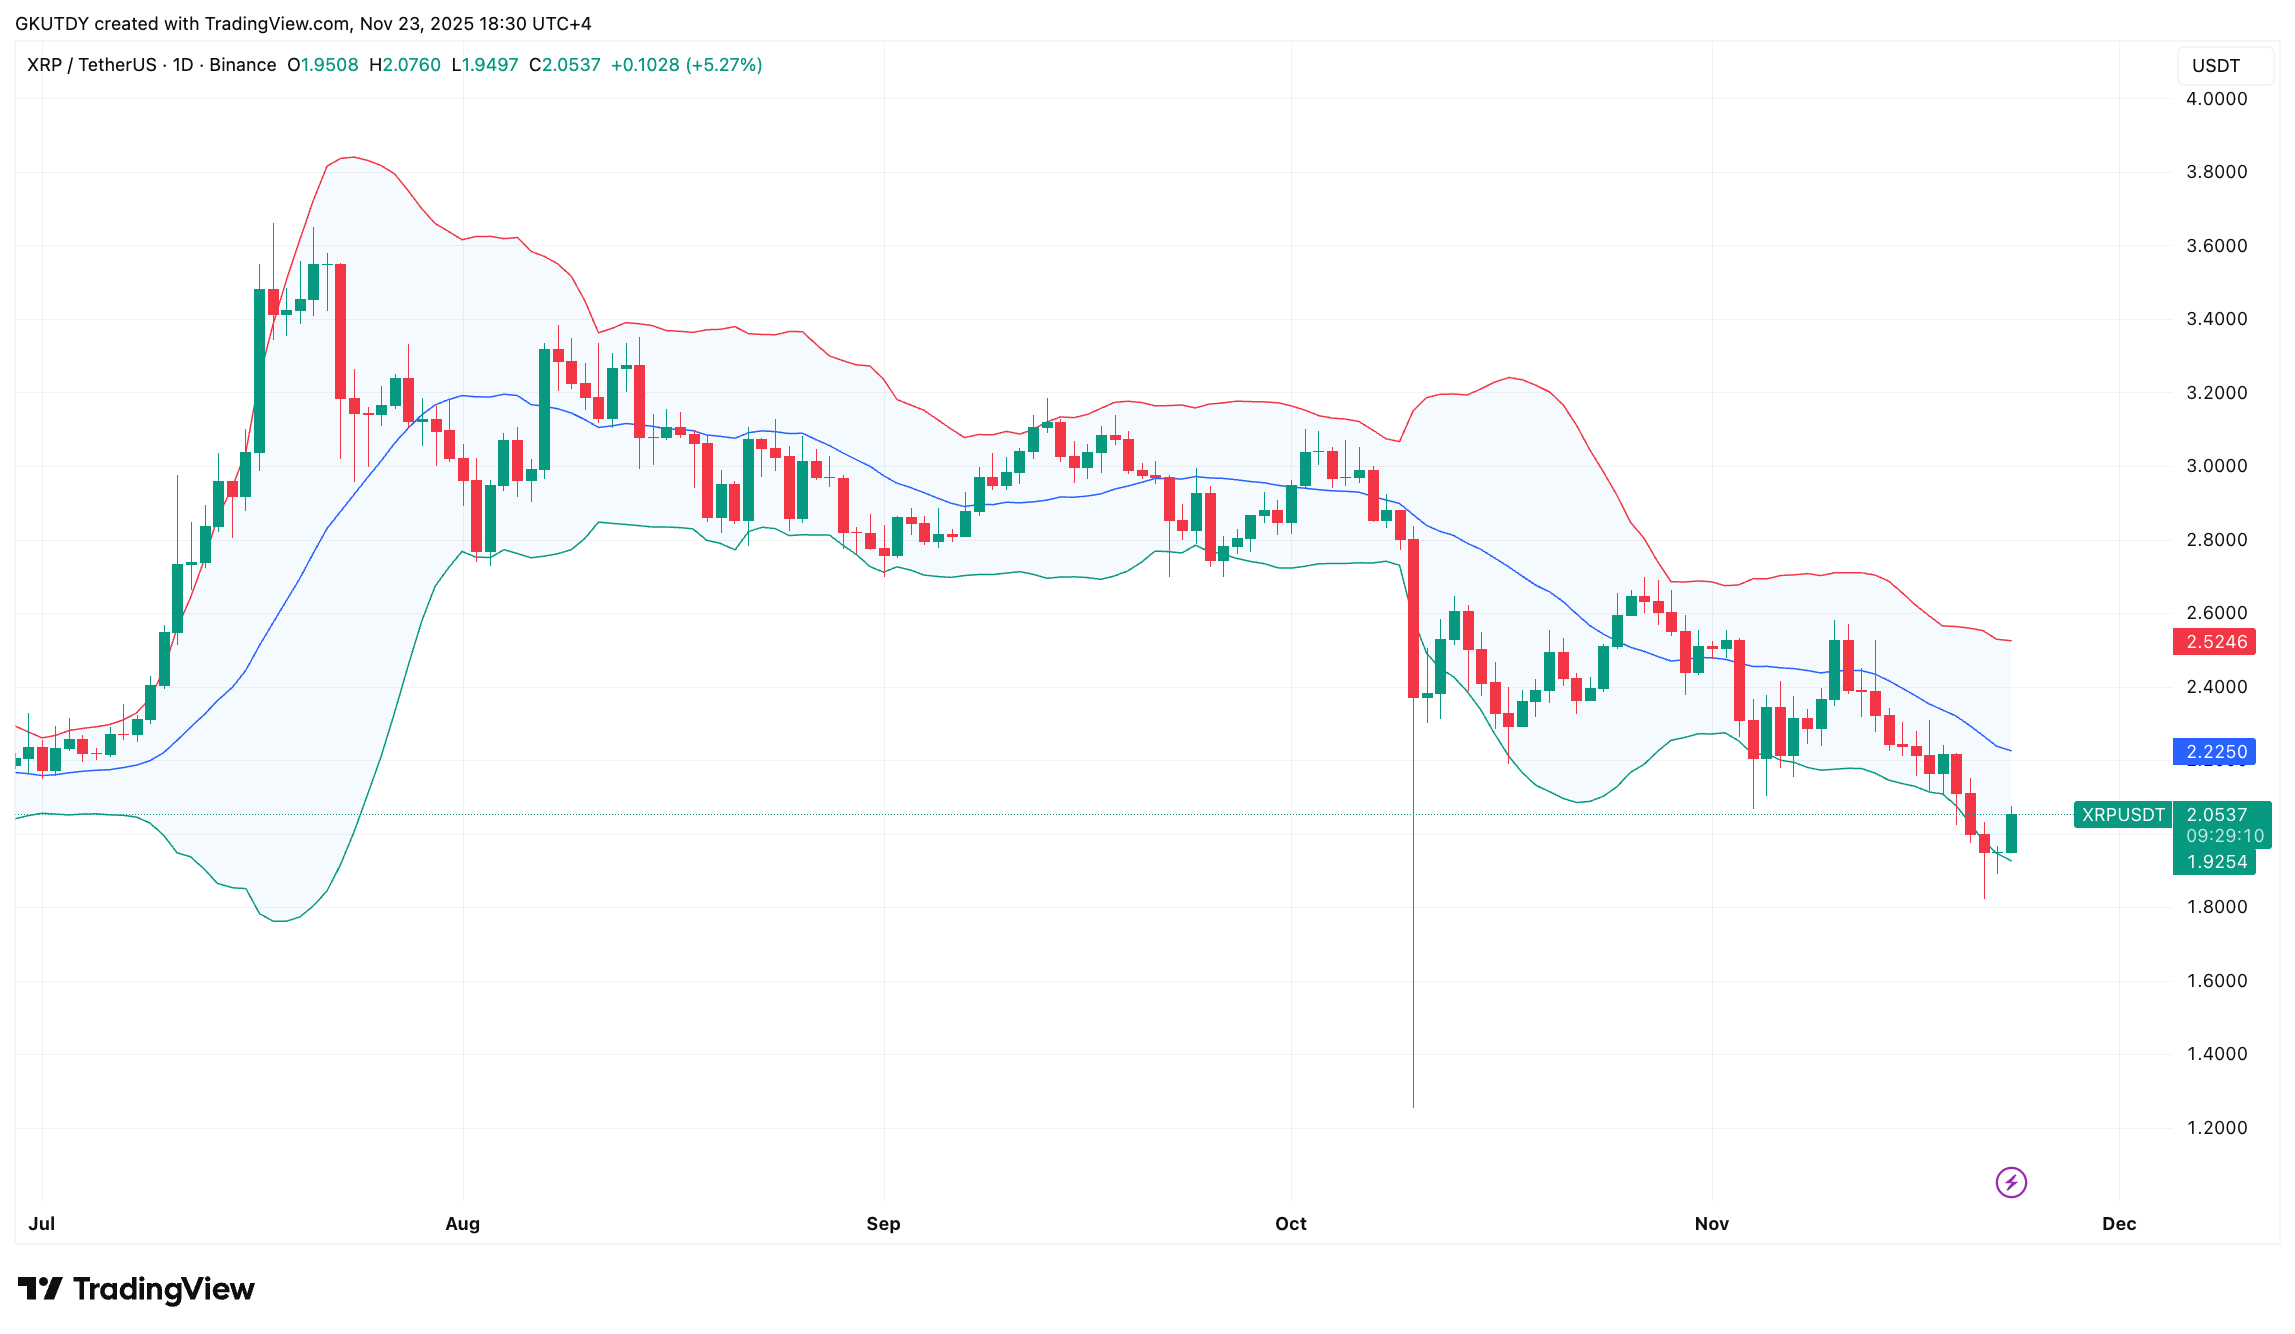
The next important level above is the upper band around $2.52, a zone XRP struggled to break earlier this season.
The weekly chart supports this view. XRP sits just under the weekly mid-band near $2.22, but the lower band at around $1.80 held on the first drop. This means the decline did not break the trend. Instead, the price stayed inside a wide range that has guided XRP for almost a year, which keeps the structure constructive.
Best price scenario for XRP
The strongest signal comes from the monthly time frame. XRP remains well above the monthly mid-band at $1.74, which decides the long-term direction. Staying above it keeps the trend in good condition even when short-term swings look heavy.
From this setup, the best scenario is simple: if XRP continues to hold above the monthly mid-band, the path toward the upper monthly band at $3.61 stays open, signaling room for a full recovery and a possible new all-time high.


