Black Friday falls on November 29th and many major altcoins are trading at deep discounts. Not only are these altcoins cheaper, but they also have the potential to recover if market conditions improve. Or even worsen!
Some altcoins have a viable path back to previous highs, some are showing signs of a deep reversal, and others are in a strong cyclical narrative with a large long-term discount. All three offer different types of discount stories.
BNB price drops sharplyBNB is one of the few large - cap Token that has maintained a strong long-term performance. While Bitcoin is down about 6% year-to-date and Ethereum is down nearly 15%, BNB is still up about 35%. This makes the current drop more meaningful during Black Friday than just a sign of weakness.
What is the current price drop? BNB is 37.1% below its All-Time-High , which was set about a month ago. This makes the price drop all the more notable.
BNB is also closely linked to the general market. Its 0.95 one-month correlation with Bitcoin shows that it moves almost in sync with BTC. So if the market turns, BNB price tends to react quickly.
Want to know more about Token like this? Subscribe to Editor Harsh Notariya's daily Crypto newsletter here .
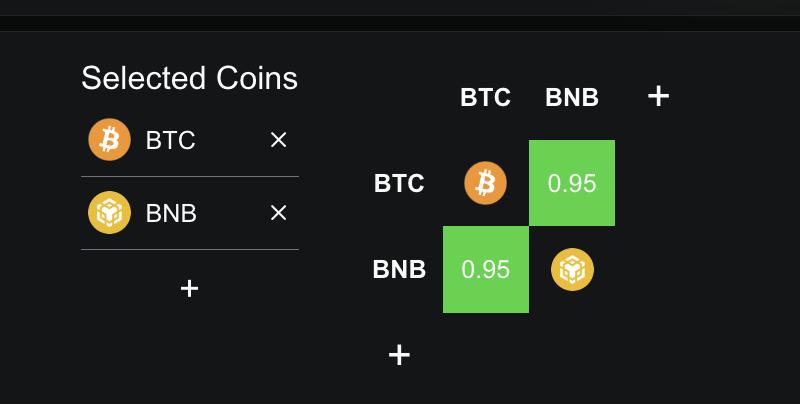 BNB- BTC Correlation : defillama
On the chart, BNB shows a clear continuation structure.
Between June 21 and November 21, the price made a higher Dip , while the Relative Strength Index (RSI) made a lower Dip . RSI measures momentum, and this pattern—price rising while RSI falls—suggests that selling pressure is waning. A similar structure appeared previously between June 22 and November 4, but the move stalled at the same resistance level BNB faces today. That resistance is $1,016.
BNB needs a clean daily close above this level to confirm momentum. If it breaks:
- Next target is $1,183
- Above that is $1,375, which is very close to the All-Time-High and could be reached if market sentiment changes.
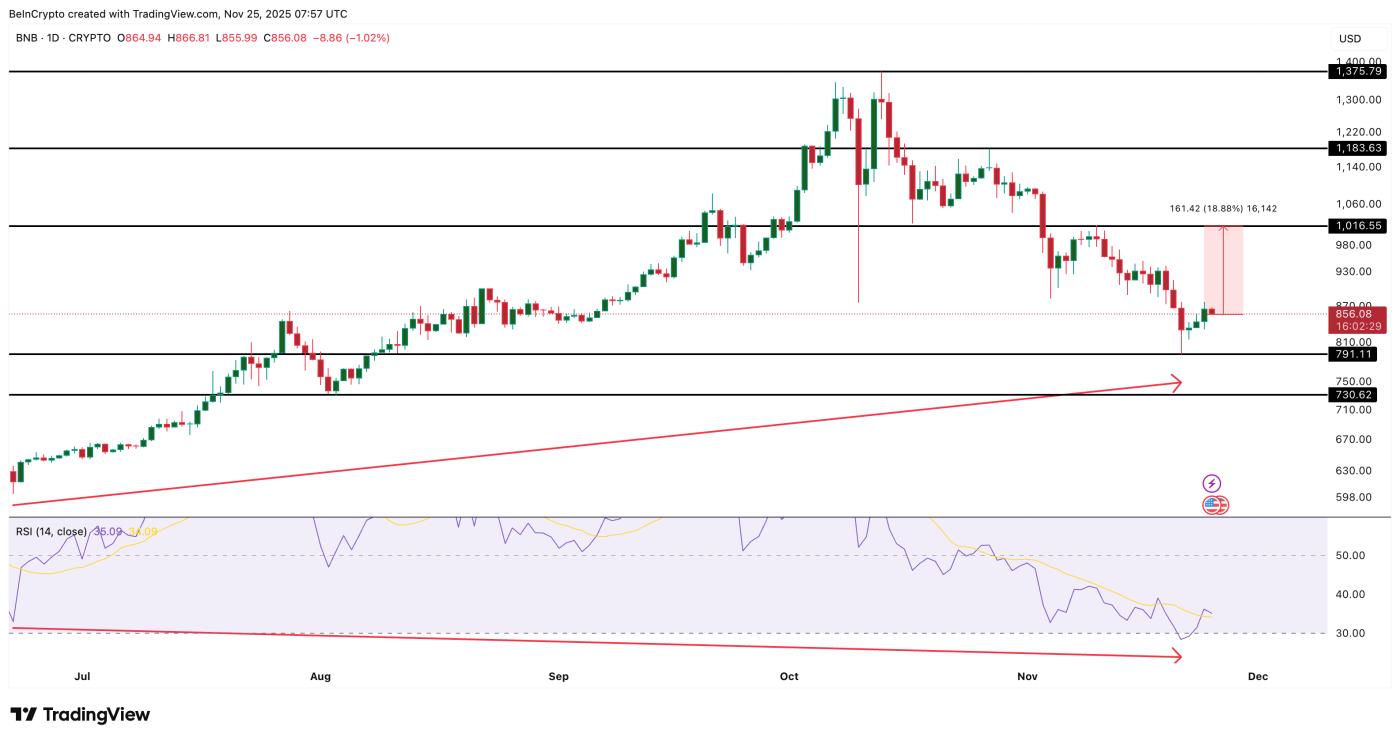 BNB Price Analysis : TradingView
On the downside, a loss of $791 would open the door to a drop to $730, but the broader uptrend remains intact.
BNB deserves to be on the Black Friday discount list because:
- Current discounts are not structural
- RSI divergence suggests that the correction may be ending
- The road back to highs is not too far if Bitcoin stabilizes
Sei is also on the list of altcoins that are on the Black Friday bandwagon because of the deep, fresh drop and the support of a clear reversal setup. And the DeFi story could also be a strong driver.
Sei ’s decline is one of the steepest on this list. Sei is down 54% in the past three months and 88% from its All-Time-High, set in March 2024. This makes the decline meaningful: the peak wasn’t five or six years ago, so a retest of higher territory isn’t unrealistic if conditions improve.
Perp traders are also becoming more active. The top 100 addresses have increased their long positions by 721%, showing renewed interest.
Smart Money still has a negative net position (short), but even here the position has improved by 58.02%, suggesting that the most efficient traders are gradually reducing their bearish bets.
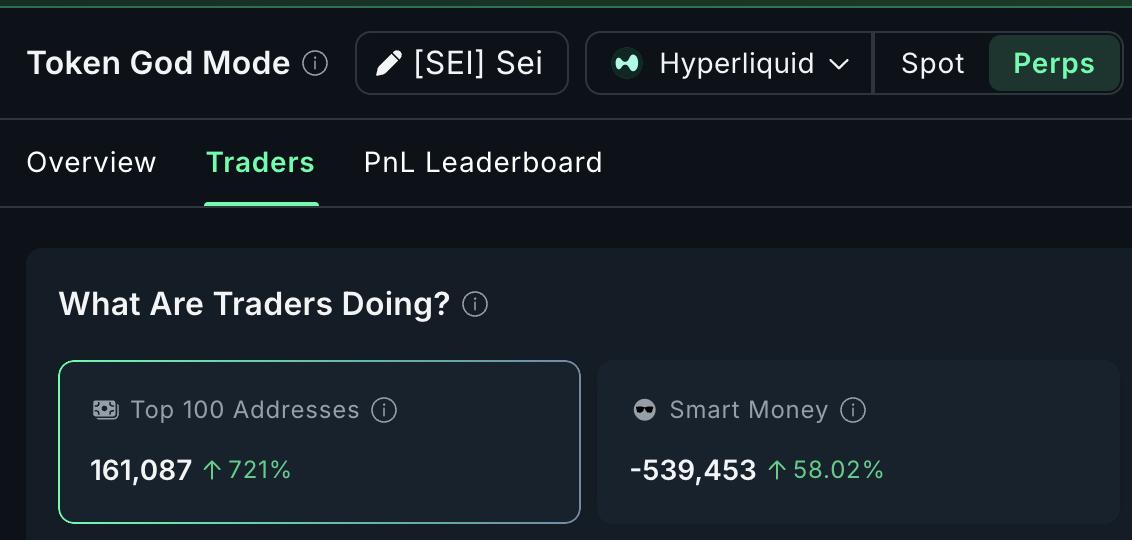 Upside setup: Nansen
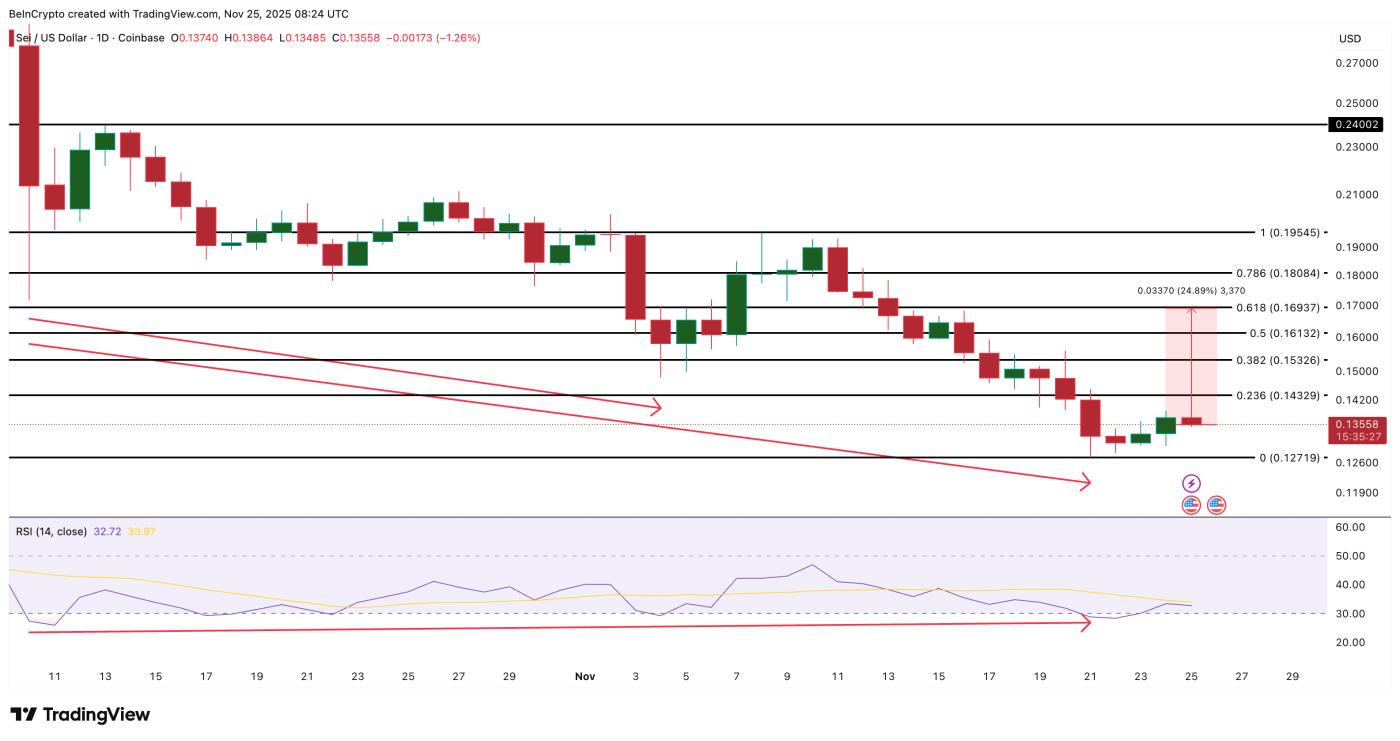
The chart sent the clearest signal. Between October 10 and November 21, the price made a lower Dip , while the Relative Strength Index (RSI) made a higher Dip . This is a classic bullish divergence and a possible reversal sign.
A similar structure formed between 10/10 and 04/11, when Sei bounced strongly before being rejected at major resistance.
That creates the next set of levels. Sei needs to break $0.169 to confirm a real reversal. If it breaks, the path opens up towards $0.195 (the previous rejection level), and above that, a heavier resistance at $0.240.
 Sei Price Analysis : TradingView
The downside is clear. Losing $0.127 would weaken the reversal and create a clearer breakout possibility, especially as the overall market conditions remain weak.
Sei is on the Black Friday list for the following reasons:
- Discounted significantly and close enough to make sense
- Clear RSI reversal setup in action
- Market optimism is starting to support that the decline may be over.
Dash (DASH)
Dash fits into a very different part of the altcoin Black Friday sale theme as it belongs to the Security Token story, being one of the few segments that has outperformed in this volatile cycle. Its one-year correlation with Bitcoin is -0.06, which means it can move in the opposite direction when the overall market falls.
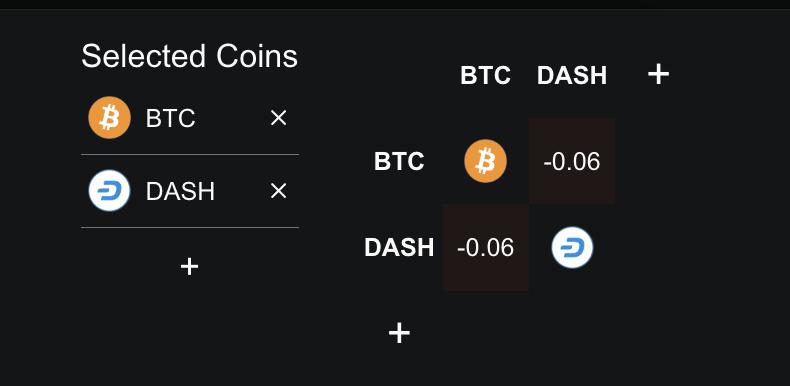 DASH- BTC Correlation : defillama
The long-term bearishness here is huge. DASH is still down over 96% from All-Time-High. The recent short-term correction adds another layer of bearishness.
DASH is down 26% in the past seven days, so buyers still have an opportunity to buy at a discount even after the strong rally earlier this quarter.
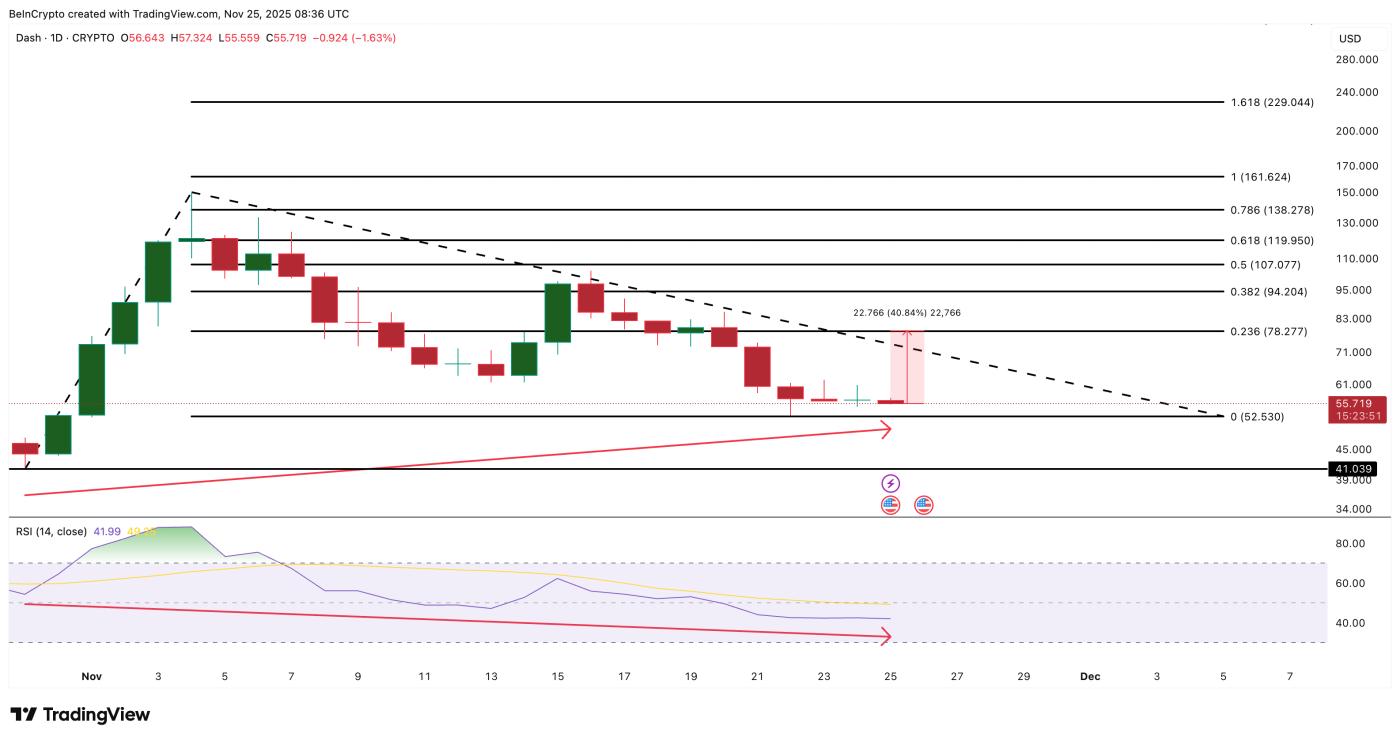
The chart now shows that this correction may be fading. From October 30, 2023 to November 25, 2023, the price made a higher Dip while the Relative Strength Index (RSI) made a lower Dip . This is a continuation setup (bullish hidden divergence), and it often appears when a broader uptrend pauses before resuming.
For Dash, trend-based Fibonacci extension levels help draw the line ahead. The first hurdle is at $78. A clear break above this level opens the way to $107 and higher. These targets are fully achievable if the cyclical narrative remains strong.
 DASH Price Analysis: TradingView
A drop below $52 breaks the continuation structure and puts $41 back on the chart, which was the level that Vai as the Dip during the strong rally in early November.
Here's why this discount story works: