

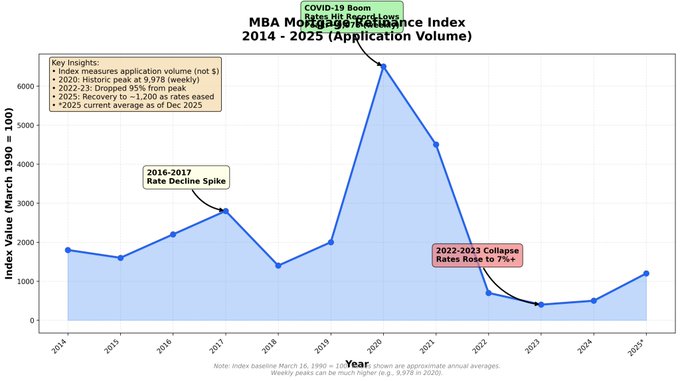
Interesting chart I had Claude draw up of historic US home refinance applications... Shows the spike in 2016-2017 (right before crypto bull market) and 2020-2021 (right before crypto bull market)... Is quite striking if you compare it to the $BTC chart... Granted its a
From Twitter
Disclaimer: The content above is only the author's opinion which does not represent any position of Followin, and is not intended as, and shall not be understood or construed as, investment advice from Followin.
Like
Add to Favorites
Comments
Share


