

Bitcoin continues to trade near $92,000 after this week's recovery, however, a growing cluster of on chain indicators is suggesting the market has entered a bear cycle.
This is in stark contrast to recent predictions from market leaders like Tom Lee and Arthur Hayes, who have suggested that Bitcoin could still end the year significantly higher.
Growth predictions versus data
Lee recently slightly lowered his previous target of $250,000 and now expects Bitcoin to remain above $100,000 by year-end.
Meanwhile, Arthur Hayes takes a much more positive stance, calling the recent drop below $80,000 a cycle Dip and predicting a possible move towards $200,000–$250,000 for Bitcoin.
However, the current market structure does not fit any scenario.
CryptoQuant's composite Bull Score signals show why. In previous bull runs, including late 2023 and early 2025, the model showed broadly green conditions in terms of valuation, demand growth, network activity, and stablecoin liquidation .
Since mid-2025, these components have been consistently in the red. The MVRV Z-score has moved into the overheated zone, network activity has weakened, and stablecoin purchasing power has decreased.
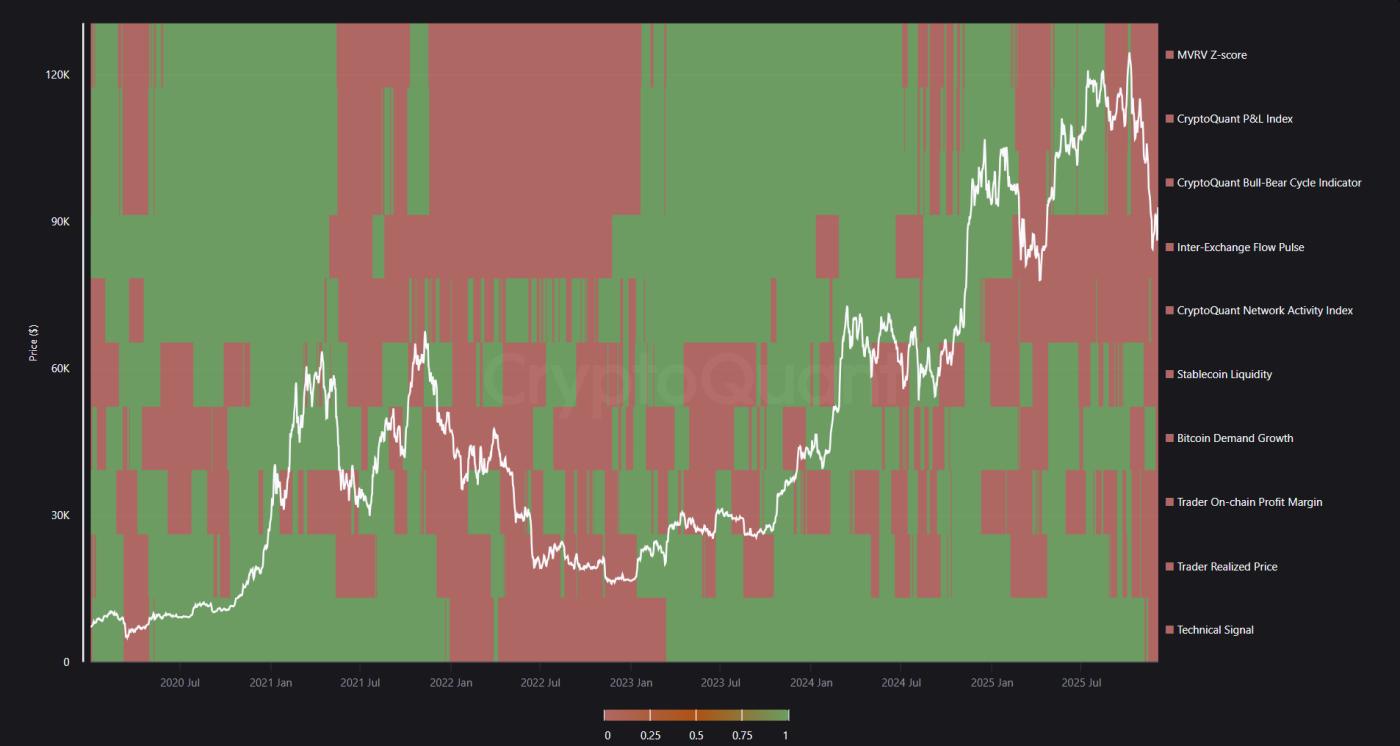 Bitcoin Bull Score Signal. Source: CryptoQuant
This pattern is more like the early stages of a recession in 2022 than a continued rally in 2025.
The Bull Score also provides a more detailed view. Bitcoin has been in bullish territory with a reading above 60 in the first half of 2025.
By late August, the index began to decline sharply, below 40 in October and remaining flat throughout November despite short-term price fluctuations.
The latest reading is in the 20–30 range, deep into bear territory . The rebound from last week's Dip has done little to change the underlying cyclical signals.
 Bitcoin Bull Score
Another indicator, the Bull Score, which is mapped to price, reinforces this view. The model has flipped from a green “strong bull” signal earlier this year to a red “bear” and “strong bear” signal consistently throughout September, October, and November.
Even the recent rally to $92,000 is classified as a bear rally, reflecting the distribution phases seen at previous cycle tops.
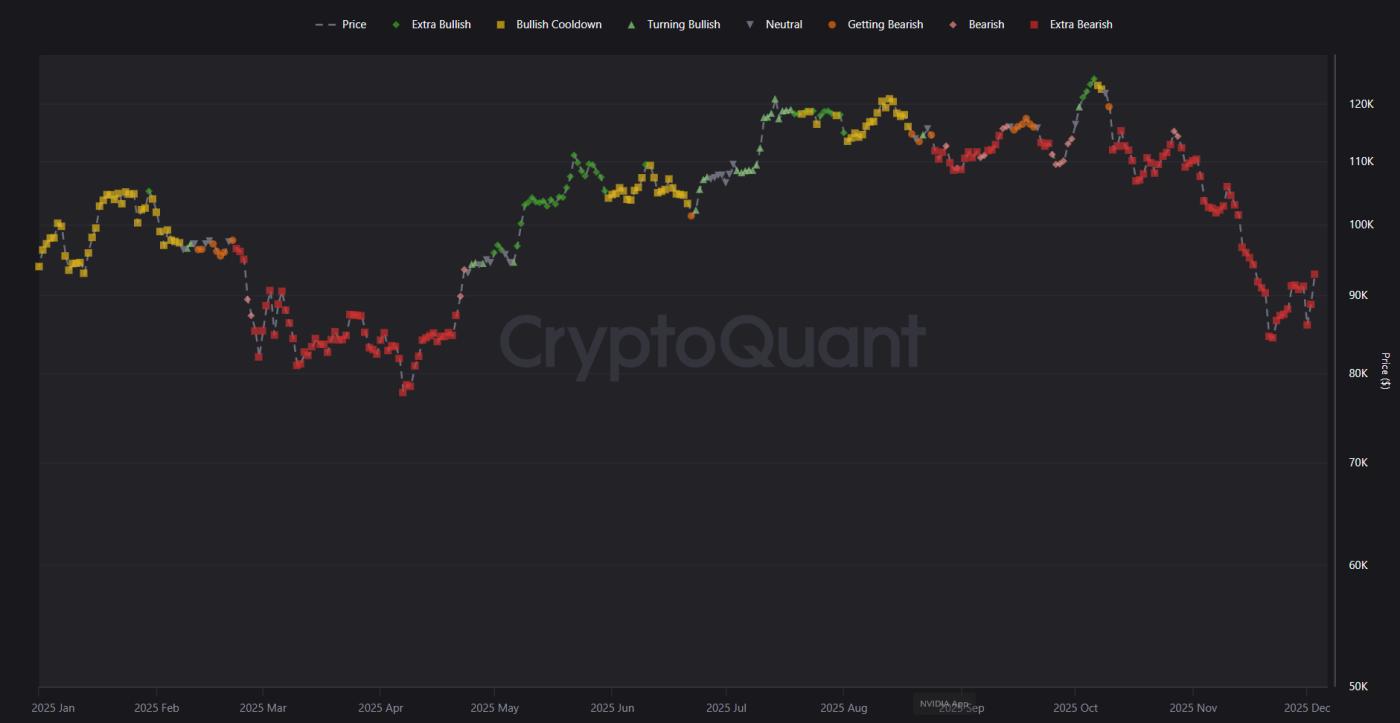 Bitcoin Bull Score – Mapping to Price
Momentum indicators reinforce Bitcoin's bearish case
Market momentum indicators are also depicting a similar cycle shift. RSI remains neutral around 50, indicating a lack of determination in this week's rally.
Chaikin Money Flow remained negative for most of the month, reflecting continued Capital outflows despite price recovery.
Although the MACD has recently turned positive, the histogram shows weakening amplitude. This suggests that the move lacks sustained momentum.
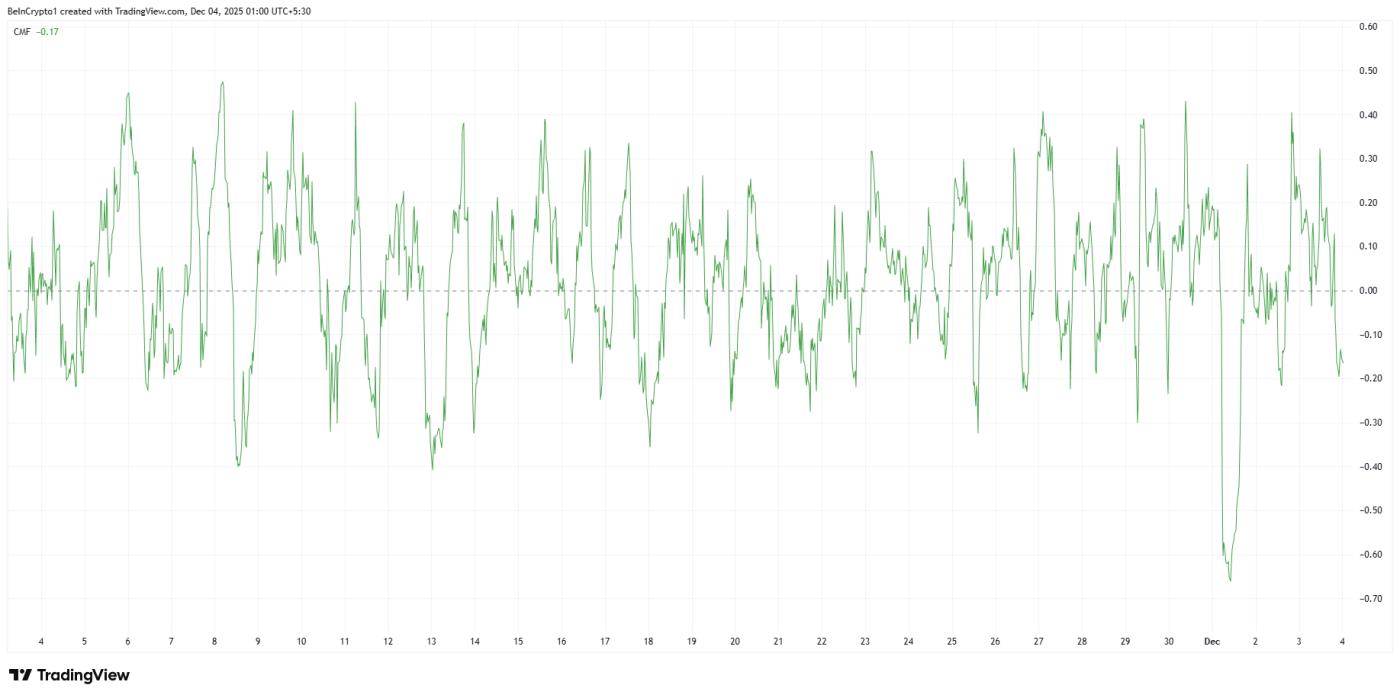
Additional signals add to the caution. The short-term RSI surge above 70 in recent days has failed to sustain, suggesting sellers remain active on each breakout attempt. The CMF’s failure to return to positive territory highlights the current distribution rather than accumulation.
Meanwhile, the weak MACD crossover reflects conditions seen in previous bear market rallies, where momentum improves briefly before reversing.
Taken together, on chain indicators, liquidation and momentum suggest a structural shift into a bear cycle.
Although Tom Lee and Arthur Hayes argue that Bitcoin can regain its original strength, current market data suggests otherwise.
Unless stablecoin liquidation , network activity, and demand growth recover strongly, Bitcoin's recent recovery is likely to be just a temporary retracement rather than the start of a new bull phase.


