

Pi Coin's price remained relatively stable throughout November while most other major Token struggled. However, this week the situation has changed. Over the past seven days, the Token has dropped nearly 10% and more than 4% in the last 24 hours alone. The breakout above a key level on the daily chart has confirmed a negative signal, which many traders consider a "doomsday" sign as it could cause the price to continue plummeting to new Dip if selling pressure persists.
The question now is whether this chart can recover.
Breaking the pattern opens the way to new Dip .
Pi Coin has fallen below its neckline near $0.219, completing a Vai-and- Vai pattern, signaling a potential reversal to a downtrend.
The usual prediction for a downward trend would be based on the head-to-neck distance. Based on this prediction, the price of Pi Coin could fall by another 22.8%, to around $0.169 USD.
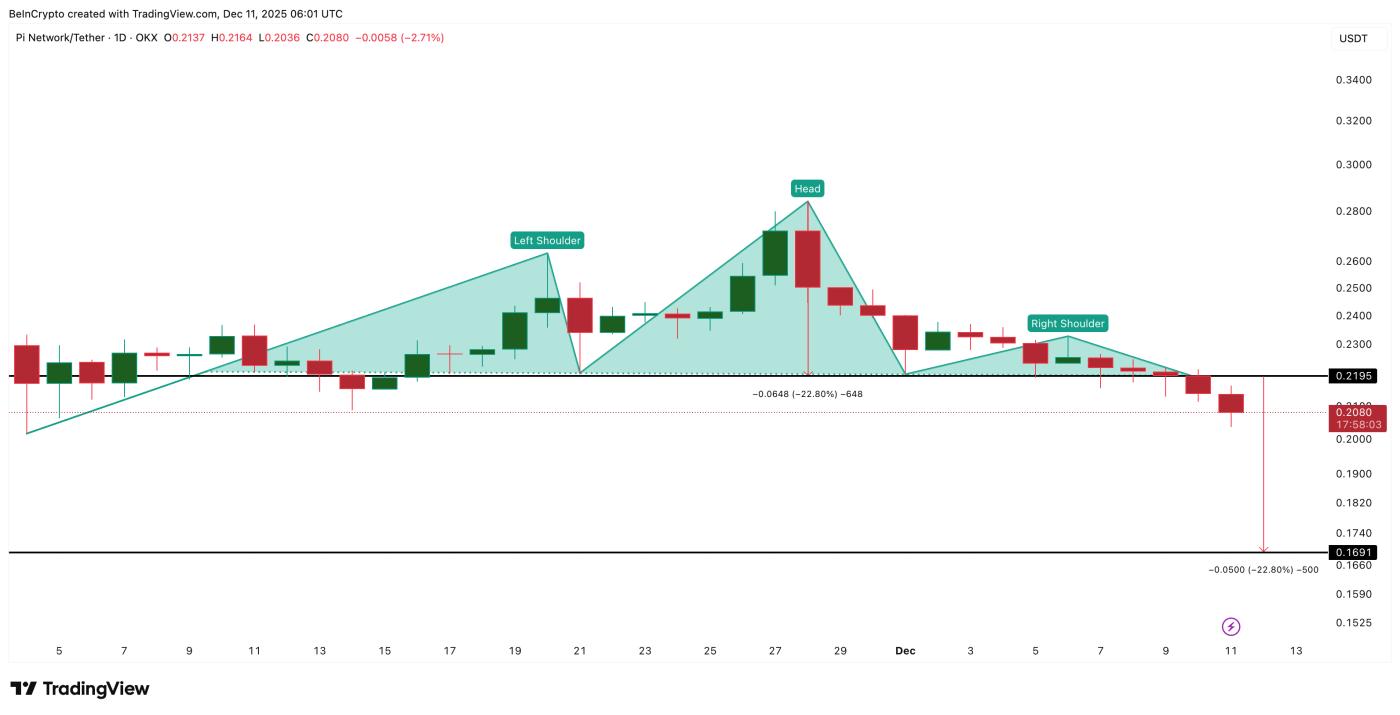 Risk of PI price: TradingView
Want more Token analysis updates? Sign up for Editor Harsh Notariya's daily Crypto newsletter here .
This is noteworthy because Pi Coin's All-Time-Low , according to CoinGecko , is around $0.172, so a drop to the $0.169 region would establish a new Dip . However, two indicators suggest that PI may avoid this risk.
The sellers are in control, but the buyers are still showing signs of activity.
There are still supportive signals from large investors. One sign is the shift in money flow. The Chaikin Money Flow (CMF) indicator, which tracks large amounts of money entering and leaving the market, is showing a slight divergence. From December 9th to 11th, 2023, the price of Pi Coin hit a new Dip , but the CMF indicator rose, suggesting that large buyers were quietly accumulating holdings as the price fell.
The CMF has also broken out of the short-term downtrend but has not yet crossed the zero line, meaning it has not yet entered a state of strong money inflow. To confirm an uptrend, Pi Coin needs the CMF indicator to rise above the zero line.
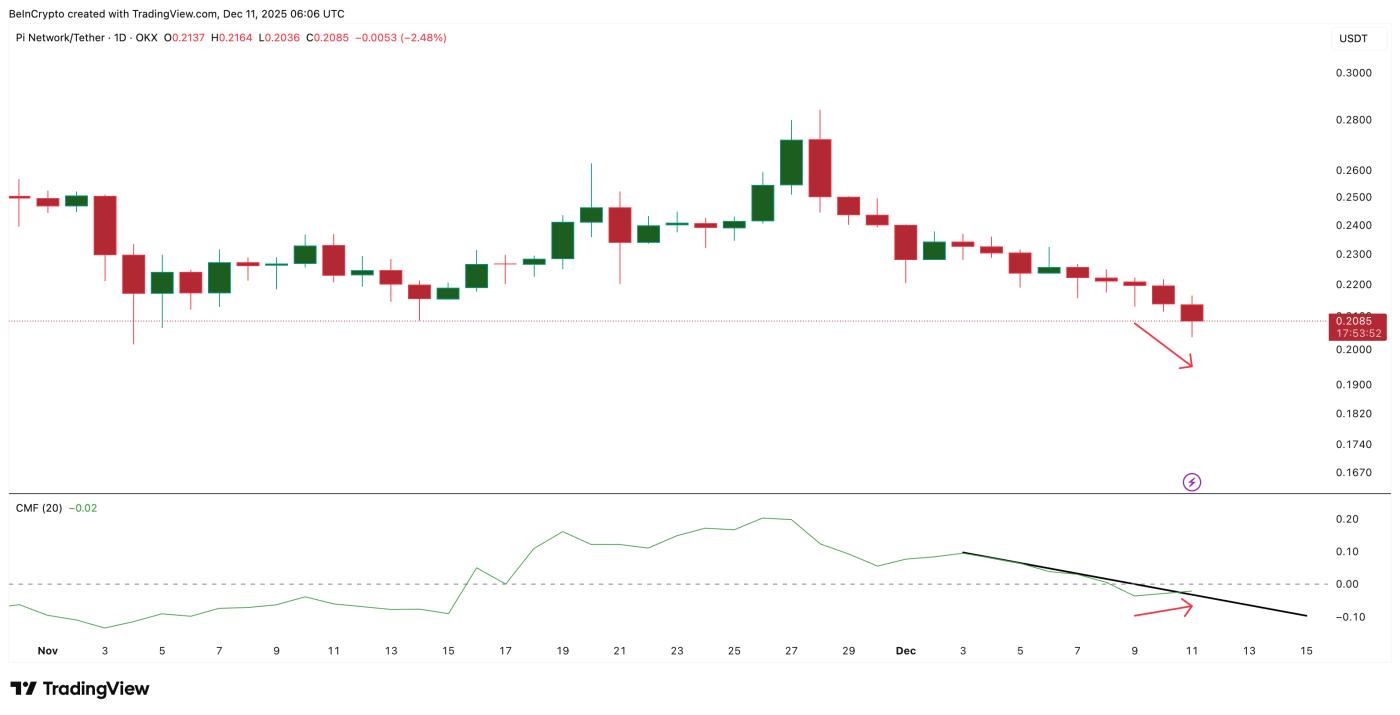 Money may be flowing back in: TradingView
Momentum indicators also showed similar trends. The Relative Strength Index (RSI), which measures buying and selling pressure, formed a separate divergence. From November 4th to December 10th, 2023, the PI price created higher Dip , while the RSI fell to lower Dip — this is a positive sign of hidden divergence. This suggests that selling pressure has begun to weaken.
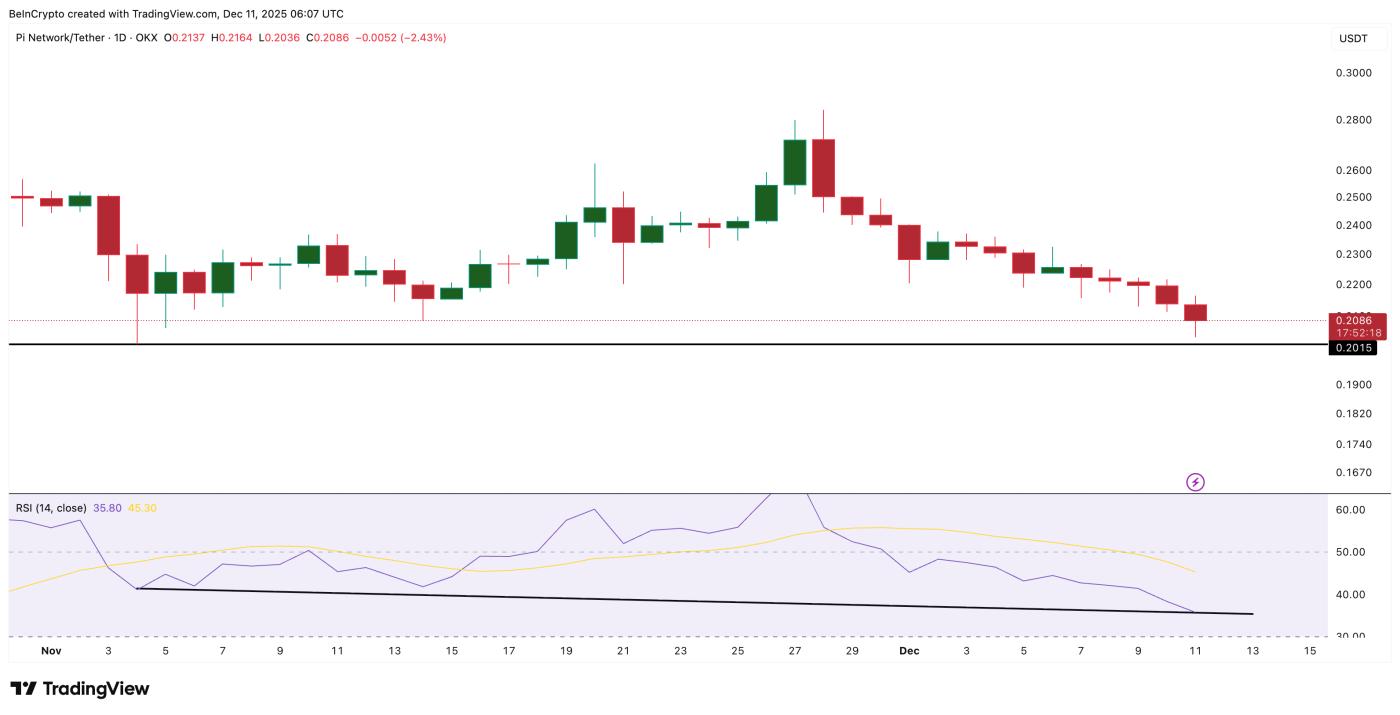 Hidden positive signal emerges: TradingView
These early signs are not yet sufficient to completely reverse the downtrend, but they indicate that sellers have not yet gained full control of the market.
Key price levels for Pi Coin will determine its future.
The price of Pi Coin is currently trading around $0.208 USD at the time of writing. The most important level is $0.192 USD. If this level is breached, the price risks falling to $0.169 USD, as per the pattern and establishing a new Dip on the chart.
To recover, Pi Coin needs to break above the $0.233 mark. This level is on the right Vai of the pattern and is an early sign of improvement. For a complete reversal to a bullish trend, the price needs to break above $0.284 — the top of the pattern.
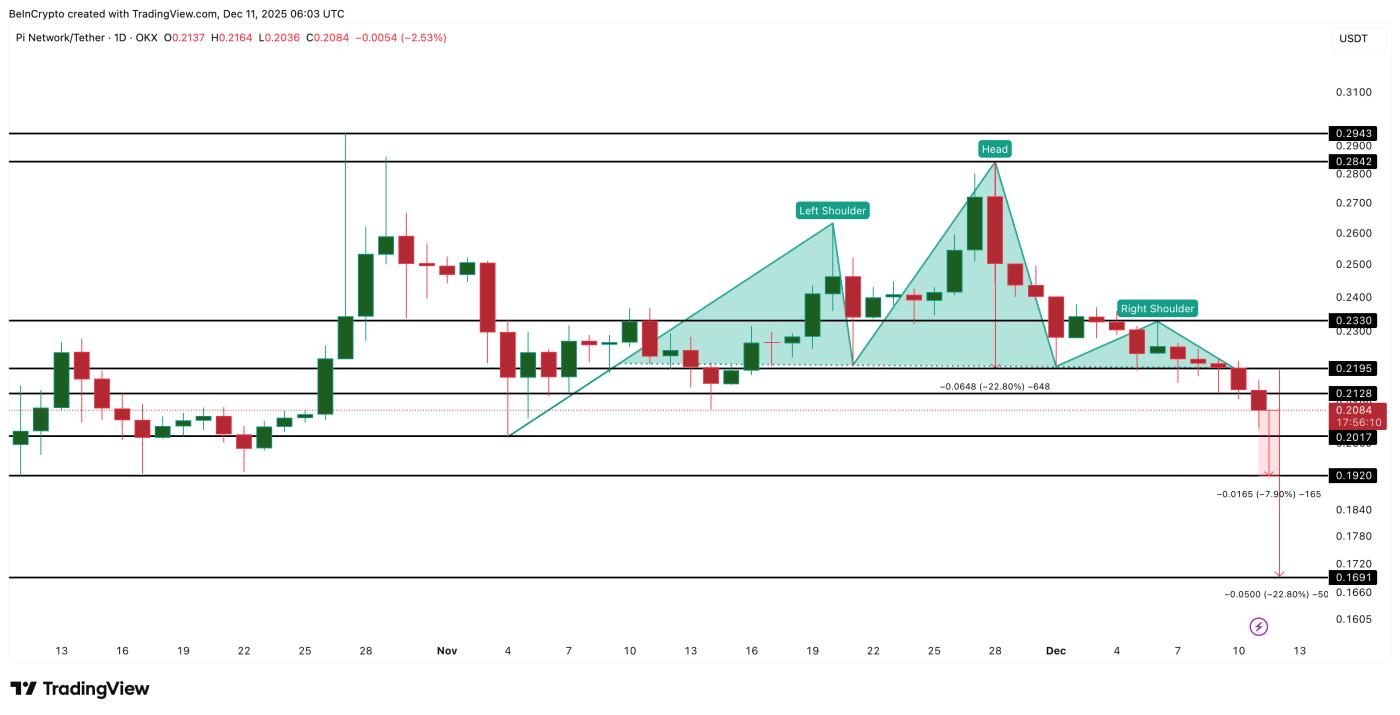 Pi Coin Price Analysis: TradingView
Currently, Pi Coin is caught between selling pressure and a few early signs of support. The recent breakout warns of the risk of a new Dip , but divergence indicators suggest that buyers are still present. The next development depends on whether the price can hold above the $0.192 support level or continue to fall further in a negative trend.


