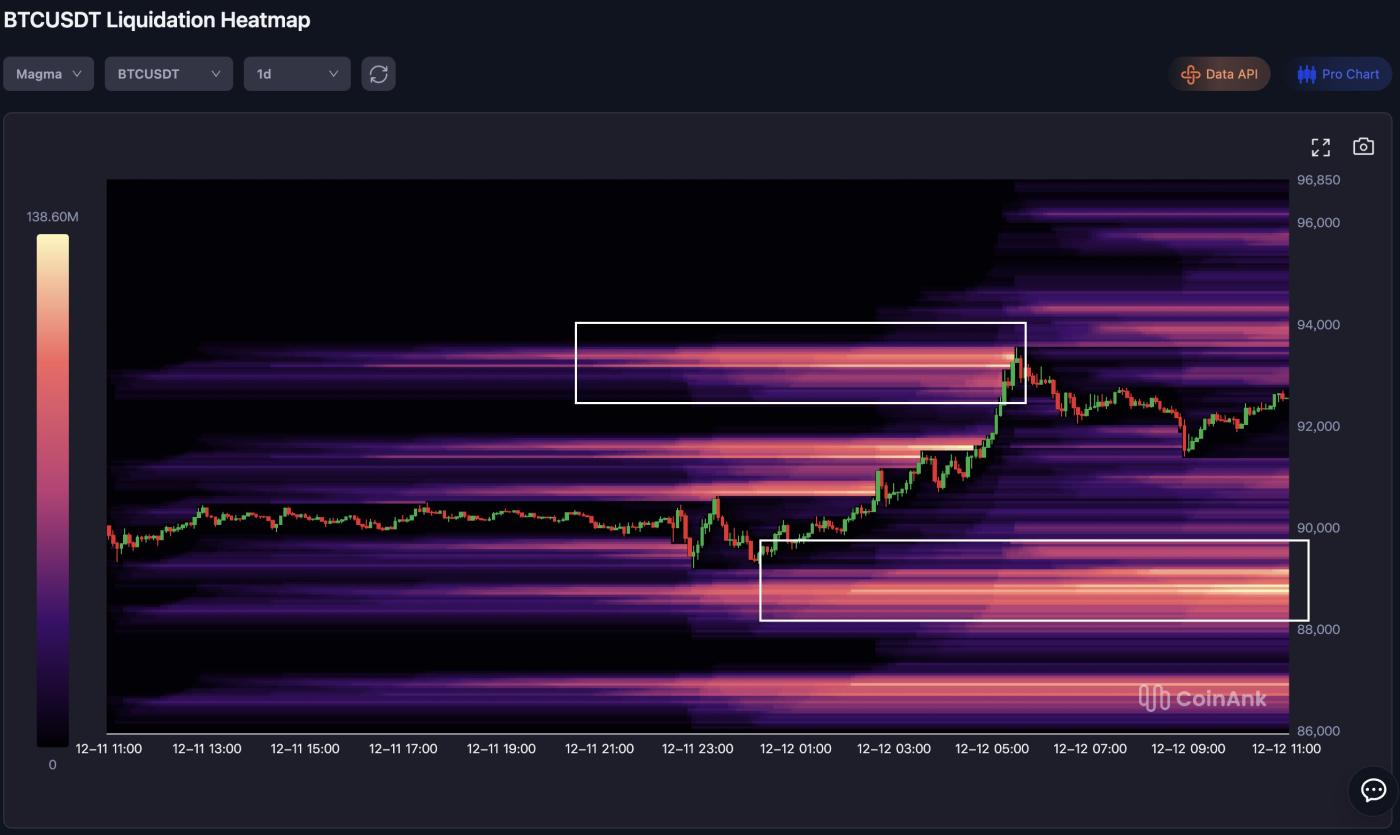
According to Followin, the latest BTC liquidation heatmap data from CoinAnk shows:
Short-term support levels ($88,000 - $90,000): These lower levels are represented by distinct yellow horizontal bands on the heatmap, marking dense clusters of over-leveraged longs during the mid-term correction, poised to trigger a rebound through short-covering waves and the accumulation of forced buying.
Short-term resistance levels ($95,000 - $96,850): The upper boundary shows strong yellow intensity, indicating a large amount of short position liquidation during the closing rebound attempt; a clean breakout could exacerbate the short squeeze, leading to a more sustained upward trend, while a failure to break through could trigger a rapid collapse of long positions.
Overall: Total liquidation volume of approximately $139 million within 24 hours indicates moderate leveraged trading with “stepped stratification,” which aligns with the consolidation and initial upward movement on the candlestick chart, highlighting that volatility will accelerate as the market retests these magnetic zones.