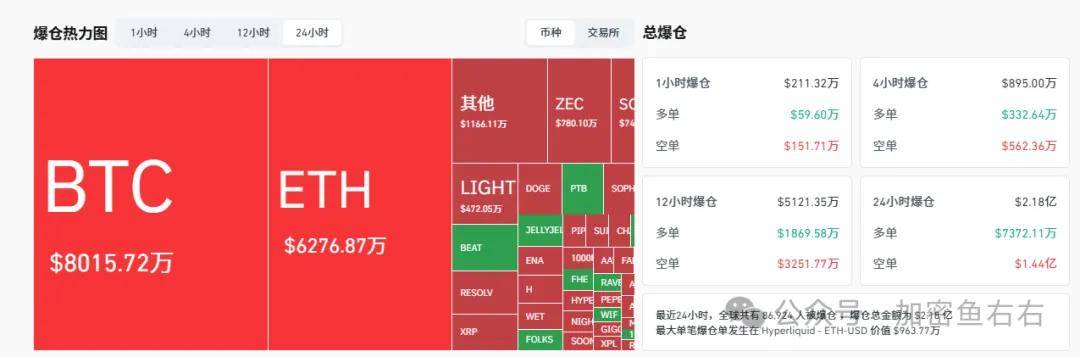
In the past 24 hours, a total of 86,930 people worldwide have been liquidated, with a total liquidation amount of $218 million! Following the Bank of Japan's announcement of a 25 basis point interest rate hike yesterday, the cryptocurrency market experienced a weak rebound. Currently, Bitcoin and Ethereum show signs of bottoming out on the 4-hour chart, but they remain weak. The strategy is to buy on dips, lowering profit expectations. Before Monday's weekly close, buy on dips without hesitation, and short on rallies with a stop-loss at the high point. Repeatedly buy on pullbacks is recommended!
BTC
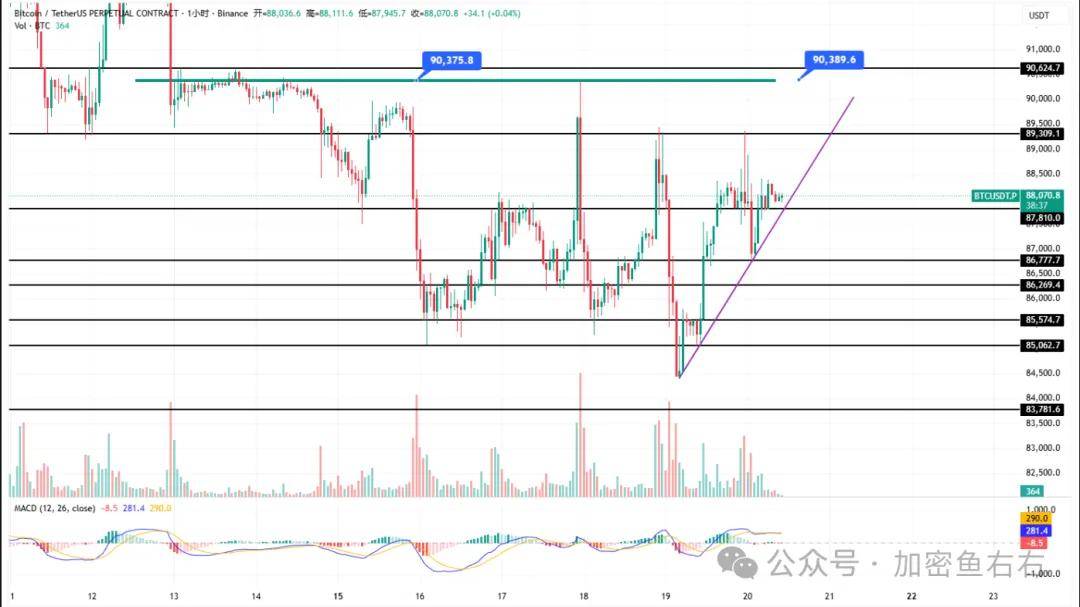
BTC formed a bullish doji green candle this morning, indicating a period of sideways trading over the weekend. The overall BTC trend remains within an ascending triangle bullish structure, currently consolidating between the upper and middle bands around 89350 after encountering resistance. Smaller timeframe indicators (below 1 hour) are all above the zero line, suggesting a slight strengthening of the market compared to the previous two days.
(1) The main resistance points (short-term shorting points) next week are: 89385/89515, 90185, 90750; the resistance points after breaking through 90750 are: 92250, 93050, 94150/94250.
(2) In the short term, there is a rebound at the 12-hour and 1-day levels, with the highs of the rebound around 88800 and 89385 respectively.
(3) There are two risks in the next two weeks : the 15-day and 20-day MACD will return to the zero axis. When the MACD of these two levels returns to zero, it will still retrace to 8w and below 8w, which is also a buy the dips point. We will discuss this later.
ETH
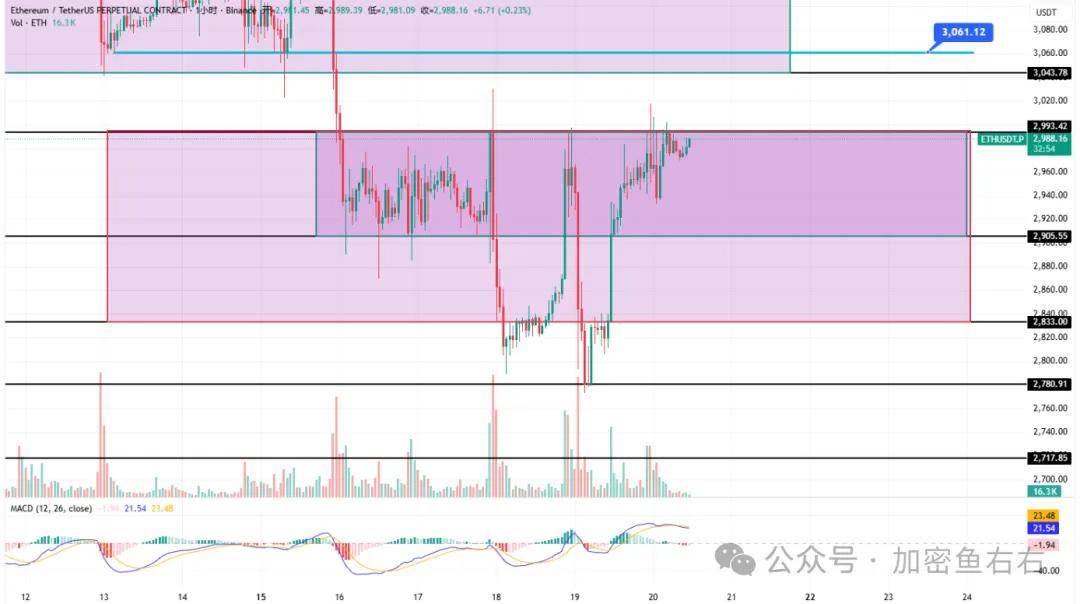
ETH broke out of its trading range and retraced to the upper boundary of the range, confirming the support and continuing its upward rebound. As long as ETH can stay above the upper boundary of the range, it will test the previous high of 3031 or even higher. If it pulls back, as long as it doesn't fall below the neckline of 2937, it won't experience a deep retracement.
Resistance levels are 2993-3034-3091; support levels are 2968-2934-2885. A break below 2939 on the 4-hour chart would target 2903-2852.
Next week's turning point:
December 24 (Wednesday): Minutes of the Japanese Monetary Policy Meeting;
December 25 (Thursday): US stock markets closed; Trump may announce his nominee for the next Federal Reserve Chairman.
December 26 (Friday): Japan's December CPI.
Based solely on the information available, the short-term market from next Wednesday to Friday may experience similar volatility to this week, with both rebounds and sharp drops possible, leaving both bulls and bears feeling uneasy.
TTD
Total supply: 1 billion; initial circulating supply: 13.75%; pre-market price: 0.07; pool price: 0.05.
Positive aspects: 1. No news on community airdrops; 2. Projects with strong market control have very tight control over tokens, with almost all tokens in the market held by the project team; 3. Listed on at least some second- and third-tier exchanges.
Negative factors: 1. The token economics is opaque, allowing for arbitrary dumping (e.g., lock-up periods); 2. The fundraising information is opaque, resembling a fake fundraising event; 3. The project is unregulated and lacks any user base.
Even with a sniper pool price of 0.01, it's useless; there's probably not much room or opportunity. The Alpha project has indeed been somewhat unsatisfactory lately. Yesterday, $RTX performed quite well. Focus on PVP and don't be too ambitious.
BCH
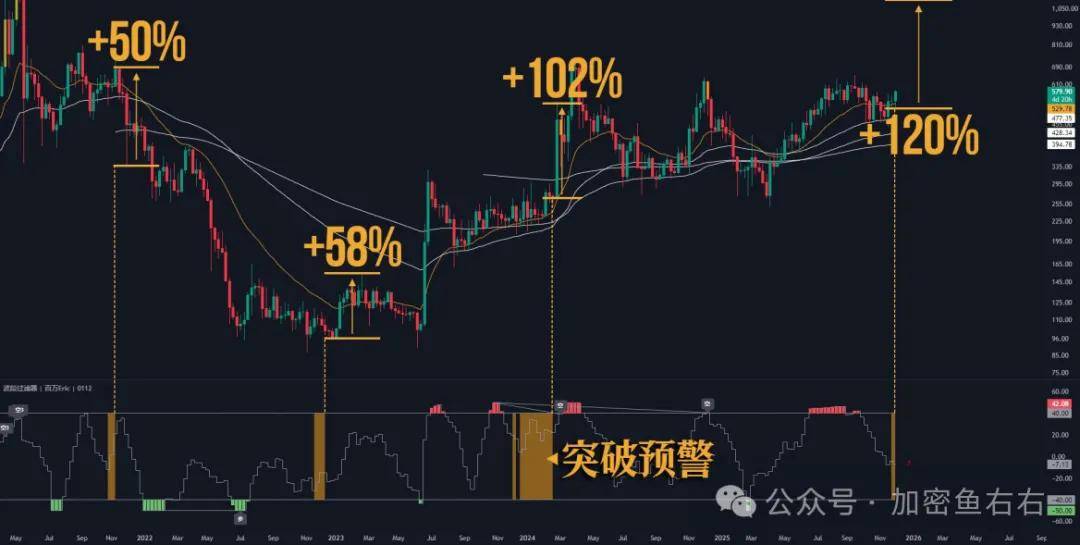
BCH bucked the trend and strengthened, exhibiting the most "obedient" price action. It rebounded when oversold and fell back when overbought, demonstrating a clear structure. Currently, the price has returned to near the highs of October.
Against this backdrop, coupled with the weekly breakout warning signal, BCH is not just something to watch in the short term, but something worth monitoring continuously. If it can effectively break through the two key levels of 650 and 730, the market has the opportunity to switch from a range-bound pattern to a true one-sided trend.
Cryptocurrencies that rise against the trend are difficult to trade, and their sustainability and smoothness are hard to quantify objectively. Low-risk buying opportunities may also appear. At this moment, BCH is at a structural high point, which is not a buying opportunity.
New opportunities on the blockchain
When playing with "on-chain meme"(a type of cryptocurrency), it's crucial to distinguish the characteristics of different blockchain markets. The most obvious distinction is:
① Short-term hot topics in BSC: Celebrity endorsements and internet memes in the Chinese section
② Long-term second stage: SOL (English section) - Technical Value Category and Internet Meme Category
Regardless of the blockchain, the current market conditions do not support long-term holding. The best approach is to take profits during market fluctuations and sell when they are available. Positive news is the best signal to sell, not a basis for unwavering faith.
The market is constantly changing, and specific entry and exit points should be determined based on real-time conditions. Follow the trend after a breakout! No matter how high your confidence level, please strictly adhere to your stop-loss and take-profit strategies! That's all for today! Follow me so you don't get lost! ( Add me on QQ: 3958133807 with a note, and I'll add you to my learning and discussion group.)