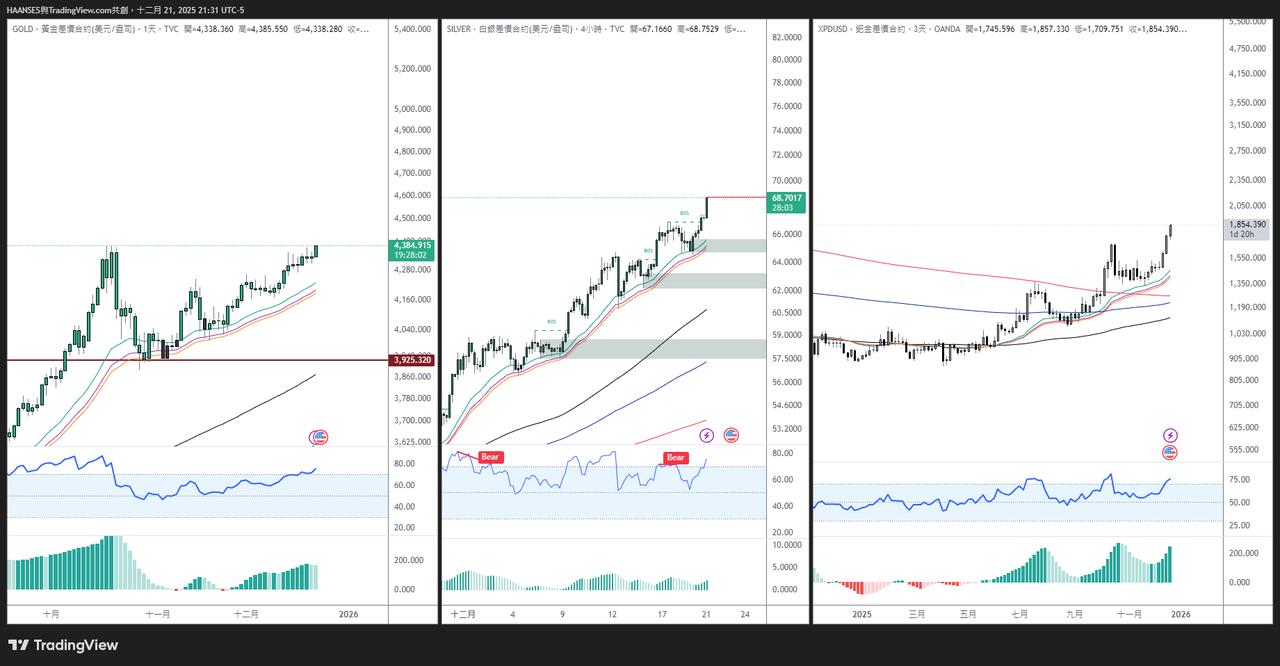
Today we saw gold, silver, and palladium all hit new highs! Since the correction at the end of October, gold has been trading above the 25-35 day moving average; silver is rising along the four-hour moving average; and palladium is rising along the three-day moving average.
Synchronization: This "synchronized new highs" usually signifies the start of a major trend. Gold provides "stability," silver provides "elasticity," while the addition of palladium indicates a dual surge in industrial and investment demand.
In this clear upward trend, trading volume has not weakened significantly and no bearish structure has emerged. Don't try to short the market at the top; otherwise, you'll become "fuel" and be carried along. Although the overall environment indicates poor liquidity in the US, the candlestick chart is the true reflection, and you should follow the trend.
Most importantly, do not prematurely declare a top unless a clear top formation or a significant sell-off with high volume is observed. There will be higher highs after the initial peak, and even higher and higher still, so do not sell prematurely .
However, it's also important to carefully monitor whether the price breaks below the moving average and enters a consolidation phase . Generally, the market needs to enter a consolidation phase before it has a chance to turn bearish. The probability of a direct shift from a bullish to a bearish trend is the lowest, so even if the market reverses, it will usually experience a period of consolidation first.
This set of moving average data is available here for your reference.
This set of moving average data is available for your use here.
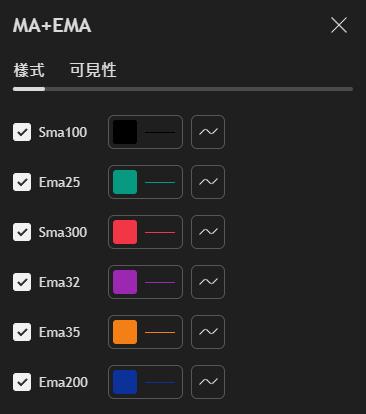
📈 Moving Average System (MA+EMA) Setting Reference
Based on your screenshot, this system includes the following six key moving averages:
- Sma100 (Black): A medium- to long-term trend benchmark.
- Ema25 (green): A highly sensitive short-term exponential moving average.
- Sma300 (red): Long-term trend bottom or extremely strong support/resistance reference.
- Ema32 (purple): When used in conjunction with Ema25, it forms the 25-35 moving average band you mentioned.
- Ema35 (orange): The lower edge of the moving average band is a key area for determining trend support.
- Ema200 (blue): A classic bull-bear dividing line or long-term lifeline.
Summary of core usage
- Moving average band support: When prices are in a strong upward trend, the moving average band (green, purple, orange) formed by Ema25, Ema32 and Ema35 is an excellent reference area for buying or adding to positions.
- Bullish alignment: When short-term moving averages (such as Ema25) are above long-term moving averages (such as Sma300, Ema200) and open upwards, a bullish trend is confirmed.
- Trend-following filter: As long as the price remains above these moving average bands and no obvious bearish structure appears, the "follow the trend" strategy should be maintained.
// @version= 5
indicator('MA+EMA', overlay=true)
e1 = ta.sma(close, 100)
c1 = ta.ema(close, 25)
e2 = ta.sma(close, 300)
c2 = ta.ema(close, 32)
c3 = ta.ema(close, 35)
e3 = ta.ema(close, 200)
plot(e1, 'sma100', color.new(color.gray, 0))
plot(c1, 'ema25', color=color.new(#D3D3D3, 0))
plot(e2, 'sma300', color.new(color.red, 0))
plot(c2, 'ema32', color=color.new(#FDCBB4, 0))
plot(c3, 'ema35', color=color.new(#80FFFF, 0))
plot(e3, 'ema200', color.new(color.black, 0))