

The price of Pi Coin has risen slightly by over 1% in the last 24 hours, but is still trading more than 20% lower than three months ago. The downtrend has not been reversed, but there is a sign of a turnaround.
A bearish scenario is forming on the chart, but retail investors buying on dips have appeared just in time. Now, only large capital flows will decide whether this is a strong rebound or Pi Coin will return to its previous downturn.
Dip Money strives to maintain its position.
From December 19th to 25th, 2023, the price of Pi Coin continued to fall . Simultaneously, the Money Flow Index (MFI) – an indicator assessing money flow during price declines – rose to a new peak. This is a bullish divergence signal, indicating that retail investors absorbed the strong selling pressure before the price truly plummeted.
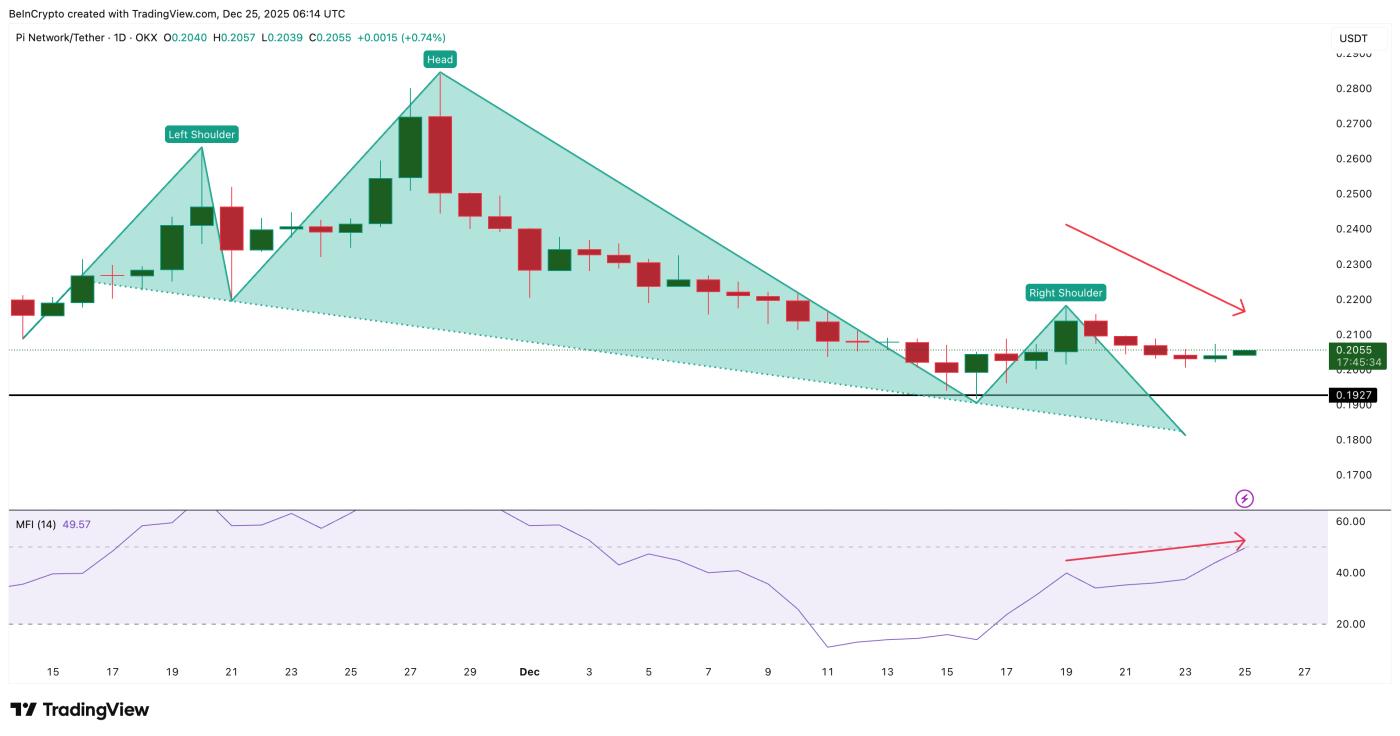 The practice of buying on dips continues: TradingView
Want to Also Read insights on Token like this? Sign up for editor Harsh Notariya's daily Crypto newsletter here .
This divergence is not just a formality. The MFI surged precisely as the Pi Coin price approached the neckline of the head and Vai pattern. Although the pattern remained bearish, the sudden increase in MFI prevented the Pi Coin price from immediately breaking through the support level.
Only large sums of money can reverse the price trend.
This is where Chaikin Money Flow (CMF) comes into Vai . CMF tracks large money flows, XEM whether large orders and deep liquidation are actually entering the market. Currently, Pi Coin's CMF indicator has risen above the descending trend line and is aiming to break through the zero line for the first time since mid-November 2023.
For the trend to reverse to an uptrend, the CMF needs to close above the zero line. The last time the CMF achieved this was from November 14th to 16th, 2023, during which Pi Coin increased by 10.76% in the subsequent sessions.
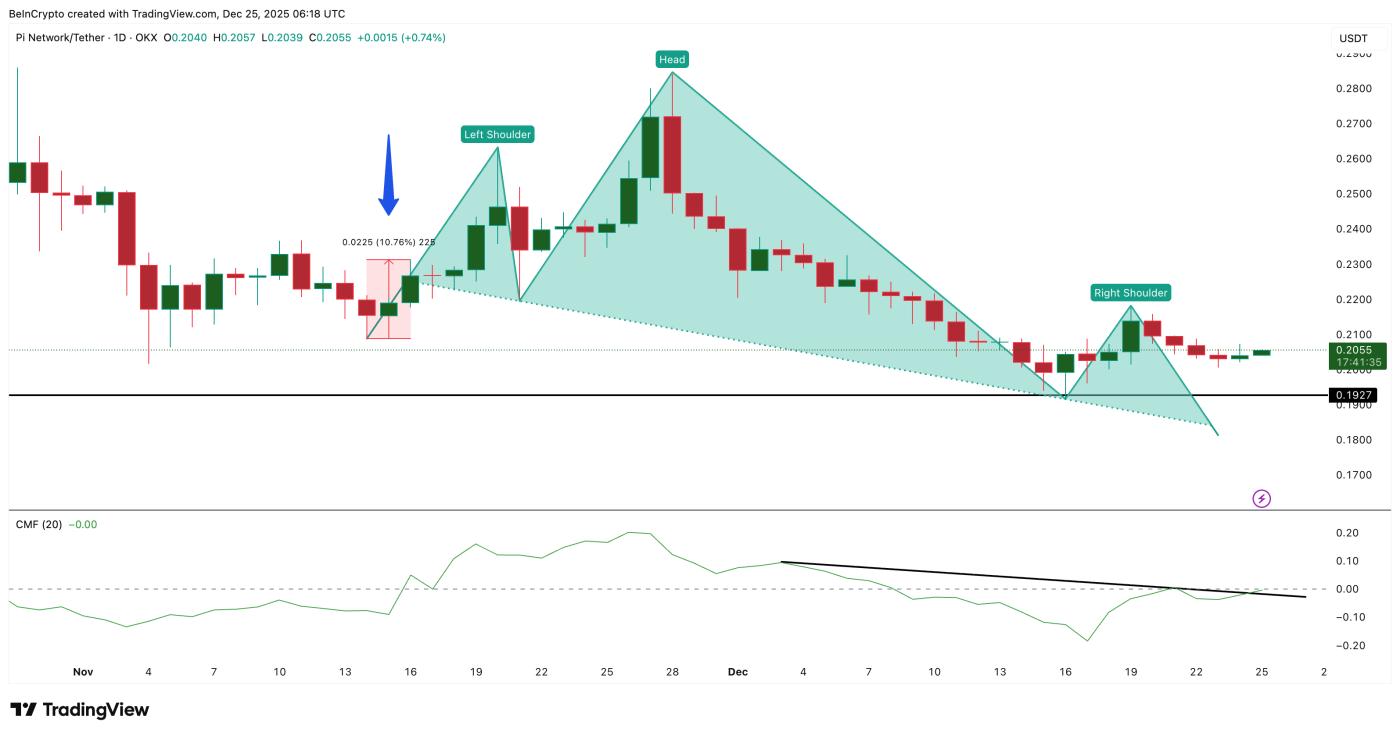 Pi Coin records significant inflow of funds: TradingView
Currently, the pattern shows similarities, but still lacks confirmation signals. As long as the CMF hasn't crossed the zero line, a reversal is not yet established. The PI price chart remains in a "waiting" state.
Pi Coin prices decide everything.
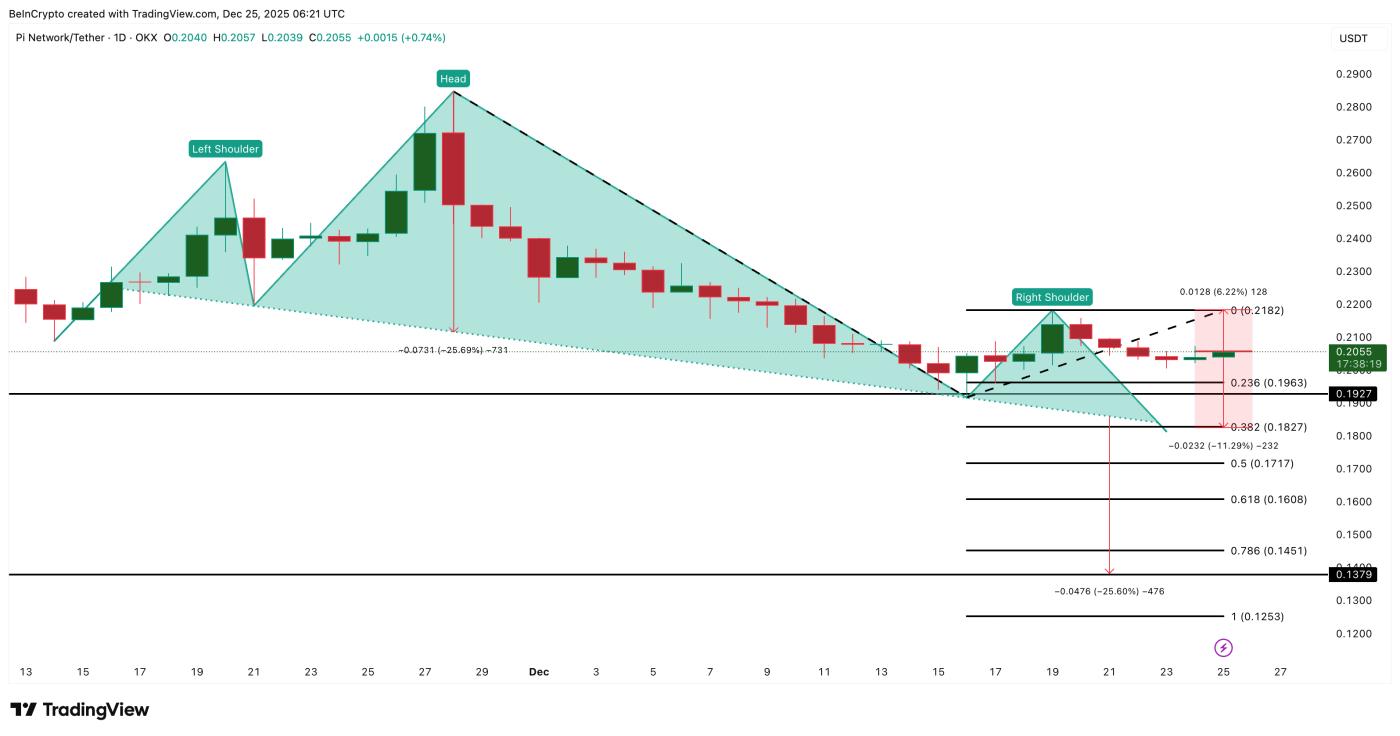
The neckline of the head and Vai pattern is currently around $0.182. As long as Pi Coin holds above this level , the bearish structure remains unconfirmed. If the price surpasses $0.218, a 6% increase, it will break above the right Vai of the pattern. This would weaken the bearish scenario and confirm the large CMF inflow.
If the price falls below $0.192 (the warning zone), the bearish scenario will resume. When the daily candle closes below $0.182 (a 11% drop), the pattern will be completely broken, and the market will head towards a target of $0.137. This represents a 25% downside risk based on the head-to-neck measurement. While not a certainty, this is a calculation that cannot be ignored.
 Pi Coin Price Analysis: TradingView
Currently, the price of Pi Coin is "sandwiched" between retail investor funds and large-scale capital flows. The MFI has shown a reaction, while the CMF has not – or is only just beginning to. Until both indicators confirm this, Pi Coin will remain in limbo between the opportunity for recovery and the risk of further decline.


