Odaily's featured market analyst, Cody Feng, holds a Master's degree in Financial Statistics from Columbia University. During his university years, he focused on quantitative trading in US stocks and gradually expanded to digital assets such as Bitcoin. Through practical experience, he has built a systematic quantitative trading model and risk control system. He possesses keen data insight into market fluctuations and is committed to continuous professional development in the trading field, pursuing stable returns. He will provide weekly in-depth analysis of BTC technical, macroeconomic, and funding changes, reviewing and showcasing practical strategies, and previewing recent noteworthy events for reference.

Key takeaways from the weekly trading report:
• Validation of the effectiveness of strategy execution (short term): Last week's trading strictly followed the established strategy and successfully completed two short-term operations (1x leverage), achieving a cumulative return of 0.62%.
• Core Viewpoint (Short-Term) Validated : Our short-term viewpoint presented last week has been validated by the market: if Bitcoin can effectively hold above the $86,000-$86,500 range, it will maintain a range-bound movement between $86,500 and $91,000. The price action over the past week has precisely confirmed this judgment. Last week, the price reached a high of $91,764 and a low of $86,675, largely coinciding with our key levels, thus confirming the range-bound trading pattern.
In the previous analysis, we explored possible price movements favorable to short sellers. From the perspective of the bulls, the current market might continue its current pattern of small fluctuations and slow upward movement. Upon reaching the dual resistance of the downtrend line since October of last year and the long-term uptrend line since the end of 2022, a large-volume bullish green candle could break through the key resistance level, creating a "short squeeze" and clearing out short positions. A second dip might then occur, further shaking out retail investors who bought at recent lows, thus completing the bottom formation. Afterward, the price is expected to rise rapidly, moving away from the main players' cost zone and initiating a significant technical rebound. It's important to clarify that the above scenario is only a prediction favorable to the bulls and is not guaranteed to happen. Regardless of the market's direction, the principle that "the market is always right" must be remembered, and choosing the right strategy is crucial.
I. Trading Results Last Week: (December 29 - January 4)
1. Short-term trading review (without leverage):
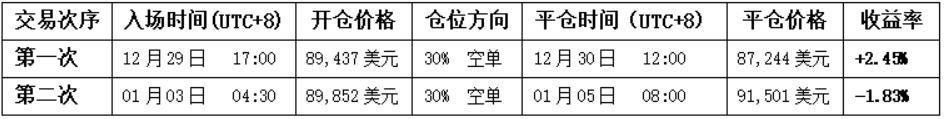
• First trade ( profit 2.45% ): Based on the "short sell when rebounding to the core resistance area" pattern. When the price encountered resistance in the $ 89,500-$91,000 range, a top signal was simultaneously generated by the spread trading model, allowing a 30% short position to be established, and finally closed for profit when the price fell back to the support area.
• Second trade ( profit -1.83% ): This time, the same entry logic as above was used; however, the price movement deviated from expectations. The price consolidated sideways to repair technical indicators, then slowly climbed, effectively breaking through the key resistance level of $ 91,000 . Finally, when I observed that both trading models were converging to issue bottom signals, I decided to close all positions and stop the loss.
2. Review of last week's market trend forecast and trading strategies:
Last week's key takeaway: Focus on the $ 86,000-$86,500 range. A break below this level would likely lead to a consolidation and price decline; conversely, a sustained hold above this level would maintain the $ 86,500-$91,000 range-bound trading pattern.
① Review of key locations:
• Key resistance levels: First resistance is seen in the $ 89,500–$91,000 area; second resistance is seen in the $ 93,000–$94,500 area.
• Key support levels: First support is seen in the $ 86,000-$86,500 area; second support is seen in the $ 83,500-$84,500 area.
② Review of operational strategies:
• Medium-term strategy: Maintain a medium-term position of around 65% (short positions).
• Short-term strategy: Based on the actual market trend, we ultimately adopted Option A ( effectively stabilizing in the $ 86,000-$86,500 area ) as our core strategy and implemented it.
• Opening a position: When the price rebounds to the $89,500-$91,000 range and shows signs of resistance, a 30% short position can be established.
• Risk control: Set the stop loss for short positions above $92,500 .
• Close positions: When the price of the coin falls to the $86,000-$86,500 range and shows signs of stabilization, close all short positions to lock in profits.
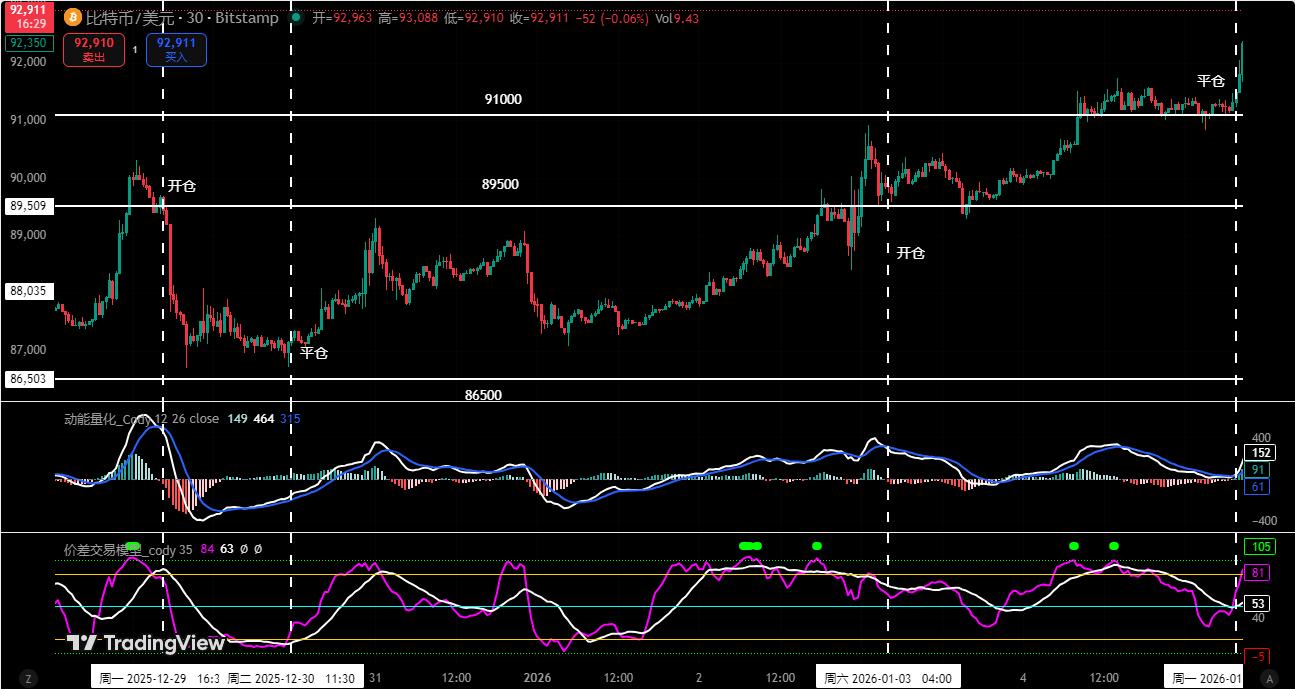
Figure 1
II. Quantitative Technical Analysis: How to Enter the Market
Based on last week's market performance, this article will utilize a multi-dimensional analysis model to conduct an in-depth analysis of the evolution of Bitcoin's internal structure.
Bitcoin Weekly Chart: (Momentum-based quantification model + sentiment-based quantification model)
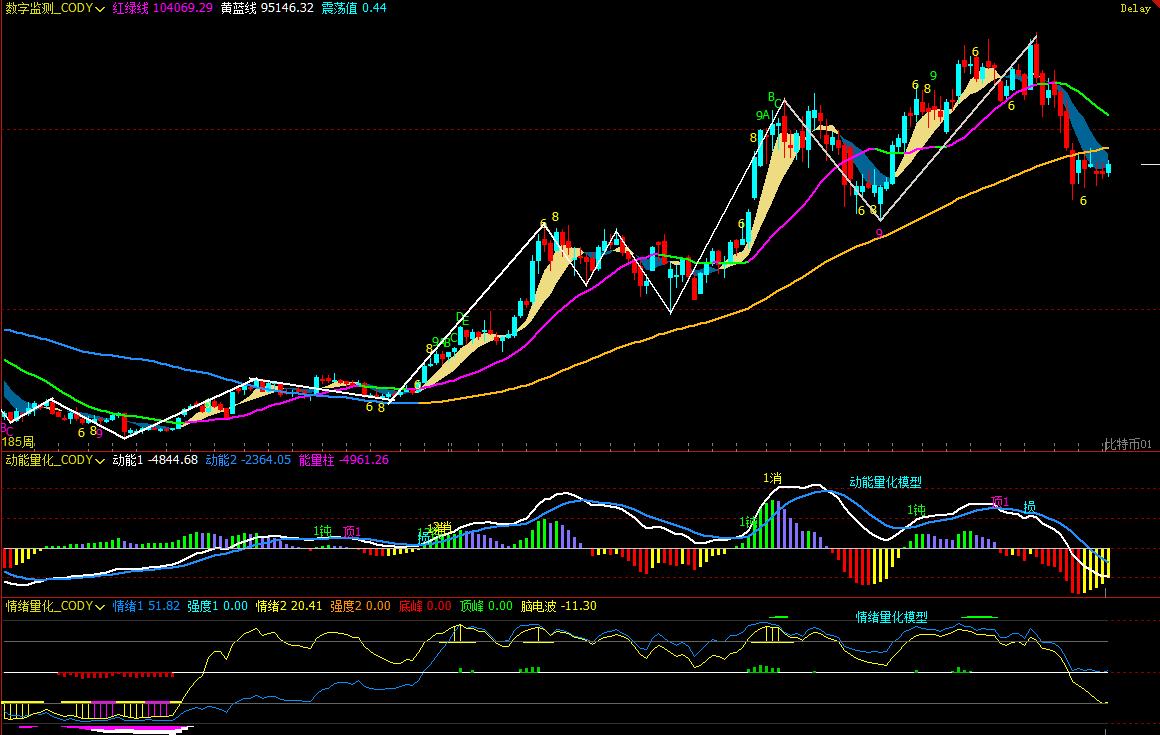
Figure 2
1. As shown in Figure 2, analysis from the weekly chart:
• Momentum-based model: Technical indicators show that both momentum lines continue to decline below the zero axis, while the negative momentum bars are shrinking. This reflects that although the bears are in control, their downward momentum has not yet fully materialized.
The kinetic energy model predicts: Price decline index: High
• Emotion Quantification Model: The blue emotion line has a value of 51.82, with an intensity of zero; the yellow emotion line has a value of 20.41, with an intensity of zero and a peak value of 0.
The sentiment quantification model predicts: Price pressure and support index: Neutral.
• Digital monitoring model: The price has been below the bullish/bearish (yellow and blue lines) dividing line for 7 weeks; no short-term bottoming signal has appeared.
The above data suggests that Bitcoin's weekly chart has entered a downtrend, and the risk of a period of consolidation should be noted.
Bitcoin daily candlestick chart:
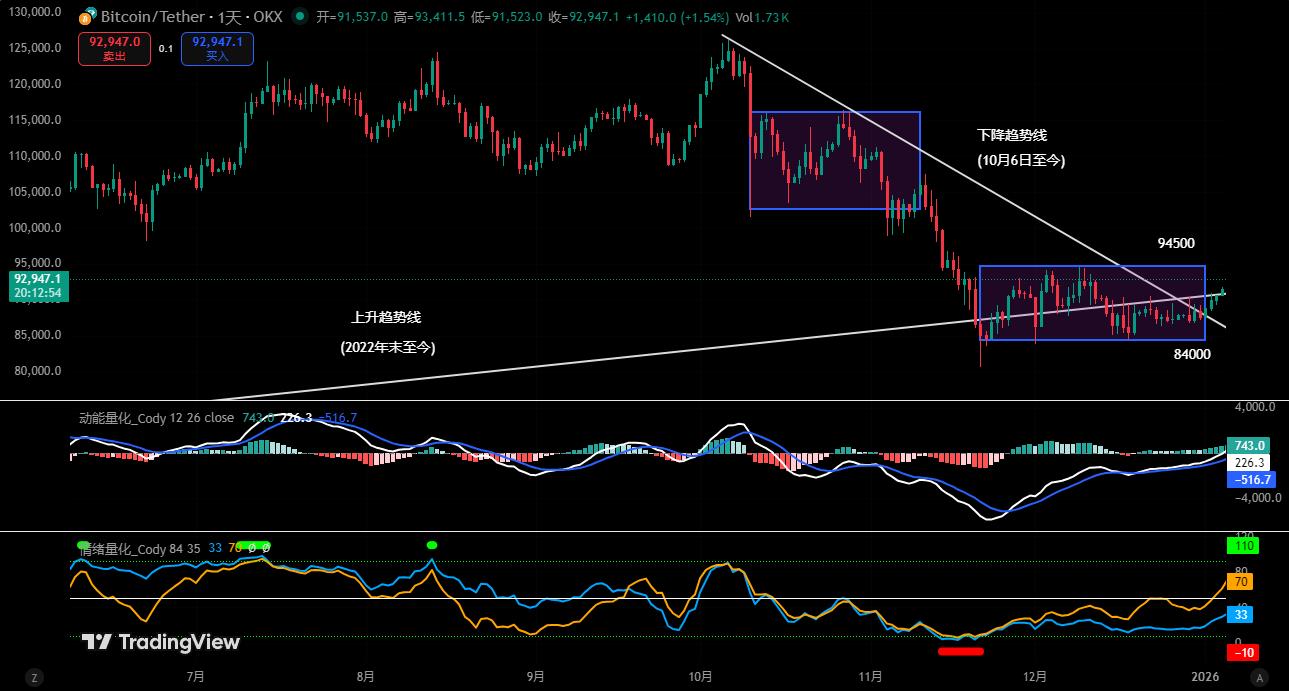
Figure 3
2. As shown in Figure 3, analysis from the daily chart:
• Momentum-based model: The price rose for four consecutive days in the latter half of last week, and the two momentum lines gradually widened. The white momentum line is about to approach the zero axis, and the positive momentum bars show signs of gradually increasing.
The kinetic energy model suggests that the area near the zero line is a battleground for both bulls and bears; pay attention to whether the zero line is breached or breached.
• Sentiment Quantification Model: After the market closed last Sunday, the blue sentiment line value was 29, with an intensity of zero; the yellow sentiment line value was 61, with an intensity of zero.
The sentiment quantification model predicts: Stress and support index: Neutral
The above data suggests that the market is still in a downtrend on the daily chart, but it is beginning to choose a direction.
III. Market Forecast for This Week: (January 5th - January 11th)
1. Before the market makes a directional choice this week, the main fluctuation range is expected to be between $ 84,000 and $94,500 . In terms of trading, we should pay close attention to the performance of the price near the boundary of the range.
• If the price breaks below the key support level of $84,000 , it may begin a bottoming-out process, at which point the $ 80,000 mark will be tested.
• If the price can effectively hold above the key resistance level of $94,500 , a relatively strong technical rebound is expected to begin.
2. Core pressure level:
• First resistance zone: $ 93,000–$94,500 area
• Second resistance zone: around $ 97,500 to $99,500
• Key resistance level: around $ 104,000 .
3. Core support level:
• First support level: $ 89,500–$91,000 area
• Second support level: $ 86,000–$86,500 area
• Third support level: $ 83,500–$84,500 area
• Key support level: around $ 80,000 .
IV. Trading Strategy for This Week (excluding the impact of unexpected news): (January 5th - January 11th)
1. Medium-term strategy:
• Until the price breaks through $ 94,500 , maintain a medium-term position of around 65% (short position).
• If the price successfully breaks through and holds above $ 94,500 , close all medium-term positions (short positions) and hold the position.
2. Short-term strategy: Use 30% of your position, set a stop-loss point, and look for opportunities to profit from price differences based on support and resistance levels. (Use a 30-minute timeframe as the trading period).
3. To cope with market changes, we have formulated three short-term trading plans: A, B, and C.
• Optimization A : If the price of the coin remains within the range of $84,000 to $94,500 :
• Opening a position: When the price rebounds to the $93,000-$94,500 range and shows signs of resistance, a 30% short position can be established.
• Risk control: Set the stop loss for short positions above $95,500 .
• Reduce positions: When the price of the coin falls to the $86,000-$86,500 range and shows signs of stabilization, close out some short positions.
• Close out positions: When the price of the coin drops to around $ 84,000 and shows signs of stabilization, close out all positions and realize profits.
• Option B: If the price breaks below the $84,000 support level:
• Opening a position: If the price breaks below the support level, a 30% short position can be established.
• Risk control: Stop loss set above $85,000 .
• Closing positions: When the price of the coin drops to around $ 80,000 and shows signs of stabilization, you can gradually close your positions and take profits.
• Option C: If the price successfully breaks through and holds above the $94,500 resistance level:
• Opening a position: If the price successfully breaks through, a 30% long position can be established.
• Risk control: Stop loss set below $93,000 .
• Closing positions: When the price rebounds to around $ 97,500 and encounters resistance, you can gradually close your positions and take profits.
V. Special Note:
1. When opening a position: immediately set the initial stop loss level.
2. When the profit reaches 1% , move the stop loss to the opening cost price (break-even point) to ensure the safety of the principal.
3. When the profit reaches 2%, move the stop loss to the position where the profit is 1%.
4. Continuous monitoring: For every additional 1% profit in the coin price thereafter, the stop loss level will be moved by 1% to dynamically protect and lock in existing profits.
(Note: The 1% profit trigger threshold mentioned above can be adjusted flexibly by investors based on their own risk appetite and the volatility of the underlying asset.)
VI. Key Events Preview for This Week: (January 5th - January 11th)
I. Frequent Statements from FOMC Officials: A Forward-Looking Window for Policy Path Expectations
This week, several voting Federal Reserve officials will deliver speeches on the economic outlook and policy stance, providing the market with an important source of information regarding the future path of monetary policy.
At 01:30 on Monday, Neel Kashkari, a 2026 FOMC voting member and president of the Minneapolis Federal Reserve, will speak at the American Economic Association.
At 21:00 on Tuesday, Richmond Fed President Barkin, a 2027 FOMC voting member, will deliver a speech.
At 23:00 on Friday, Kashkari will deliver a welcome address and participate in informal discussions at an online conference hosted by the bank.
At 02:35 on Saturday, Barkindo will speak again on the economic outlook.
The current market focus is on whether officials will maintain a "cautiously accommodative" tone or begin to provide clearer signals for a policy shift in the next phase . It's important to note that officials' speeches typically influence the structure of expectations rather than short-term direction , making them more suitable as a reference for medium-term funding pricing.
II. ADP Employment Data: An Important Indicator Before Non-Farm Payrolls
At 21:15 on Wednesday, the US will release its December ADP employment figures, with the previous value being -32,000 and the market forecast being 45,000.
Before the release of the non-farm payrolls report, the ADP report serves more as a trend confirmation than a pricing determinant . The market's focus is not on single-month fluctuations, but on whether employment is gradually shifting from "high-level resilience" to "moderate cooling."
If the ADP report shows a significant rebound, it will reinforce the short-term assessment that "employment remains supported," potentially raising US Treasury yields and putting some downward pressure on risk asset sentiment. If the data continues to be weak or falls short of expectations, it will further validate the cooling logic of the labor market, providing a prelude to expectations of easing and making Bitcoin's medium-term valuation more favorable.
III. Initial Jobless Claims: A High-Frequency Indicator for Observing Employment Turning Points
At 21:30 on Thursday, the United States will release the number of initial jobless claims for the week ending January 3. The previous value was 199,000 and the forecast was 216,000.
Compared to ADP and non-farm payrolls, initial jobless claims are more like a liquidity and economic thermometer . A sustained level above trend often indicates a structural loosening in the job market.
If initial jobless claims continue to rise and remain above 210,000, it will strengthen expectations of an economic slowdown and policy easing, which will benefit the valuation recovery of non-yielding assets such as Bitcoin; if the data falls back, it may strengthen the narrative that "the economy is still resilient," which will be unfavorable to the expansion of risk appetite in the short term.
IV. Non-Farm Payrolls Report: The Most Crucial Macroeconomic Pricing Node This Week
At 21:30 on Friday, the United States will release its December unemployment rate and seasonally adjusted non-farm payroll data.
The unemployment rate was 4.60% previously, and is projected to be 4.50%.
Non-farm payrolls were down 105,000 in the previous month and are projected to be down 55,000.
If non-farm payrolls recover moderately and the unemployment rate remains high but does not worsen further, the market will interpret this as a "cooling down but not a loss of momentum," and risk assets as a whole may remain volatile . If employment data weakens significantly again and the unemployment rate rises, it may impact risk appetite in the short term, but in the medium term it will strengthen expectations of easing, providing potential support for BTC.
Financial markets are constantly changing, and all market analysis and trading strategies need to be dynamically adjusted. All views, analytical models, and operational strategies presented in this article are derived from personal technical analysis and are for personal trading journal use only. They do not constitute any investment advice or basis for action. The market is risky; invest with caution. DYOR.