

Original title: Bitcoin is now less volatile than Nvidia, a statistical anomaly that completely changes your risk calculation
Original author: Gino Matos, CryptoSlate
Original translation by: Saoirse, Foresight News
As Bitcoin closed 2025, its actual daily volatility dropped to 2.24%, marking the lowest annual figure on record for the asset.
K33 Research's volatility chart dates back to 2012—when Bitcoin's daily volatility was 7.58%. The data shows that Bitcoin volatility has steadily declined in each cycle: 3.34% in 2022, 2.80% in 2024, and further down to 2.24% in 2025.
However, market sentiment and data diverged. In October 2025, the price of Bitcoin plummeted from $126,000 to $80,500, a heart-wrenching process; on October 10, a wave of liquidations triggered by tariff policies wiped out $19 billion in leveraged long positions in a single day.
The paradox is that while Bitcoin volatility has indeed decreased by traditional standards, it has attracted larger inflows of funds and experienced greater absolute price volatility compared to previous cycles.
The rate does not mean that "the market has fallen into stagnation," but rather that the market is mature enough to absorb institutional-level capital flows and will not reproduce the "chain reaction" feedback loops of the early cycles.
Today, ETFs, corporate treasuries, and regulated custodians have become the "ballast" of market liquidity, and long-term holders are continuously reallocating their assets to this infrastructure.
The end result is that Bitcoin's daily returns are more stable, but its market capitalization still fluctuates by hundreds of billions of dollars—a level of volatility that would have triggered an 80% crash in 2018 or 2021.
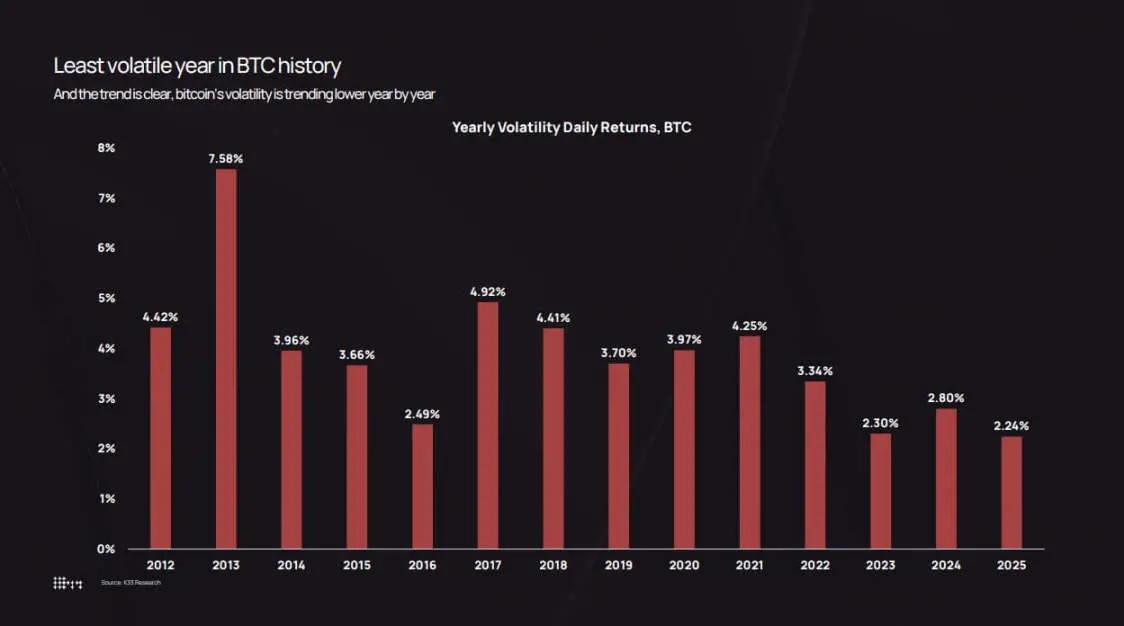
According to data from K33 Research, Bitcoin's annual volatility is expected to decline from a peak of 7.58% in 2013 to a record low of 2.24% in 2025.
Volatility continues to decline
K33's annual volatility data records this shift.
In 2013, Bitcoin's average daily return was 7.58%, reflecting the market's thin order book and speculative frenzy. By 2017, this figure had dropped to 4.81%; in 2020, it was 3.98%; and it slightly rebounded to 4.13% during the 2021 pandemic-driven bull market. In 2022, the collapses of the Luna project, Three Arrows Capital, and the FTX trading platform pushed volatility to 3.34%.
Volatility subsequently declined: to 2.94% in 2023, 2.80% in 2024, and then to 2.24% in 2025.
The logarithmic price chart further confirms this trend. From 2022 to 2025, Bitcoin did not experience the extreme "boom followed by crash," but instead steadily rose within an upward channel.
Although there were corrections during this period—the price fell below $50,000 in August 2024 and to $80,500 in October 2025—there was no "systemic collapse after a parabolic surge".
Analysis indicates that the approximately 36% drop in October 2025 is still within the normal range of Bitcoin's historical retracements. The difference lies in the fact that previous 36% pullbacks mostly occurred at the end of the high volatility range of 7%, while this time it occurred at the low volatility range of 2.2%.
This creates a "cognitive gap": a 36% drop in six weeks still feels dramatic to the eye; but compared to earlier cycles (when 10% intraday fluctuations were common), the market volatility in 2025 is relatively mild.
Asset management firm Bitwise points out that Bitcoin’s actual volatility has fallen below that of Nvidia, a change that redefines Bitcoin’s position from a “pure speculative instrument” to a “high-beta macro asset.”
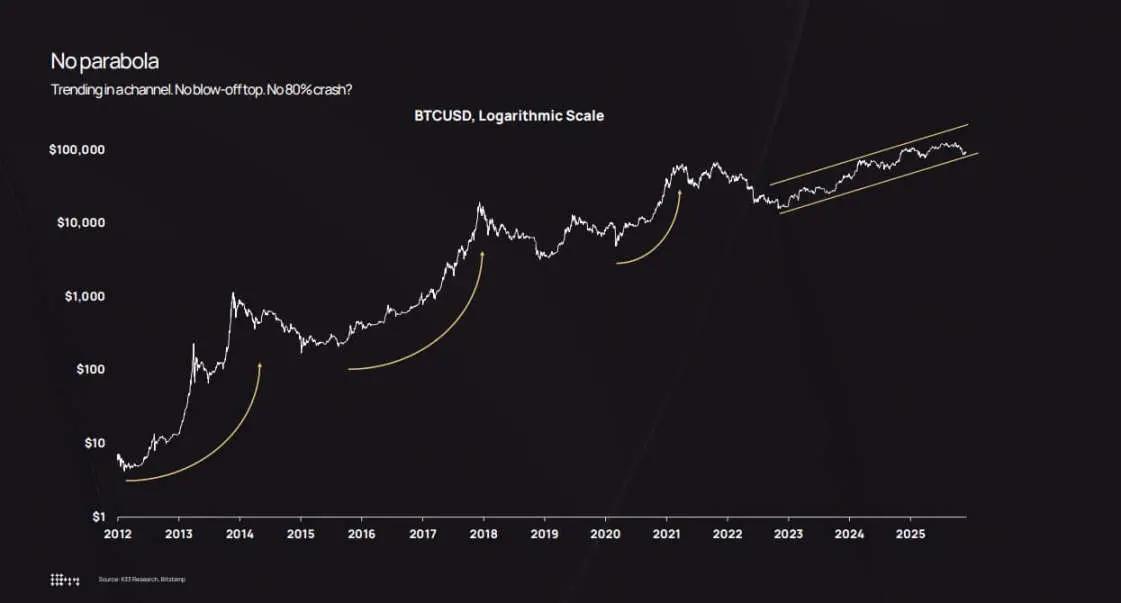
Bitcoin's logarithmic price chart shows that since 2022, its price has been slowly rising within an upward channel, avoiding the parabolic surge and 80% crash that occurred in the earlier cycle.
Market capitalization expansion, institutional entry and asset redistribution
K33's core argument is that the decline in actual volatility is not due to a decrease in capital inflows, but rather because a larger amount of capital is now needed to drive price changes.
The chart of Bitcoin's market capitalization changes over three months, created by the agency, shows that even during periods of low volatility, the market capitalization can still fluctuate by hundreds of billions of dollars.
During the pullback from October to November 2025, Bitcoin's market capitalization will evaporate by approximately $570 billion, almost the same as the $568 billion pullback in July 2021.
The magnitude of the volatility has not changed; what has changed is the "depth" at which the market absorbs these fluctuations.
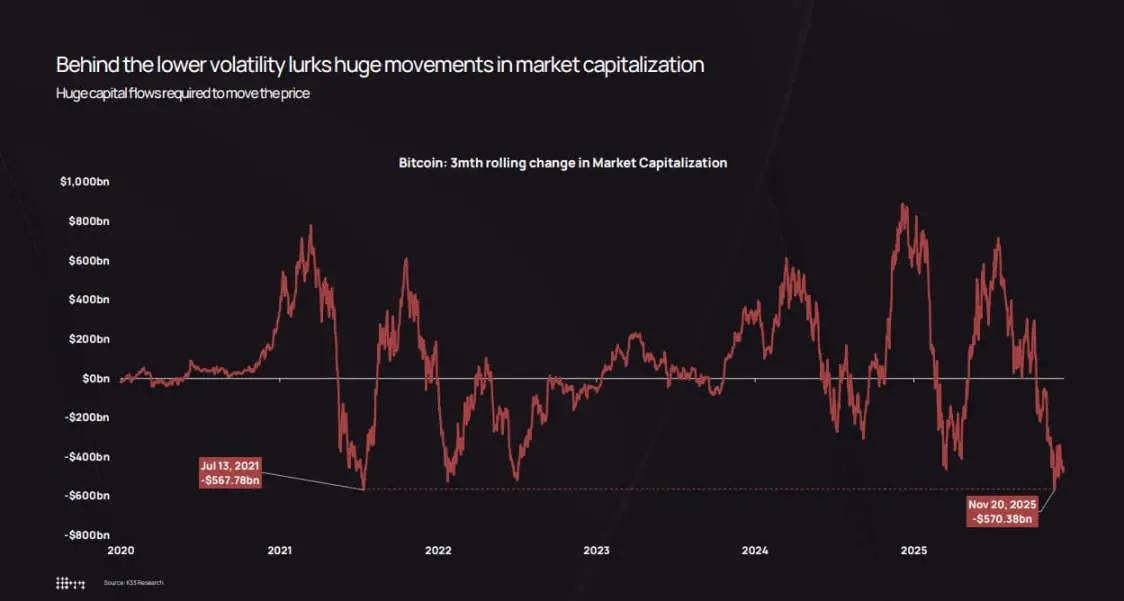
In November 2025, Bitcoin's market capitalization fluctuated by $570 billion over three months, which, despite the lower volatility, was comparable to the $568 billion drop in July 2021.
Three structural factors have driven the decline in volatility:
First, there's the "accumulation" effect of ETFs and institutions . K33 statistics show that in 2025, ETFs net purchased approximately 160,000 Bitcoins (though lower than the more than 630,000 in 2024, the scale is still considerable). ETFs and corporate treasuries combined increased their holdings by approximately 650,000 Bitcoins, accounting for more than 3% of the circulating supply. These funds entered the market through "programmatic rebalancing," rather than being driven by retail investor FOMO sentiment.
K33 specifically pointed out that even though the price of Bitcoin fell by about 30%, the ETF holdings only decreased by a single-digit percentage, and there was no panic redemption or forced liquidation.
Secondly, there are corporate treasuries and structured issuances . As of the end of 2025, corporate treasuries held approximately 473,000 Bitcoins (the rate of increase slowed in the second half of the year). New demand primarily came from preferred stock and convertible bond issuances rather than direct cash purchases—because finance teams implement capital structure strategies quarterly, rather than chasing short-term market trends like traders.
Third is the redistribution of assets from early holders to a wider group . K33's "Asset Holding Years Analysis" shows that since the beginning of 2023, Bitcoins that had been idle for more than two years have begun to be steadily "activated," with approximately 1.6 million long-term held Bitcoins entering circulation over the past two years.
2024 and 2025 were the two years with the largest activation of "dormant assets." The report mentioned that in July 2025, Galaxy Digital sold 80,000 bitcoins and Fidelity sold 20,400 bitcoins.
These sell-offs happen to coincide with the “structural demand” of ETFs, corporate treasuries, and regulated custodians—the latter of which would gradually build positions over several months.
This redistribution is crucial: early holders accumulate Bitcoin at prices between $100 and $10,000, with the assets concentrated in a few wallets; when they sell, the assets flow to ETF shareholders, corporate balance sheets, and high-net-worth clients who buy in small amounts through diversified portfolios.
The end result is a decrease in Bitcoin holding concentration, an increase in order book thickness, and a weakening of the "chain reaction loop." In the early stages, a sell-off of 10,000 Bitcoins in a illiquid market could cause a price crash of 5% to 10%, triggering stop-loss orders and liquidations. However, in 2025, such a sell-off will attract buying from multiple institutional channels and could even drive the price up by 2% to 3%, weakening the feedback loop and reducing daily volatility.
Portfolio construction, leverage shocks, and the end of the "parabolic cycle"
The decline in actual volatility has changed the way institutions calculate "Bitcoin holdings".
Modern portfolio theory posits that asset allocation weights should be based on "risk contribution" rather than "return potential." For example, a 4% allocation to Bitcoin, with a daily volatility of 7%, contributes significantly more to portfolio risk than with a volatility of 2.2%.
This mathematical fact forces asset allocators to make a choice: either increase their Bitcoin holdings or use options and structured products (assuming the underlying asset is more stable).
K33's cross-asset performance chart shows that Bitcoin will be near the bottom of the asset return rankings in 2025—despite outperforming for many years in previous cycles, it will lag behind gold and stocks in 2025.
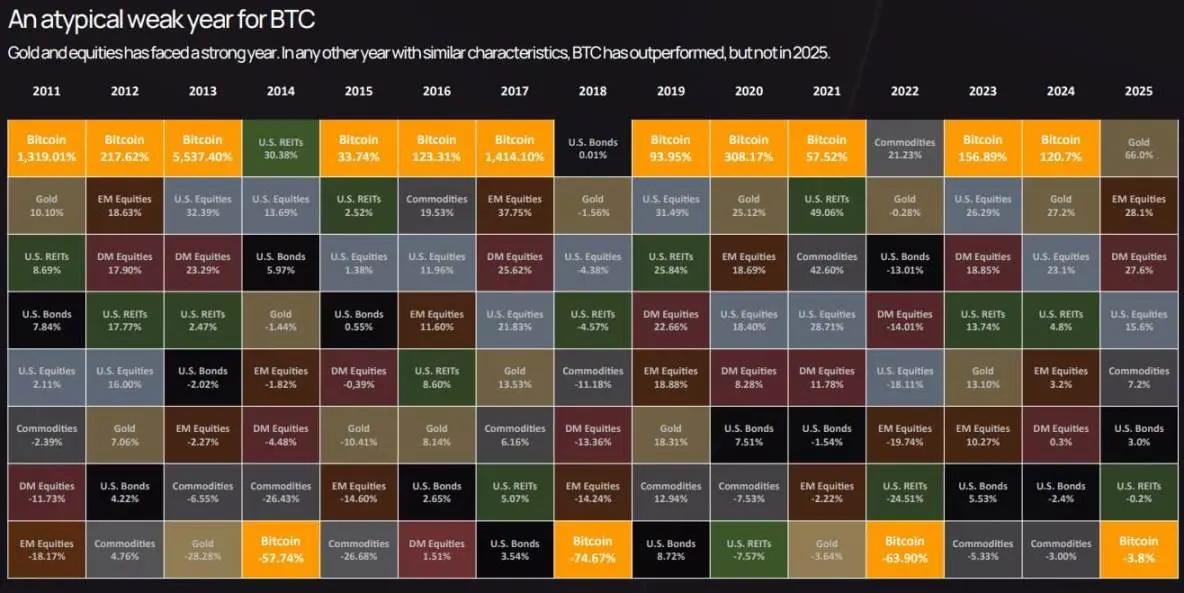
Bitcoin ranked near the bottom in asset performance in 2025, with a drop of 3.8%, lagging behind gold and stocks in this atypical year for Bitcoin.
This underperformance coupled with low volatility has shifted Bitcoin's positioning from a "speculative satellite asset" to a "core macro asset"—risks similar to stocks, but with return drivers uncorrelated with other assets.
The options market also reflects this shift: recently, the implied volatility of Bitcoin options has declined in tandem with actual volatility, which has reduced hedging costs and made synthetic structured products more attractive.
Previously, compliance departments often restricted financial advisors from allocating Bitcoin due to "excessive volatility." Now, advisors have quantitative evidence: Bitcoin volatility in 2025 will be lower than Nvidia, lower than many tech stocks, and comparable to high-beta stocks.
This opens up new investment avenues for Bitcoin: inclusion in 401(k) retirement plans, Registered Investment Advisor (RIA) configurations, and portfolios of insurance companies subject to strict volatility limits.
K33's forward-looking data predicts that as these channels open, ETF net inflows in 2026 will exceed those in 2025, forming a "self-reinforcing cycle": more institutional funds flowing in → reduced volatility → unlocking more institutional orders → more funds flowing in.
However, the market's "calm" was conditional. K33's derivatives analysis shows that throughout 2025, open interest in Bitcoin perpetual contracts steadily increased in an environment of "low volatility and strong upward movement," ultimately culminating in a liquidation event on October 10th—wiping out $19 billion in leveraged long positions in a single day.
This sell-off is related to President Trump's tariff statement and widespread "risk aversion," but the core mechanism is still the derivatives issue: excessive leverage on long positions, thin liquidity over the weekend, and a chain of margin calls.
Even with an actual volatility of 2.2% for the year, there may still be "extreme volatility days triggered by leveraged liquidation." The difference is that such events are now resolved within hours rather than lasting for weeks; and the market can recover quickly because spot demand from ETFs and corporate treasuries provides a "price floor."
The structural backdrop for 2026 supports the view that "volatility will remain low or decline further": K33 expects that as the two-year Bitcoin supply stabilizes, early holders will reduce selling; in addition, there are positive signals from the regulatory front—the US Clarity Act, the full implementation of the European MiCA, and Morgan Stanley and Bank of America opening up 401(k) and wealth management channels.
K33's "Golden Opportunity" data predicts that Bitcoin will outperform stock indices and gold in 2026—due to regulatory breakthroughs and the impact of new funds, which will outweigh the selling pressure from existing holders.
Whether this prediction will come true remains uncertain, but the mechanisms driving it—deepening liquidity, improved institutional infrastructure, and clear regulation—do indeed provide support for low volatility.
Ultimately, the Bitcoin market will move away from its "speculative frontier" characteristics of 2013 or 2017 and become more like a "highly liquid, institutionally anchored macro asset."
This does not mean that Bitcoin has become "boring" (e.g., with low returns or a lack of narrative), but rather that "the rules of the game have changed": price paths are smoother, options market and ETF liquidity are more important than retail sentiment, and the core changes in the market are reflected in the structure, leverage levels, and the composition of trading parties.
In 2025, despite the largest regulatory and structural changes in Bitcoin's history, it has become an "institutionalized stable asset" from a volatility perspective.
The value of understanding this shift lies in the fact that low real volatility is not a signal that "assets have lost their vitality," but rather a sign that "the market is mature enough to absorb institutional funds without collapsing."
The cycle has not ended; it's just that the "cost" of driving market volatility has become higher.


