

The prices of the majority of the coins are falling today, according to CoinStats.
BTC/USD
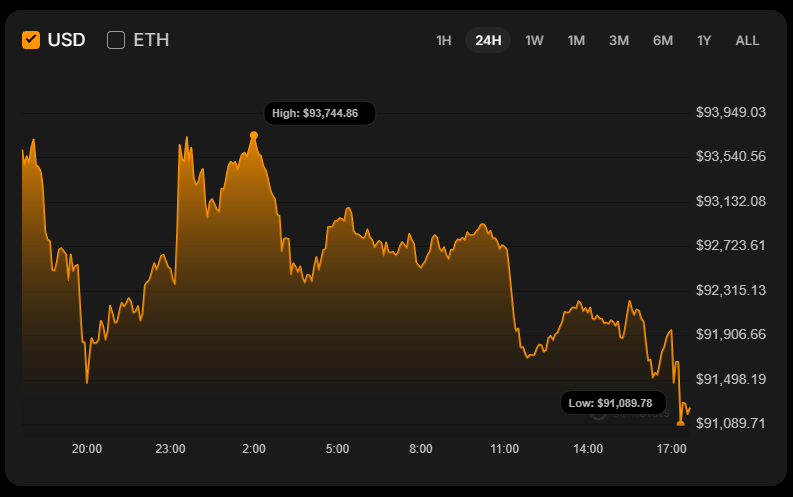
The rate of Bitcoin (BTC) has fallen by 2.37% over the last day.
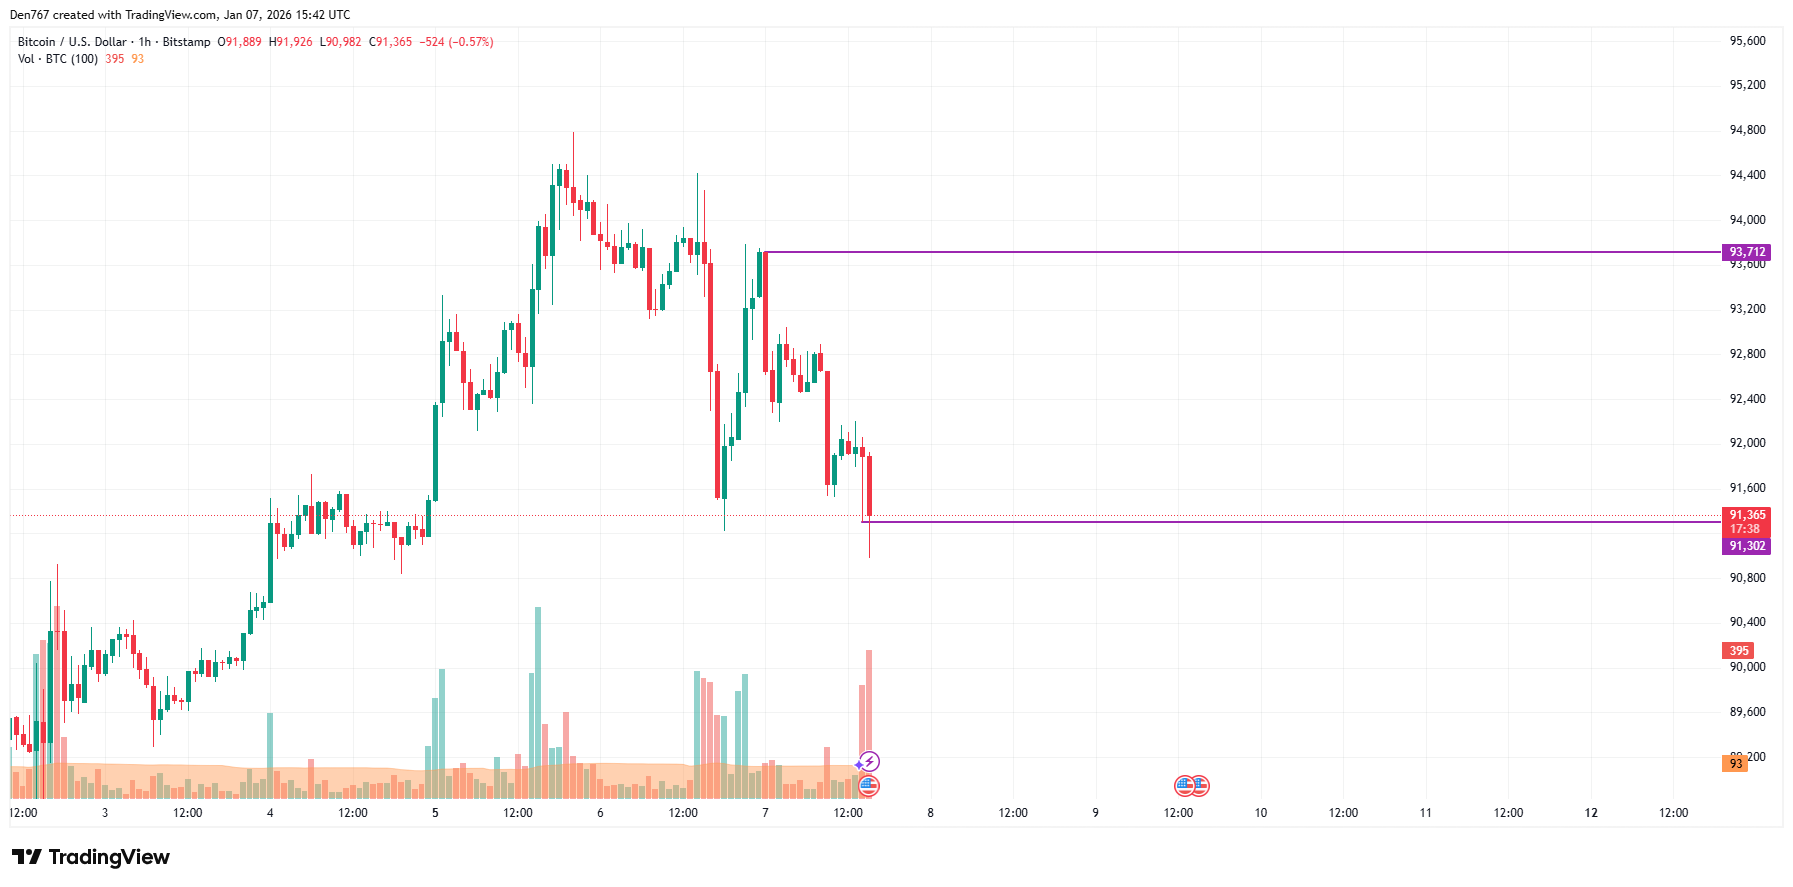
On the hourly chart, the price of BTC keeps looking bearish. If the rate fixes below the local support at $91,302, traders may see a test of the $90,000 zone soon.
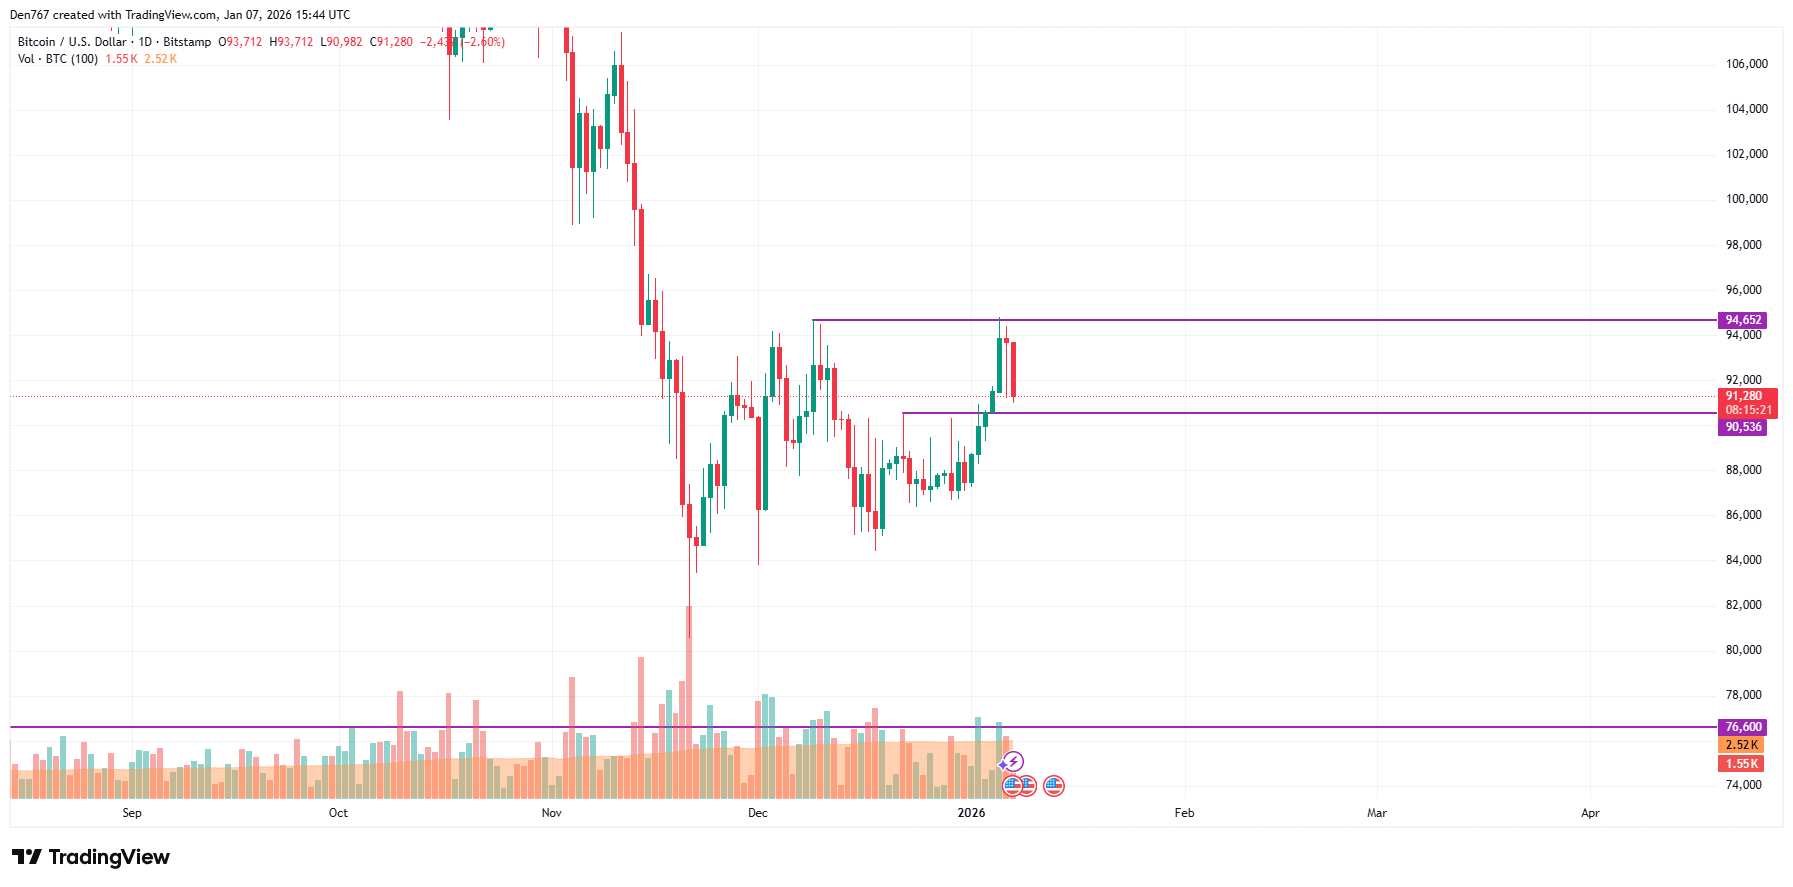
On the bigger time frame, the decline of the main crypto continues after a false breakout of the resistance at $94,652. At the moment, one should focus on the nearest level at $90,536.
If the candle closes below it, the accumulated energy might be enough for a move to the $89,000-$90,000 zone.
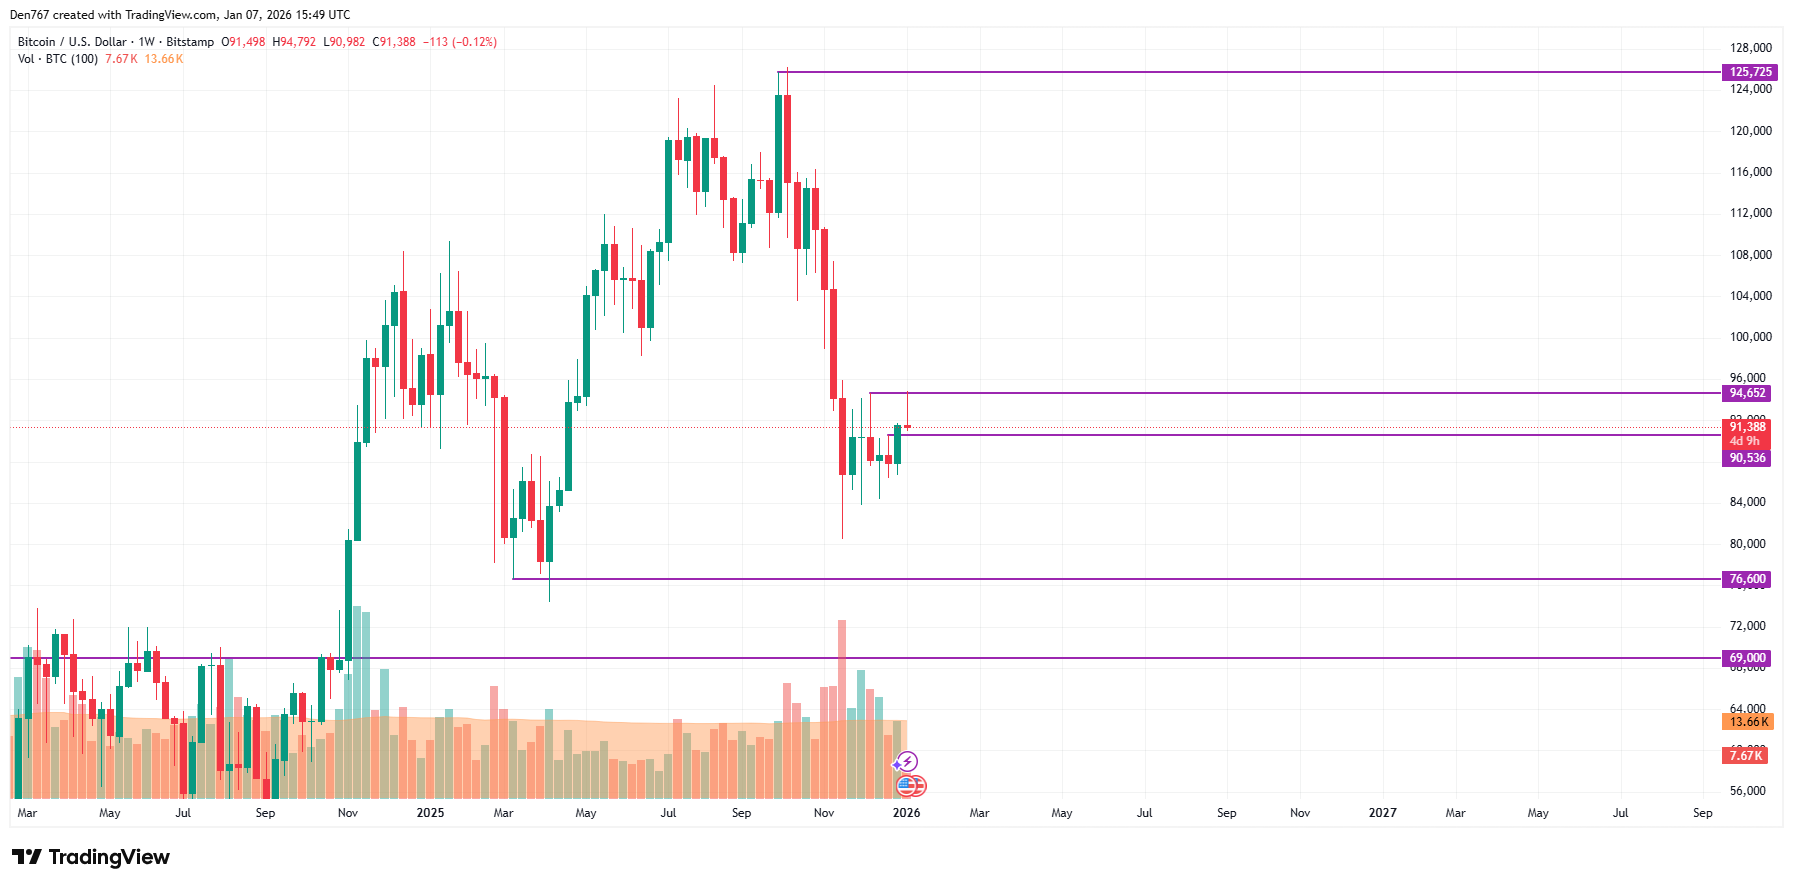
From the midterm point of view, the price of BTC has bounced off the resistance of $94,652. If buyers cannot seize the initiative and the candle closes far from that mark, traders may see a further correction.
Bitcoin is trading at $91,445 at press time.


