

Shiba Inu tests the weekly Bollinger Band resistance, with positive short-term momentum, but faces key resistance ahead.
The Shiba Inu (SHIB) price chart for January 9 shows a modest 0.4% increase in the last 24 hours, with the price fluctuating between $0.000008509 and $0.000008827. Over the past week, SHIB has experienced a more notable 17.2% increase, signaling a short-term rebound and positive momentum.
In contrast, its performance over the last 14 days shows an even stronger 22.0% rise, reflecting an optimistic shift in the market sentiment towards Shiba Inu. This recent performance suggests that the token is recovering from its prolonged downtrend, although it still faces resistance at key levels.
The current price action, with a slight upward movement in the short term, signals that the token might be preparing to break further resistance. Can SHIB test further resistance?
Where’s Shiba Inu Headed?
The latest weekly Shiba Inu price chart shows that the crypto is currently testing the middle Bollinger Band, which is a key support level. The middle band acts as the 20-period simple moving average, and its positioning around $0.00001006 has become a significant focal point for traders.
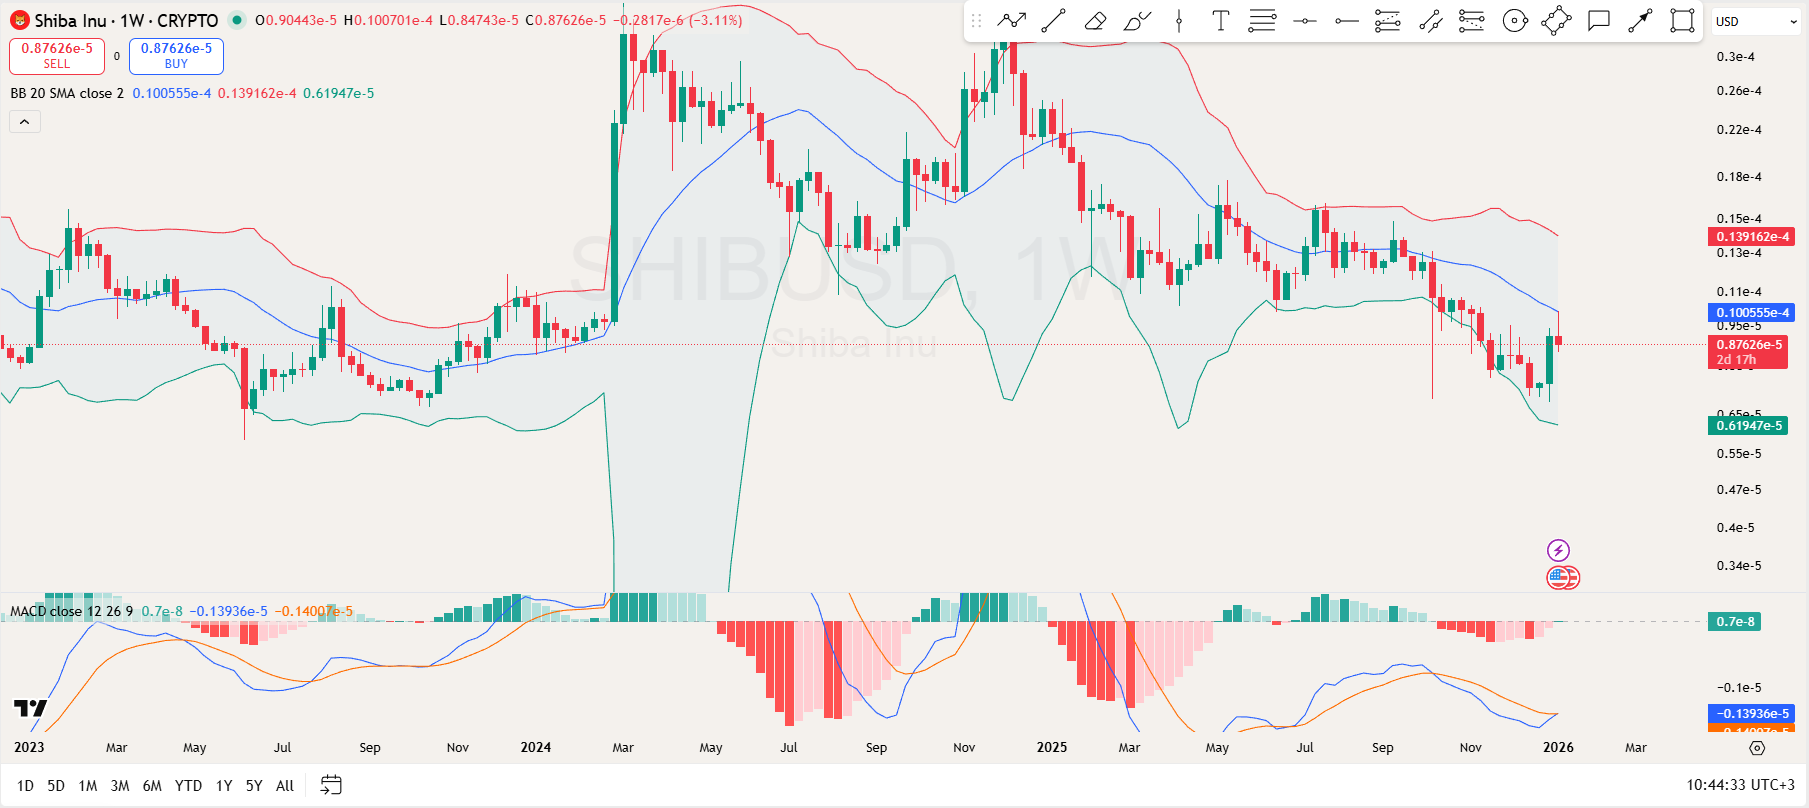
If the price manages to push above this level, it suggests potential continuation within the existing range. However, if the price closes below the middle band, it could indicate that SHIB will move towards the lower Bollinger Band, which serves as a strong support zone near $0.000006194.
In terms of resistance, the upper Bollinger Band at $0.00001392 represents the current resistance level. This area has held up in the past, capping the price during bullish moves.
Additionally, the MACD indicator shows a slight bearish divergence, as the signal line remains above the MACD line, suggesting potential downward pressure if the price fails to break above the immediate resistance level.
With the price testing the middle band, traders will closely monitor for a break above the middle or a bounce off this level to confirm whether SHIB will continue upwards. The MACD line must also cross above the signal line for a bullish confirmation.
Shiba Inu Futures Flow
Meanwhile, the SHIB futures flow data provides insight into the recent market behavior and investor sentiment. Within the 30-minute timeframe, the inflow turned negative, resulting in a $ 22.92K outflow, which represents a 134.80% decrease.
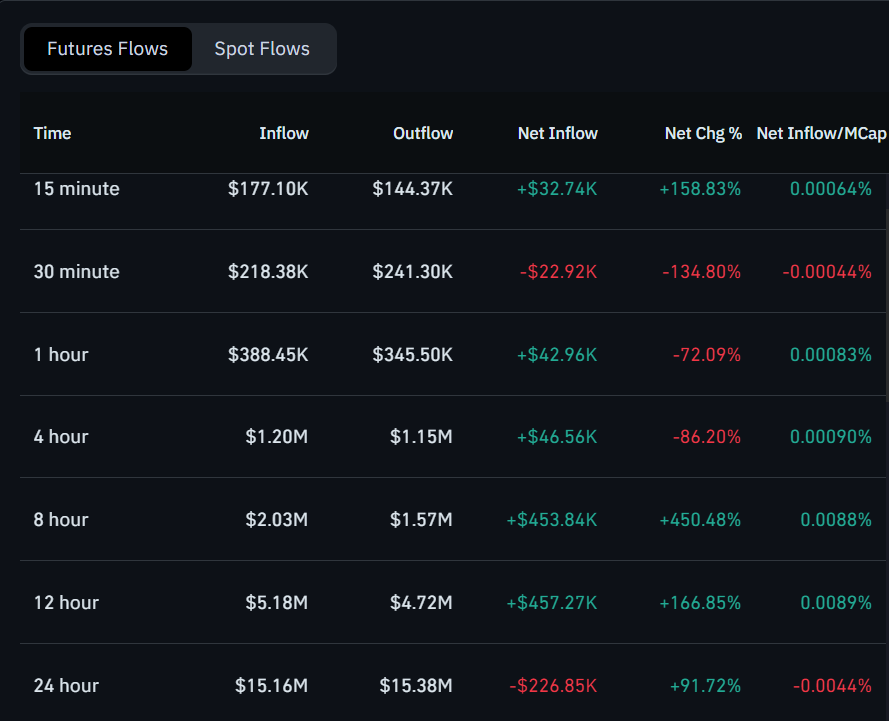
On a larger scale, the 1-hour, 4-hour, and 8-hour periods show consistent positive inflows, particularly the 8-hour timeframe, which recorded $453.84K in net inflows (+450.48%). This indicates growing interest in SHIB futures, suggesting confidence in the token’s price action over the medium term.
Despite this, the 24-hour period saw negative net inflows, with the $226.85K outflow indicating a possible cooling off. However, this period showed a modest +91.72% change in net inflow.


