

XRP could be poised for an impulsive move to new all-time highs as a similar bullish crossover that sparked the November 2024 and July 2025 rally remerges.
Notably, this reemergence could alter the current bearish trajectory of XRP. The asset has struggled to sustainably trend higher, as a 12% drop to $2.11 has followed its 30% rally in the first few days of 2026 to $2.41.
Aligning Bullish Pattern for XRP
However, Cryptadian highlighted in a January 8 TradingView analysis that history could repeat for XRP. He shared that the same bullish development that contributed to the November 2024 and July 2025 surge is forming.
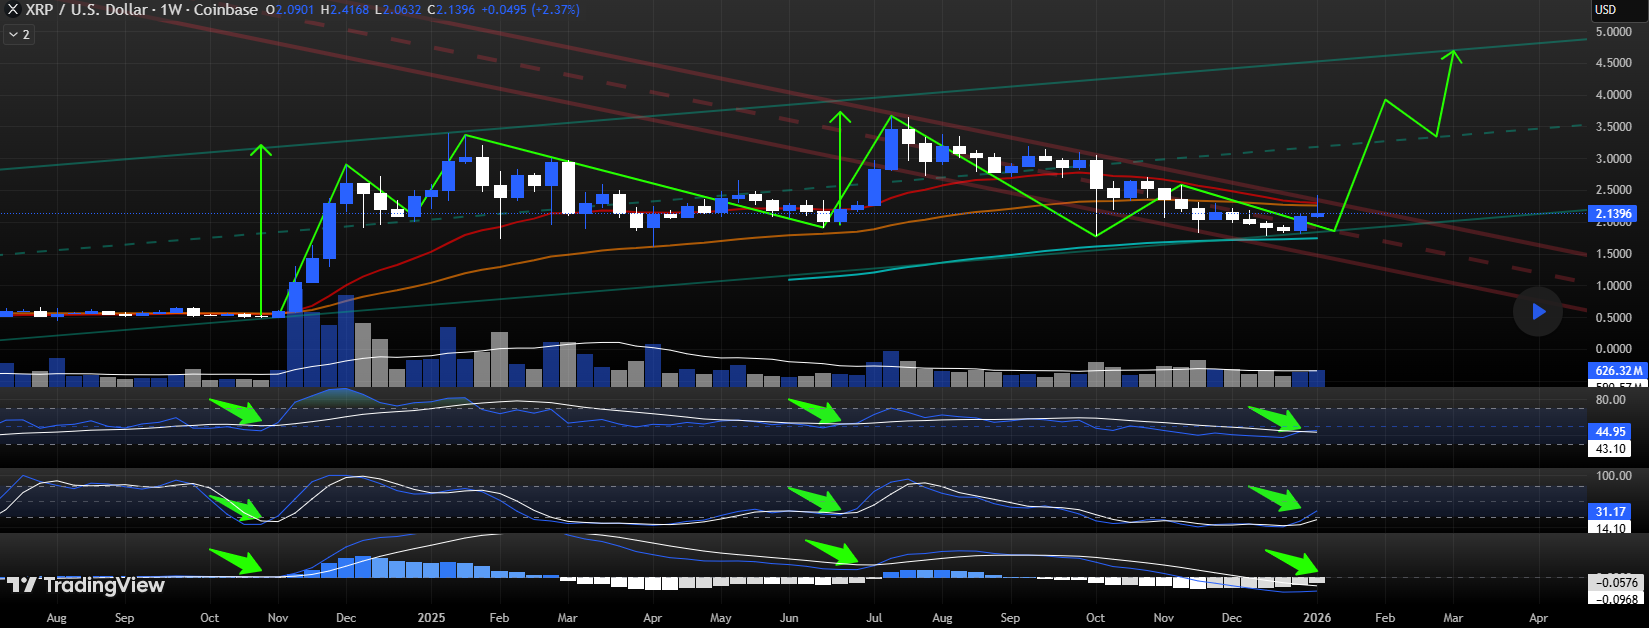
For context, he identified that three crucial oscillators are simultaneously crossing over on the weekly chart. This is not just a mere cross; they’re aligning with the market conditions seen when XRP rallied nearly 400% and 64.5% in a few weeks.
A shared chart shows an RSI crossing. While an RSI typically does not cross, this often occurs when the weekly RSI is applied to a moving average. It also happens when the standard RSI (14-period RSI) is compared to another RSI with a different length.
MACD and Stochastic RSI Crossover
Meanwhile, his chart also identified a bullish Stochastic RSI crossover. Notably, this involves a crossover between a faster line (%K) and a slower line (%D), which is the moving average of the %K.
On the weekly chart, the %K, currently at 30.73, crossed over %D at 13.9, signaling a bullish momentum swing.
Additionally, an MACD crossing is also imminent. The red bars are receding, showing bearish momentum exhaustion. The MACD and signal lines are also converging, hinting at an imminent crossover.
Recent History Says a Move Up
The analyst highlighted that when these three oscillators simultaneously cross over on the weekly timeframe, recent history says an uptrend is next. Interestingly, these same crossovers on all three indicators preceded the November 2024 rally from around $0.50 to $2.35.
A similar scenario played out in July 2025, with XRP moving from an opening price of $2.2 to a yearly high of $3.67. Notably, this scenario could recur, potentially taking the asset to unprecedented prices.
Meanwhile, the analyst predicted that a repeat could see XRP break out of a descending channel and reach new all-time highs. XRP has been trending within this wedge since its July 2025 peak. Most recently, it revisited the channel’s top earlier in the week but faced severe selling pressure, sparking the recent reversal.
Remarkably, XRP also trades within a broader ascending channel and dumped to its lower support trendline with its late 2025 correction. If history repeats, XRP could rally to the top of the channel, aligning with a new ATH of $4.7.


