

Bitcoin's price is currently at a critical juncture after a minor correction. Since peaking on January 5, 2024, BTC has declined slightly but hasn't experienced a sharp drop. Compared to the same period last year, Bitcoin is still down about 4.5%, maintaining a somewhat negative year-on-year performance.
This small negative number is actually very important. A relatively narrow price range is currently separating Bitcoin from a historically rare signal – the last one appearing in 2020. Whether Bitcoin can reverse at this point will determine the next trend.
A 4.5% price fluctuation in Bitcoin could repeat the rare pattern of 2020.
A recent historical analysis has revealed a rare pattern. When the price of Bitcoin changes from negative to positive within a year , it often signals a major trend reversal. This occurred in July 2020, followed by a period of strong growth.
Currently, Bitcoin is fluctuating just below that reversal threshold. A further increase of around 4.5% would turn year-on-year in the green, repeating this historical pattern.
The chart structure also illustrates how important this is. Bitcoin is trading within the “handle” of a cup and handle pattern, a bullish pattern where the price corrects slightly after a rounded recovery phase, before attempting a strong breakout.
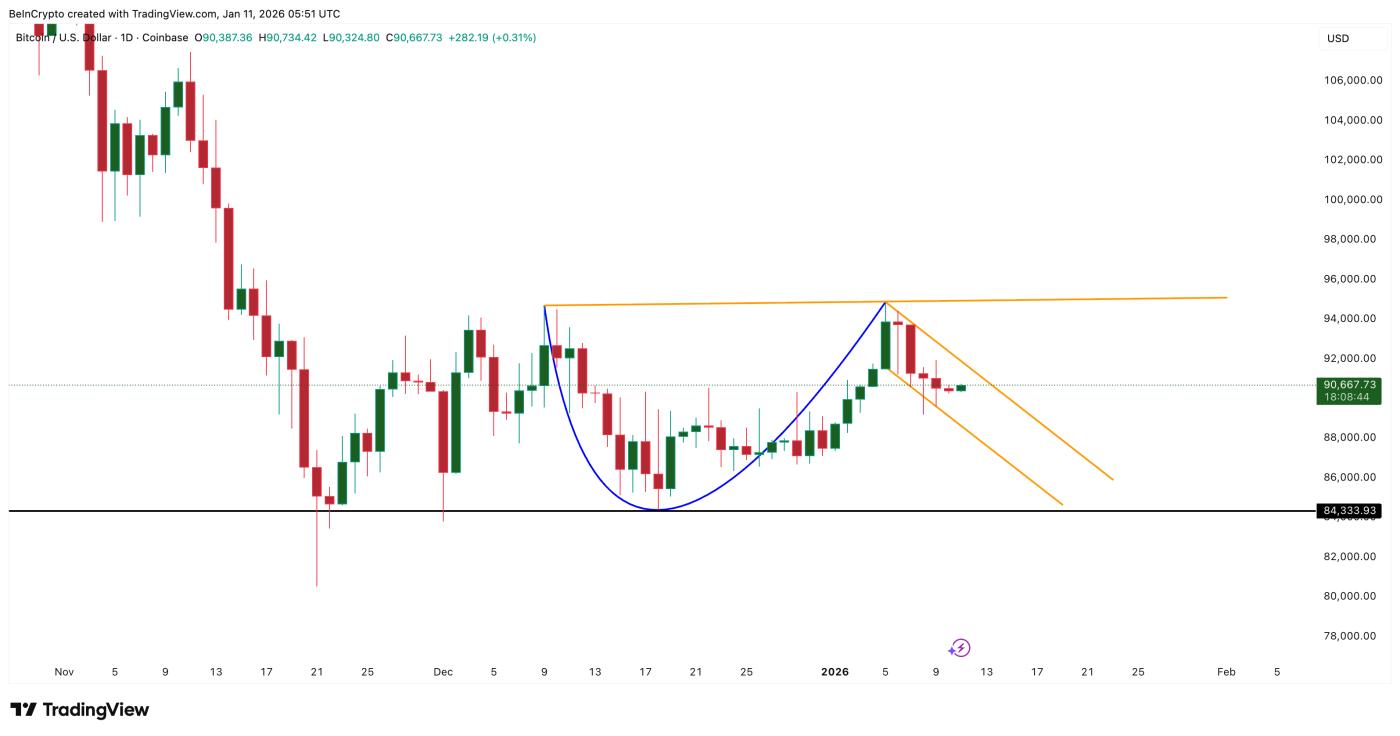 The breakout pattern remains intact: TradingView
Want more Token analysis like this? Sign up for Editor Harsh Notariya's Daily Crypto Newsletter here .
It's also noteworthy if the expected price increase upon a breakout from this pattern (beyond the neckline) coincides with the 4-5% upward range mentioned above?
EMA support and reduced selling pressure (95%) reinforce the trend.
Short-term trends further reinforce the bullish scenario.
The Exponential Moving Medium (EMA) helps reflect the short-term direction of the market by favoring the most recent price. Currently, Bitcoin has just regained and maintained above its 20-day EMA. The last time BTC crossed back above the 20-day EMA was in January 2024, when the price increased by nearly 7% in just a few days.
When the 20-day EMA was broken in mid-December, the price corrected downwards by approximately 6.6%. This shows that Bitcoin is very sensitive to this area. Currently, maintaining above the 20-day EMA is a key factor in sustaining the upward price momentum.
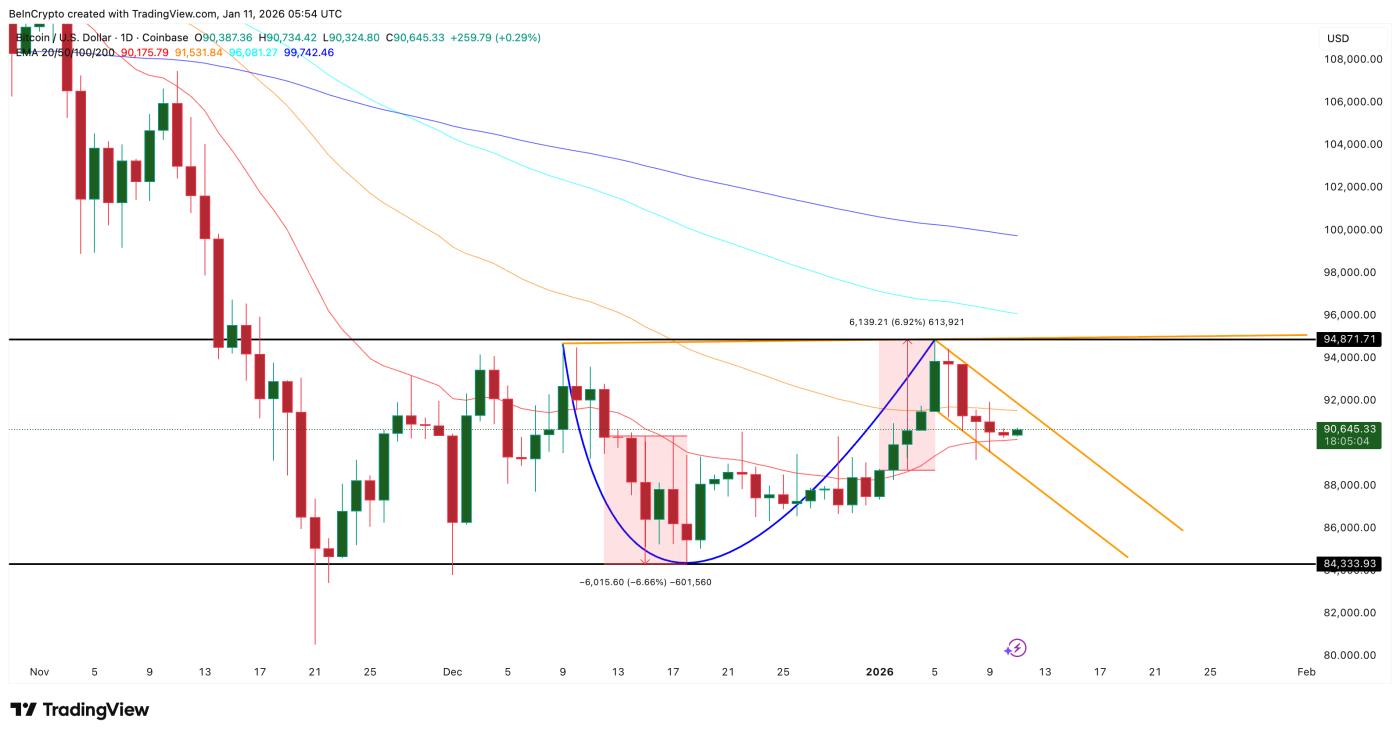 EMA is providing strong support for BTC: TradingView
The next level BTC needs to conquer is the 50-day EMA. Bitcoin lost this area on January 12, 2024, and immediately corrected downwards. If it successfully regains this level, it will be a positive signal for a trend recovery and align with the cup and handle breakout pattern.
on-chain data also shows positive signs. The amount of Bitcoin being transferred to exchanges – an indicator of selling intent – has fallen to its lowest level in six months. The daily volume of BTC deposited to exchanges has plummeted, from approximately 78,600 BTC (on November 21, 2023) to around 3,700 BTC currently, a decrease of over 95%.
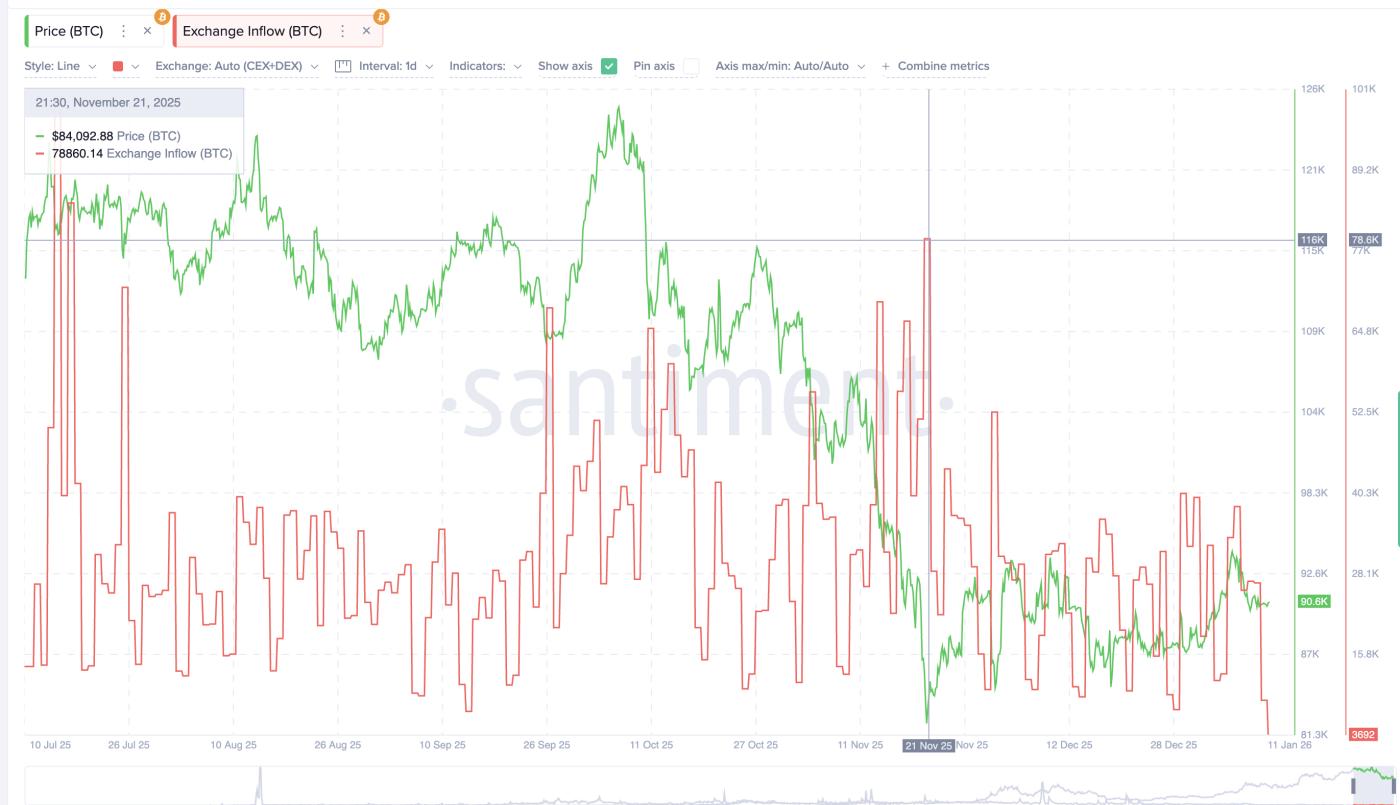 Selling pressure shows signs of easing sharply: Santiment
This sharp drop indicates that selling pressure has almost completely subsided. The number of coins being transferred to exchanges is decreasing, and the supply available for sale during each recovery is also declining, helping to keep the price more stable.
Pressure from Derivative and key Bitcoin price levels will determine the next trend.
Leveraged positions also reveal some interesting things.
Over the next 7 days, the total volume of Short selling positions is expected to accumulate to nearly $4.10 billion, while Longing buying positions will only be around $2.17 billion. Thus, Short positions will significantly outnumber Longing positions by approximately 89%.
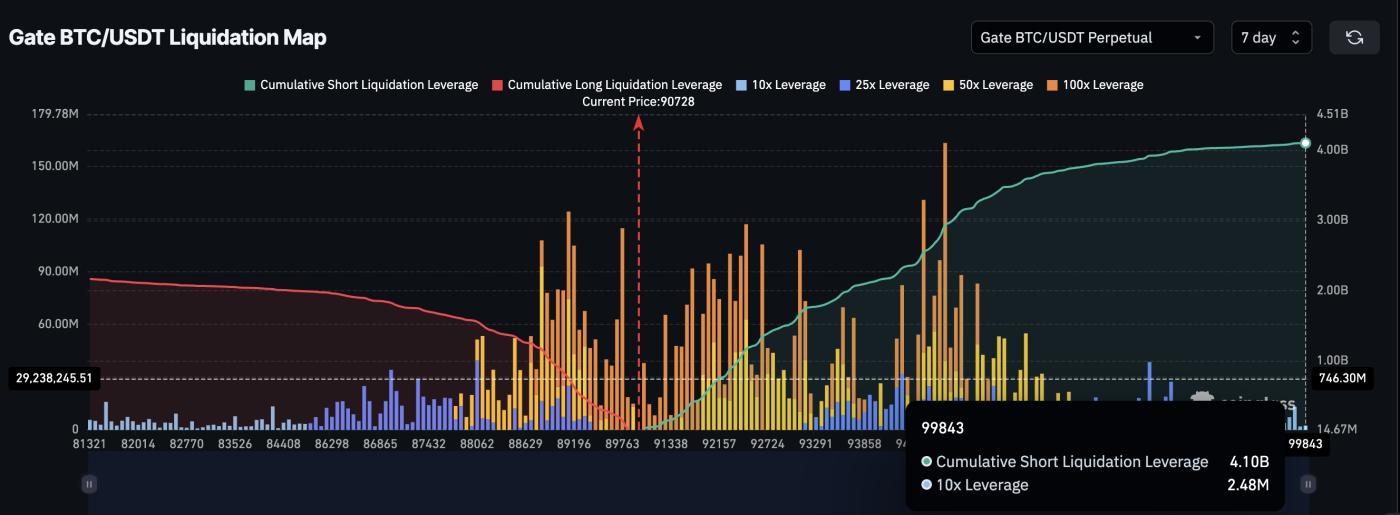 Liquidation map: Coinglass
When too many investors lean towards Short, the market will have the impetus for a strong " Short squeeze" if the price of BTC starts to rise. This will trigger automatic buying as Short positions are closed. Throughout the past year, Bitcoin has often tended to surge whenever the market Short more towards Short , so this current divergence could be a positive rather than a negative signal.
All of this data centers around a few key current market price levels.
A daily close above $94,880 would complete the cup and handle pattern and coincide with a 4.5% year-on-year increase. From there, the next upside targets are around $99,810, followed by $106,340 based on Fibonacci extension levels and predictions after the price breaks out of the cup pattern.
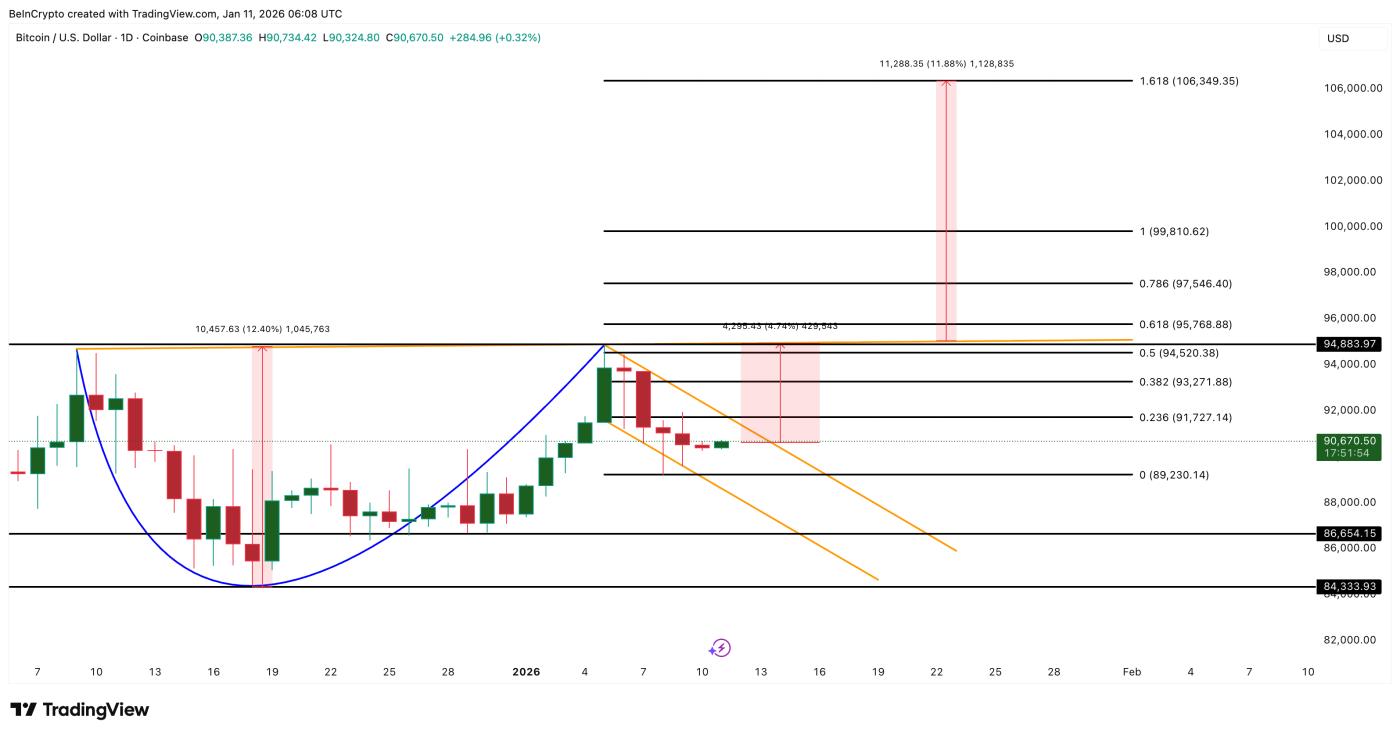 Bitcoin Price Analysis: TradingView
On the downside, the $89,230 level is the first key support. If the price falls below this level, Bitcoin could drop to the $86,650 area and break the current bullish structure.
Currently, the price of Bitcoin is fluctuating within a fairly narrow range.
Selling pressure is at its lowest level in six months, the short-term uptrend remains intact, and it is only 4.5% away from the rare historical high. Whether Bitcoin reaches this level could determine the market's next move.


