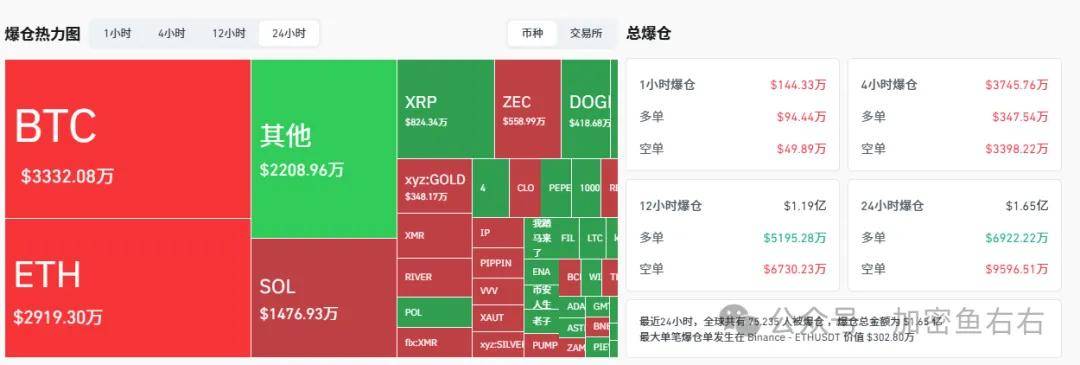
In the past 24 hours, a total of 75,226 people worldwide have been liquidated, with a total liquidation amount of $165 million! Monday saw increased volatility, so please be patient during the day. The current trend is at a critical point between bullish and bearish on the 2-hour chart, while the 1-hour/15-minute chart shows strong bullish momentum. We will not short. Weekend liquidity is at its lowest level in nearly a month, and the demand for renewed upward movement this week is gradually increasing.
Those who had a base position in BTC/ETH last week should continue to hold it, as long as it doesn't hit your break-even stop loss! This was something we repeatedly emphasized last week!
BTC
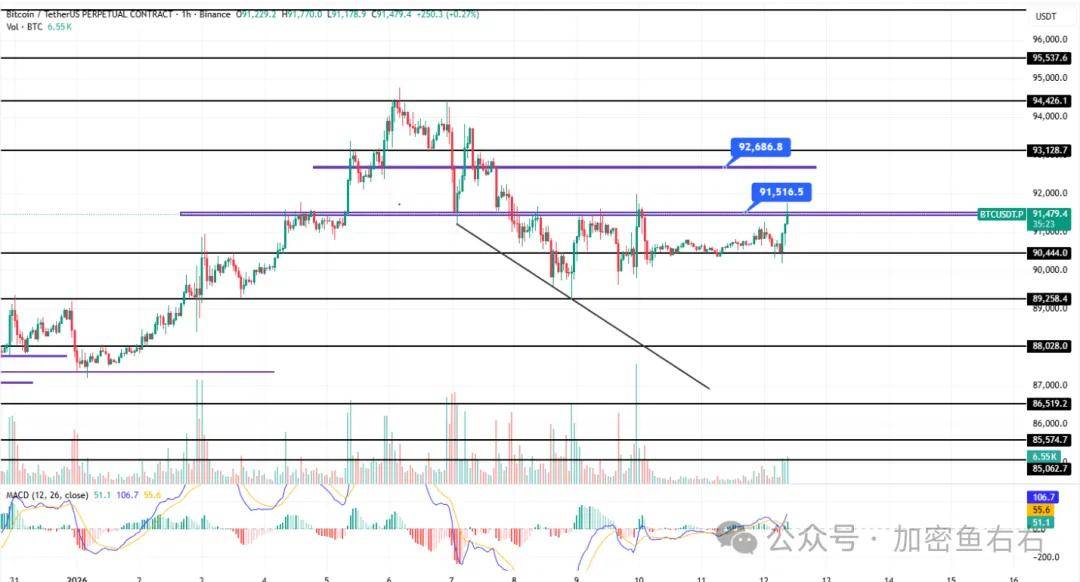
BTC closed with a green candle candlestick with upper and lower shadows this morning, forming a bullish engulfing pattern with yesterday's bearish candlestick. It has been trending upwards throughout the day, fluctuating narrowly around 9.04-9.15 for nearly 5 days. In reality, the market has entered a narrow range with limited profit potential. For intraday trading, it's best to take profits quickly and not linger too long.
(1) The upper resistance levels are 9.26 and 9.44. Today, the resistance for BTC is 91750-92400. If it breaks through 92650, the target is 93850-94250.
(2) The effective support levels below are 9.04 and the previous low of 8.92. If these levels are not broken, the next target is 94,000.
ETH
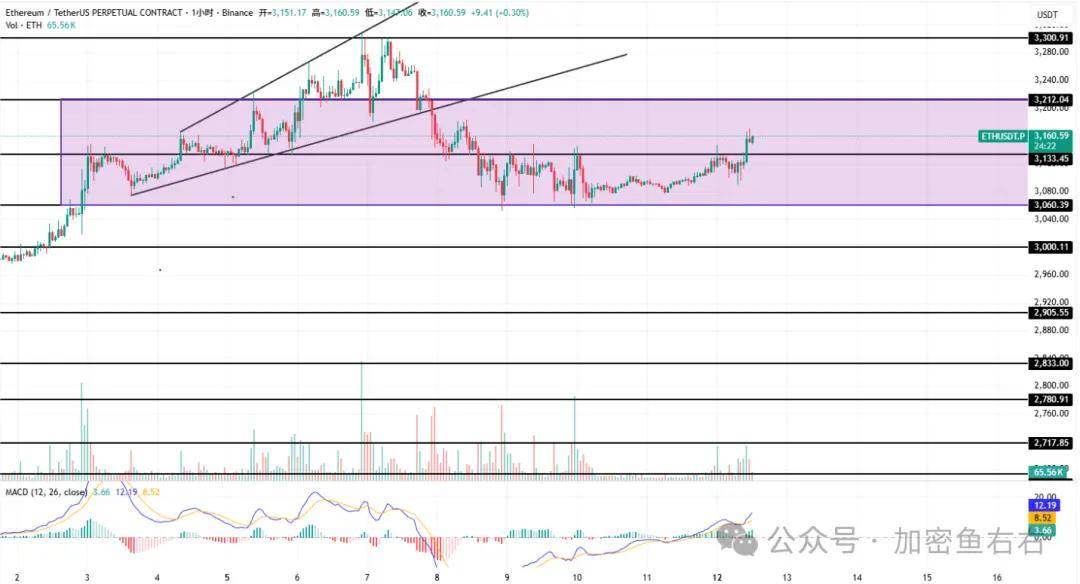
ETH has been fluctuating within a narrow range of 3133-3060 for several days. This morning's green candle broke through the minor resistance at 3133, with further resistance levels at 3212 and 3300. Downside support remains at 3060 and 3000.
Short at 3212 on the left, add to the position at 3300, stop loss at 3415, target 3124 and around 3060. After adding to the position, adjust the stop loss and exit the market in batches according to your average price.
If the price breaks below 3133, short; conversely, go long at 3060 with a stop-loss at 3000, targeting 3133 and around 3180.
This week has a lot of information to share, including multiple points:
Monday (January 12): The risk of another US government shutdown at the end of the month has increased; Japan's markets are closed.
Tuesday (January 13): A flurry of statements from Federal Reserve officials, Morgan Stanley earnings report, and December CPI year-on-year growth;
Wednesday (January 14): Fed Wedge Book, November PPI and retail sales data;
Thursday (January 15): US December retail sales month-on-month, BlackRock annual report, Goldman Sachs annual report.
BCH
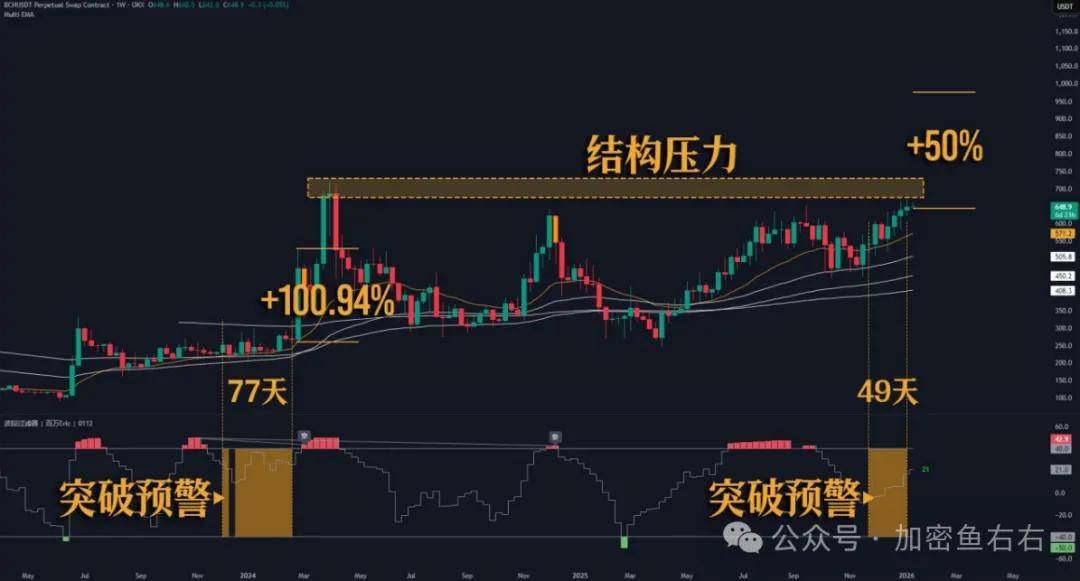
BCH's weekly chart shows a breakout warning. The last time a similar signal appeared, it held for 77 days before a single weekly candlestick surged 100%. This time, it's been building momentum for 49 days, and the structure is almost complete. Now it's up to BTC to take the lead. If market sentiment picks up, BCH will likely follow suit. A conservative estimate is a 50% upside, which isn't unreasonable. Time to make some wishes!
LISA
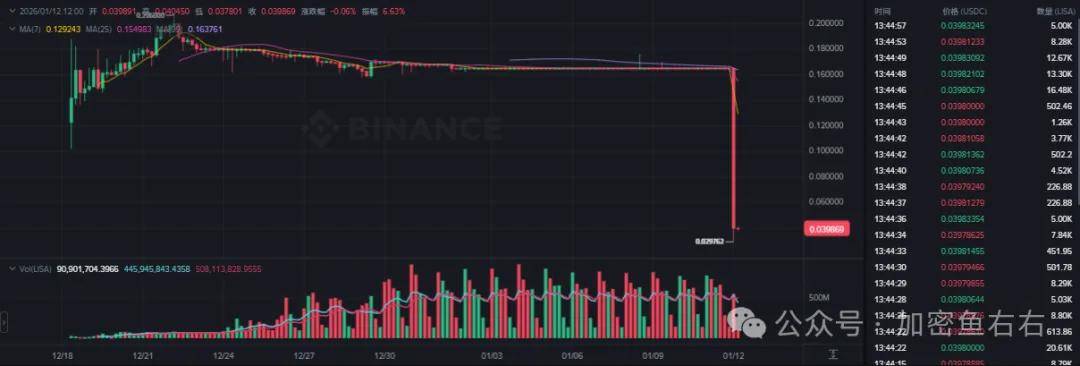
LISA crashed, dropping over 90% in 30 minutes. LISA's 4x points bonus ends next week, and the big players have already reaped the rewards. Market makers deliberately kept the price around 0.165 to allow a large number of alpha workers to generate liquidity, and then picked an auspicious day to harvest the profits.
Since the 4x points system was launched, this approach has become a money-making scheme for project developers. It operates on a 30-day cycle; if one platform collapses, another immediately takes its place. Everyone must be vigilant and withdraw as soon as the hype dies down. Don't wait until it's too late to cut your losses.
ZEC
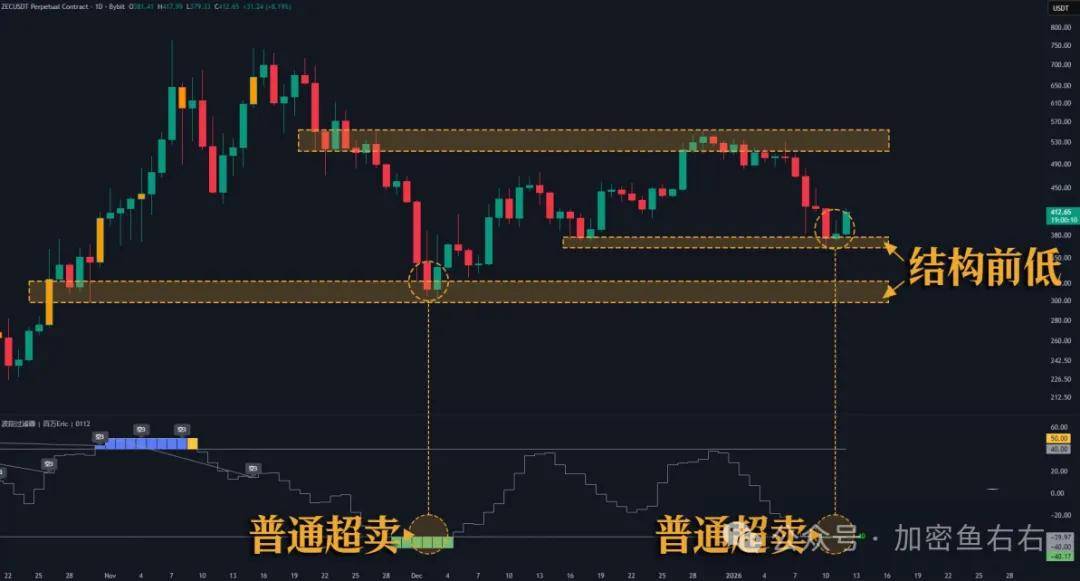
ZEC is oversold on the daily chart, and the price has touched a previous low. Given these signals, a rebound should be considered. However, the development team has reportedly absconded, raising concerns about fundamentals. In situations like this, technical analysis can be ineffective; for now, it's best to wait and see.
Short-term support is at 349.5~335.9~313.2 (1:1:2 ratio for quick entry and exit, can be split or combined); short-term resistance is at 431.3~458.5; second support is at 270~242 (not within the current range, but can be placed as a stop-loss order).
CAI
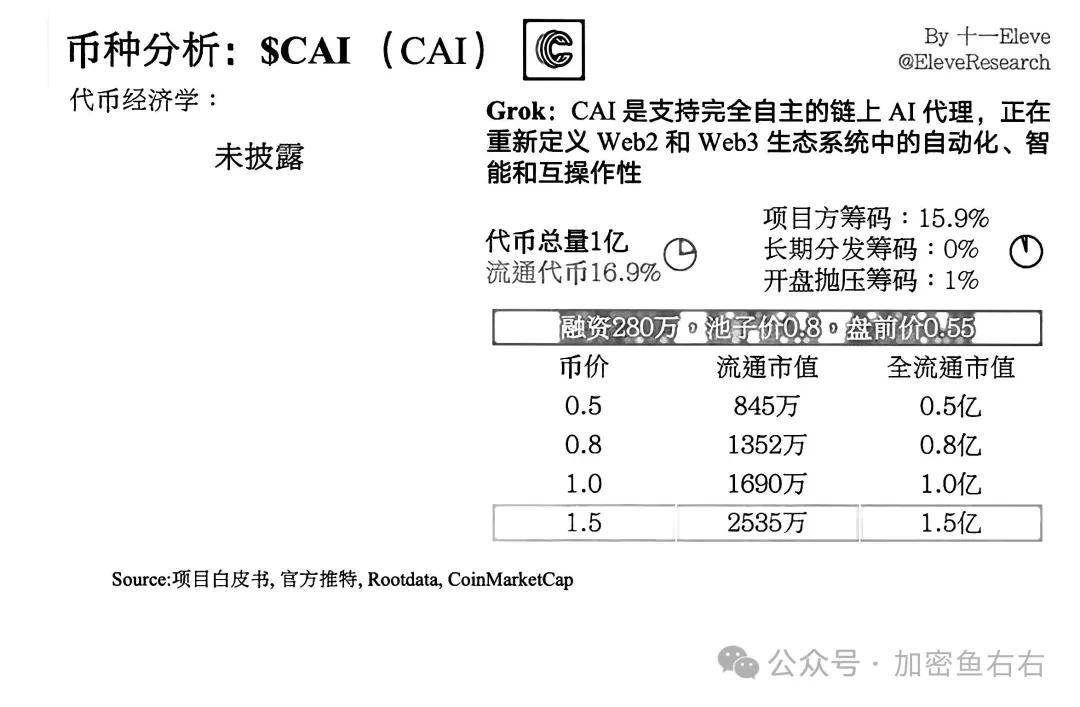
Total supply: 100 million; initial circulating supply: 16.86%; pool price: 0.8; pre-market price: 0.55.
Positive factors: 1. Official Twitter states over 30 million monthly active users and accumulated revenue of 18 million. 2. No clear external funding sources.
Negative factors: 1. Projects from the previous cycle remained inactive throughout last year, and community feedback indicates the app is no longer usable. 2. Project transparency is extremely low. 3. Disclosed information has low credibility and lacks any verifiable channels.
If a project isn't pumped up on Binance, it's generally difficult to break even. This project isn't great overall, but it gives the impression of being terrible yet capable of soaring! So, you could play around with a small amount when it opens at around 35 USDT, but don't be too ambitious. The project is unreliable, so whether it will pump or dump depends entirely on the project team. Just follow the market trend to make money.
The market is constantly changing, so entry and exit points should be determined based on real-time conditions. Follow the trend after a breakout! No matter how confident you are, please strictly adhere to your stop-loss and take-profit strategies! That's all for today! Follow me so you don't get lost!
Every market crash is followed by a golden opportunity. Those unsure about future market strategies can follow Sweet Dream (or add WeChat: RFGH8689).