

"When dollar liquidity expands, Bitcoin and the Nasdaq index will rise."
Written by: Arthur Hayes
Compiled by: Saoirse, Foresight News

The deities I worship are all represented by adorable plush toys. Every year from January to February, during Hokkaido's peak ski season, I pray to "Frowny Cloud"—the goddess who controls snowfall. The unique local climate means that during the peak snow season, the sky is always shrouded in clouds, with almost no sunshine. Fortunately, I also pray to the deity who controls vitamins (whose manifestation is a cute little pony 🐴), who provides me with the necessary supplements such as vitamin D3 tablets.
While I love snowfall, not all snow is good or safe. The kind of unrestrained, exhilarating skiing I enjoy requires a specific type of snow. Low winds and temperatures between -5°C and -10°C at night are prerequisites for ideal snow accumulation. This allows newly fallen snow to combine tightly with the old snow, forming deep, soft powder. During the day, cloudy skies block some wavelengths of sunlight, preventing south-facing slopes from melting under direct sunlight and thus reducing the risk of avalanches.
Sometimes, "gloomy clouds" will "abandon" us brave skiers at night. On cold, clear nights, the snow undergoes a process of warming up and then cooling down, forming a layer of ice crystals. This creates persistent weak points in the snow layer. These weak points remain in the snow layer for a period of time, and once the skier's weight causes energy to be transferred, leading to the collapse of the weak layer, it can trigger a deadly avalanche.
As always, the only way to understand what kind of snow layers are created by "clouds of sorrow" is to study history. On a snow slope, we dig deep pits to analyze the types of snow that fell at different times. But this article is not about avalanche theory. In financial markets, we study history by analyzing charts and the interaction between historical events and price fluctuations.
This article aims to explore the relationship between Bitcoin, gold, stocks (specifically, the large-cap U.S. technology stocks that make up the Nasdaq 100 index), and dollar liquidity.
Those who are bearish on cryptocurrencies yet believe in gold, or those at the top of the financial world (adorned in luxury goods) who firmly believe that "stocks are suitable for long-term holding" (my GPA wasn't high enough to get into Professor Siegel's class at Wharton), are now jubilant that Bitcoin will be the worst-performing major asset class in 2025. These gold believers would scoff at cryptocurrency enthusiasts: if Bitcoin is truly, as claimed, a "tool of protest" against the existing order, then why hasn't it outperformed or even surpassed gold?
Those who champion fiat currency stocks also mock cryptocurrency enthusiasts: they claim that Bitcoin is nothing more than a high-beta Nasdaq stock, which it won't even achieve by 2025; so what reason is there for cryptocurrencies to be included in an investment portfolio?
This article will present a series of charts with my personal insights to interpret the background of these asset price linkages. In my view, Bitcoin's performance is entirely in line with its "characteristics"—it falls as fiat currency (especially the US dollar) liquidity declines because the credit pulse brought about by "Pax Americana" (a state of relative stability and reduced conflict in the global or specific region under the US-led international order) in 2025 will be the most important factor influencing the market.
The surge in gold prices is due to sovereign nations that are less sensitive to price being hoarding gold: they are concerned about the safety of holding US Treasury bonds, given that the US froze Russian bonds in 2022, and recent actions against Venezuela have further exacerbated concerns about dollar assets, leading many to choose gold as an alternative to US Treasury bonds as a reserve asset.
Finally, the artificial intelligence (AI) bubble and all the related industries that benefit from it will not disappear. In fact, US President Trump must increase government support for AI-related industries because AI is the biggest driver of US GDP growth. This means that even if the growth rate of dollar issuance slows, the Nasdaq index can continue to rise because Trump has effectively "nationalized" the AI industry. Anyone who has studied the Chinese capital market knows that in the early stages of industry nationalization, related stocks often perform well, but as political goals take precedence over the return on equity for non-patriotic capitalists, these stocks eventually decline sharply.
If the price movements of Bitcoin, gold, and stocks in 2025 confirm my market model, then I will continue to focus on fluctuations in dollar liquidity. I would like to remind readers that my prediction is that the Trump administration will boost the economy by expanding credit. A booming economy will help the Republican Party increase its chances of re-election in November. This expansion of dollar credit will be achieved through three channels: expanding central bank balance sheets, increasing lending by commercial banks to "strategic industries," and lowering mortgage rates through "money printing."
Based on the above historical analysis, does this mean I can invest in newly acquired fiat currency assets with the same boldness as skiing on a slope, while maintaining extremely high risk exposure? The answer is left to the reader to decide.
One picture determines the fate
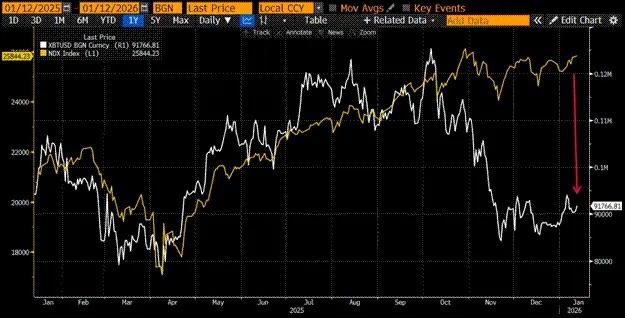
First, let's compare the returns of Bitcoin, gold, and the Nasdaq index during the first year of Trump's second term (2025), and the relationship between the performance of these assets and changes in dollar liquidity.
I will elaborate on this analysis later, but first, I'll present an assumption: if dollar liquidity decreases, the prices of these assets should also fall. However, in reality, gold and stock prices both rose, while only Bitcoin performed as expected—in a truly dismal way. Next, I will explain why gold and stocks were able to buck the trend and rise despite declining dollar liquidity.

Chart labels: Bitcoin (red), Gold (gold), Nasdaq 100 Index (green), US Dollar Liquidity (magenta)
Gold and jade on the outside
My cryptocurrency investment journey began with gold. In 2010 and 2011, as the Federal Reserve intensified its quantitative easing (QE) policy, I began buying physical gold coins in Hong Kong [1]. In absolute terms, I didn't hold many gold coins, but relative to my net worth at the time, it was a very high percentage. Ultimately, I learned a profound lesson in position management: in 2013, in order to conduct arbitrage trading on the ICBIT exchange, I had to sell my gold coins at a loss and buy Bitcoin instead.
Fortunately, things eventually came to a satisfactory conclusion. After all this, I still hold a significant amount of physical gold coins and bars in vaults around the world, and gold and silver mining stocks dominate my stock portfolio. Readers might wonder: since I'm a devoted follower of "Satoshi Nakamoto," why do I still hold gold?
The reason is that we are in the early stages of a global trend of central banks selling off US Treasury bonds and increasing their gold reserves. Furthermore, countries are increasingly using gold to settle trade deficits—a trend evident even in analysis of US trade deficit data.
In short, I buy gold because central banks around the world are buying gold. Gold, as the "true currency" of human civilization, has a history of tens of thousands of years. Therefore, if central bank administrators did not trust the current fiat currency financial system dominated by the US dollar, they would never choose Bitcoin as a reserve asset, but would (and are) choosing gold. If the proportion of gold in central bank foreign exchange reserves could return to the level of the 1980s, its price could rise to approximately $12,000. Before you question this seemingly far-fetched prediction, let me provide you with intuitive data to prove it.
In the fiat currency system, gold is traditionally considered an "inflation hedge," and therefore its price should roughly correlate with the Consumer Price Index (CPI) inflation data published by various countries. The chart above shows that since the 1930s, gold prices have generally moved in tandem with the inflation index. However, since 2008, and especially after 2022, the growth rate of gold prices has significantly exceeded the growth rate of inflation. Does this mean gold is in a bubble, and could it cause investors like me to suffer heavy losses?
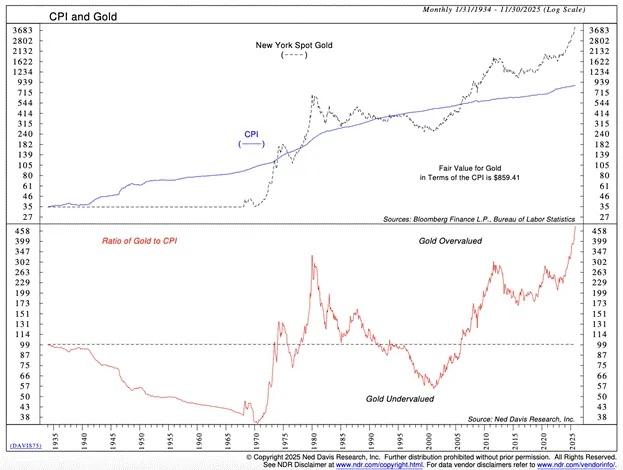
Analysis of the relationship between the US Consumer Price Index (CPI) and gold
If gold is truly in a bubble, retail investors will flock to it. The most popular way to trade gold is through exchange-traded funds (ETFs), with the SPDR Gold ETF (GLD US) being the largest [2]. When retail investors "go all in" on gold, the number of GLD shares in circulation will increase. To compare this phenomenon over time and across gold price cycles, we need to divide the number of GLD shares in circulation by the price of physical gold. The following chart shows that this ratio is decreasing rather than increasing—meaning that the real gold speculation boom has not yet arrived.
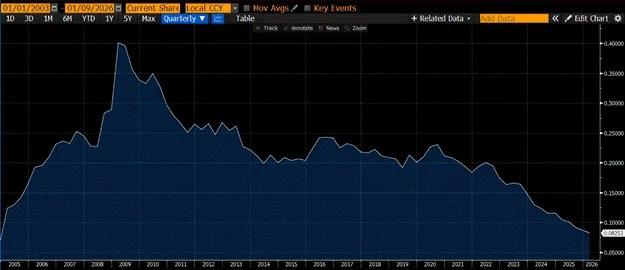
Chart caption: Ratio of GLD US outstanding shares to spot gold price
Since ordinary retail investors haven't driven up gold prices, who are these "price-insensitive buyers"? The answer is central banks around the world. Two key events over the past 20 years have made these "monetary stewards" realize that the US dollar is no longer a reliable reserve currency.
In 2008, US financial giants triggered a global deflationary panic. Unlike the 1929 financial crisis (when the Federal Reserve largely refrained from intervening in the credit contraction), this time the Fed abandoned its responsibility to maintain the purchasing power of the dollar and chose to "rescue" some large financial institutions by "printing money." This event became a "turning point" in the proportion of US Treasury bonds and gold held by central banks around the world—the proportion of US Treasury bond holdings reached its peak, while the proportion of gold holdings fell to its trough.
In 2022, a move by US President Biden shocked the world: he froze Russia's holdings of US Treasury bonds. It's important to understand that Russia not only possesses the world's largest nuclear arsenal but is also one of the world's largest exporters of commodities. If the US dares to infringe on Russia's property rights, it could easily take similar action against other weaker or resource-rich countries. Predictably, other countries were unwilling to increase their holdings of US Treasury bonds, fearing the risk of asset confiscation, and thus began accelerating their gold purchases. Central banks, as buyers of gold, are not price-sensitive: after all, if the US president orders the freezing of your assets, your loss will be 100%; in contrast, what does the cost matter when buying gold to hedge against counterparty risk?
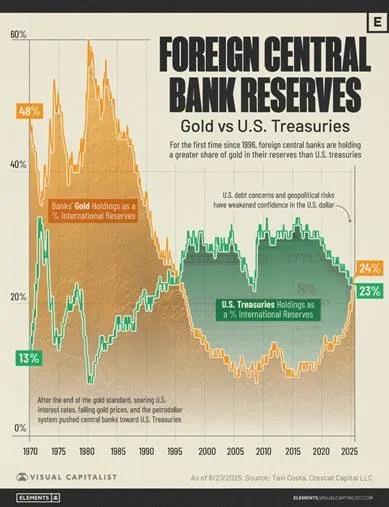
Foreign Central Bank Reserves: Long-Term Trends in Gold vs. US Treasury Bonds
The fundamental reason for the strong demand for gold, an "ancient asset," from sovereign nations lies in the increasing reliance on gold for settling global trade deficits. The record narrowing of the US trade deficit in December 2025 precisely demonstrates that gold is once again becoming a true global reserve currency—more than 100% of the changes in the US trade deficit stem from increased gold exports.
Data released by the U.S. Commerce Department on Thursday showed that the U.S. goods trade deficit fell 11% from the previous month to $52.8 billion. This deficit is not only the lowest level since June 2020, but also lower than the $63.3 billion forecast by economists surveyed by Reuters. From August to December, U.S. exports rose 3% to $289.3 billion, driven primarily by non-monetary gold exports; imports rose 0.6%.
— Source: Financial Times
The flow of gold is as follows: the United States exports gold to Switzerland, where it is refined and minted into ingots of various sizes before being shipped to other countries. The chart below shows that the main buyers of this gold are China, India, and other emerging economies—countries that are either adept at producing physical goods or are major commodity exporters. The goods produced by these countries ultimately flow to the United States, while the gold flows to more "productive" regions globally. This "productivity" doesn't refer to people in these regions being better at filling out tedious reports or using the correct gender pronoun in email signatures, but rather their ability to export energy and other key industrial commodities, and their ordinary citizens' ability to produce physical products such as steel and refined rare earth elements. The rise in gold prices against the backdrop of declining dollar liquidity is precisely because countries are accelerating the return to the global gold standard.
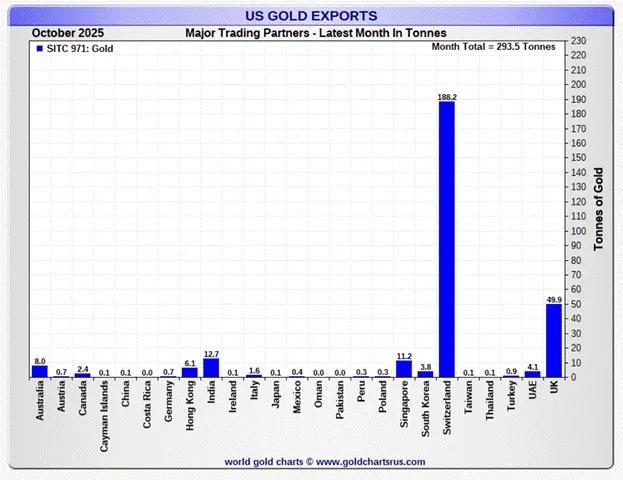
US gold export data for October 2025
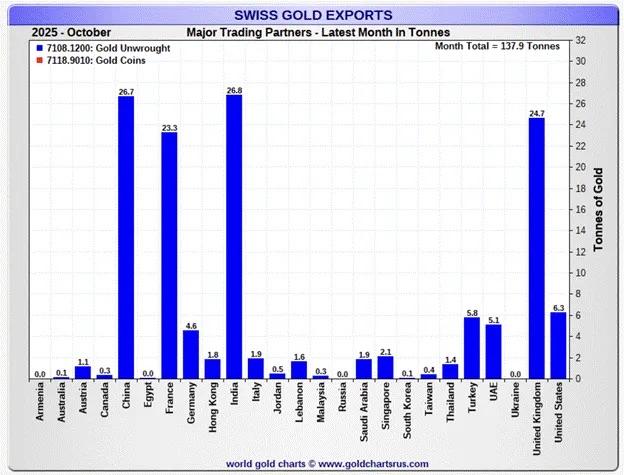
Swiss gold export data for October 2025
Long-term assets prefer liquidity
Every era has its hottest tech stocks. During the U.S. bull market of the 1920s, radio manufacturer RCA was a popular tech stock; in the 1960s and 70s, IBM, which produced new mainframe computers, was unparalleled; and today, artificial intelligence supercomputing companies and chip manufacturers are "at their peak."
Humans are inherently optimistic, always envisioning a bright future—as if the money tech companies are investing now will eventually create a social utopia. For those fortunate enough to "control the future" by holding shares in these companies, wealth seems to fall from the sky. To convince investors that this "bright future" is inevitable, tech companies are willing to burn through cash and take on debt. When liquidity is abundant (financing costs are low), betting on the future becomes easy—because people believe that these courageous entrepreneurs will generate substantial cash flow in the future. Therefore, investors are willing to invest "worthless" cash now to buy tech stocks, just to obtain even larger future cash flows, which also drives up the price-to-earnings ratio of tech stocks. Thus, it is evident that during periods of excess liquidity, the price of tech growth stocks often rises exponentially.
Bitcoin is a "monetary technology." Its value is directly related to the degree of devaluation of fiat currencies. The invention of Proof-of-Work (PoW) blockchain technology, which implemented a Byzantine fault-tolerant mechanism, is a significant breakthrough that alone is enough to ensure that Bitcoin's value is greater than zero. However, for Bitcoin's price to approach $100,000, continued devaluation of fiat currencies is needed. The surge in the supply of US dollars after the 2008 global financial crisis is the direct reason for the "asymptotic" rise in Bitcoin's price.
Therefore, my conclusion is:
Bitcoin and the Nasdaq index tend to rise when dollar liquidity expands.
The problem is that Bitcoin prices have recently diverged from the Nasdaq index.
I believe the reason why the Nasdaq index did not correct in 2025 despite the decline in dollar liquidity is that both China and the United States have "nationalized" the AI industry.
AI "tech gurus" have instilled in the leaders of the world's two largest economies the idea that AI can solve everything—it can reduce labor costs to zero, cure cancer, increase productivity, democratize creativity, and, most importantly, give a nation military dominance over the world. Therefore, no matter how vague the definition of "winning," whichever country "wins" in the field of AI will dominate the world.
China has long embraced this vision of the future of technology, which aligns closely with the top-down development model of the Chinese Communist Party's Politburo setting development goals through five-year plans. Chinese stock investors typically meticulously study each five-year plan and its annual revisions to determine which industries and related stocks will receive affordable government credit and preferential treatment in market competition.
In the United States, at least in this era, this kind of "policy-driven investment analysis" is still a novelty. Industrial policy is actually a "common choice" for both the US and China, just with different ways of promoting it. Trump has been captivated by the "charm" of AI, and now "winning in the field of AI" has become an important part of his economic policy. The US government has effectively "nationalized" all aspects of the AI industry that are considered related to "winning": through executive orders and government investment, Trump has weakened the free market signal, causing capital to flood into all AI-related fields regardless of actual returns on equity.
This is precisely why the Nasdaq index diverged from the price trends of Bitcoin and dollar liquidity in 2025, and even rose against the trend.
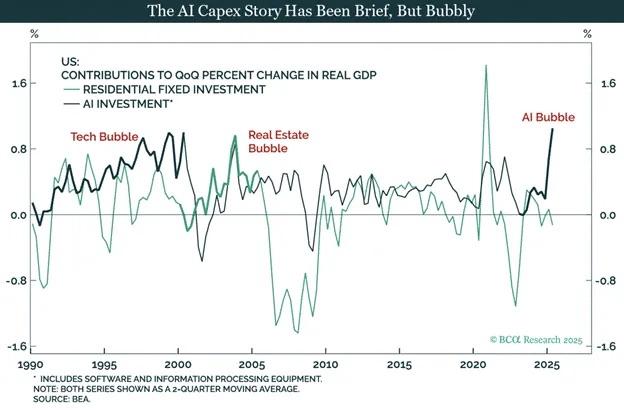
The Bubble Process of AI Capital Expenditure
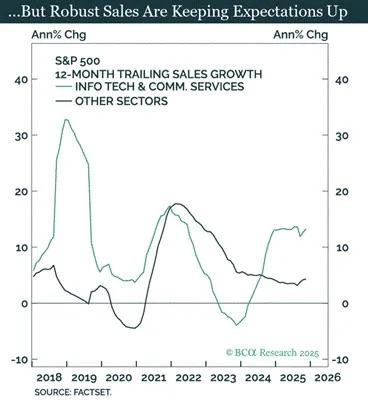
S&P 500 Sector Sales Growth Comparison: Technology/Communication Services vs Other Sectors
Regardless of whether a bubble exists, increased spending to "win the AI race" is driving U.S. economic growth. Trump campaigned on a promise to keep the economy "hot," so he's not going to stop now, even if future reviews show that these expenditures have a lower return on equity than the cost of capital.
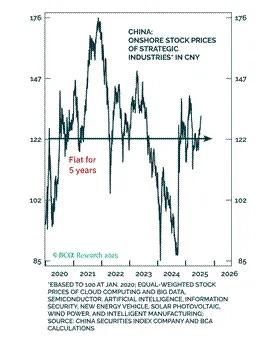
Stock prices of Chinese strategic industries (in CNY)
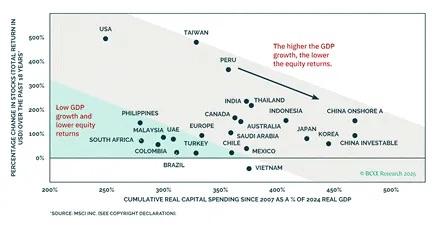
The Relationship Between GDP Growth and Stock Returns: A Comparison of Global Economies
US tech investors need to be cautious about their expectations. The US industrial policy aimed at "winning the AI race" could very well result in investors losing their capital. Trump's (or his successor's) political goals will ultimately clash with the interests of shareholders who view these "strategic companies." Chinese stock investors have learned this lesson the hard way. Confucius said, "Learn from history." But judging from the Nasdaq's outstanding performance, US investors have clearly not learned this lesson.
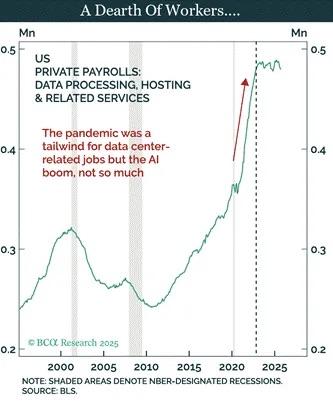
Changes in private employment in the US data processing/hosting industry
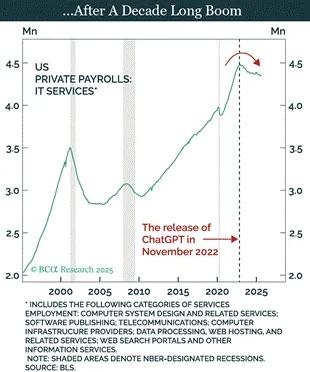
Changes in private employment in the US IT services industry
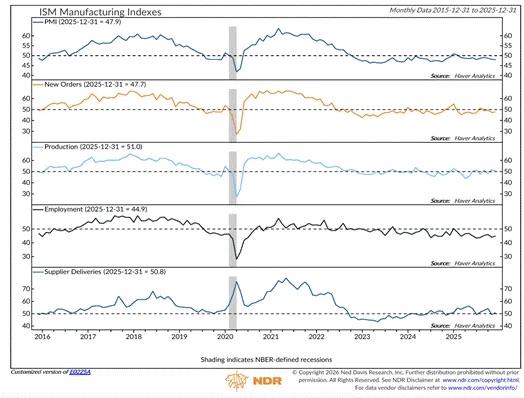
Trends of sub-components of the US ISM Manufacturing Index
Chart annotation: A value below 50 indicates economic contraction. GDP growth has not led to a recovery in the manufacturing sector.
Did I think Trump was a "representative of the white working class"? Don't be silly, my friend. Former US President Clinton "sold" your jobs to China; Trump may have moved factories back to the US, but now the factory floors are full of AI robots from Elon Musk. Sorry, you've been "fooled" again—but U.S. Immigration and Customs Enforcement (ICE) is still hiring![3]
These charts clearly show that the Nasdaq's rise is a result of US government "backing." Therefore, even with weak or contracting overall dollar credit growth, the AI industry will still have all the funding it needs to "win." This is why the Nasdaq diverged from my dollar liquidity index in 2025 and outperformed Bitcoin. I believe the AI bubble is not yet bursting. This "outperformance of Bitcoin" will be a "norm" in global capital markets until circumstances change—most likely a turning point, as Polymarket predicts, with the Democrats controlling the House of Representatives in 2026 and possibly even winning the presidential election in 2028. If the Republicans are "futuristic" (Jason 'n' Roll style), then the Democrats are "conservative" (The Flintstones style).
Given the current momentum of gold and the Nasdaq, how can Bitcoin regain its vitality? The answer is: dollar liquidity must expand. Clearly, I believe dollar liquidity will expand in 2026, and we will now explore the specific path forward.
To keep the economy "running hot".
First, I believe that the significant expansion of dollar liquidity this year (2026) will rely on three pillars:
- The Federal Reserve will expand its balance sheet by "printing money";
- Commercial banks will increase lending to strategic industries;
- The Federal Reserve will lower mortgage rates by "printing money".
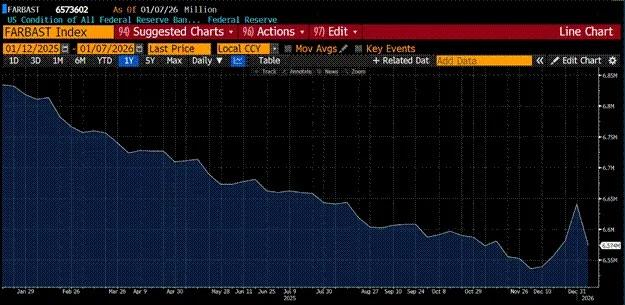
As shown in the figure above, in 2025, due to the quantitative tightening (QT) policy [4], the size of the Federal Reserve's balance sheet continued to shrink. In December 2025, the QT policy ended, and the Federal Reserve launched its latest "money printing plan" - "Reserve Management Purchase (RMP)" at its meeting that month. I have explained the working mechanism of RMP in detail in my article "Love Language". The chart clearly shows that the size of the Federal Reserve's balance sheet bottomed out in December 2025. According to the RMP plan, the Federal Reserve will inject at least $40 billion in liquidity into the market every month; and as the US government's financing needs increase, this purchase scale will expand.
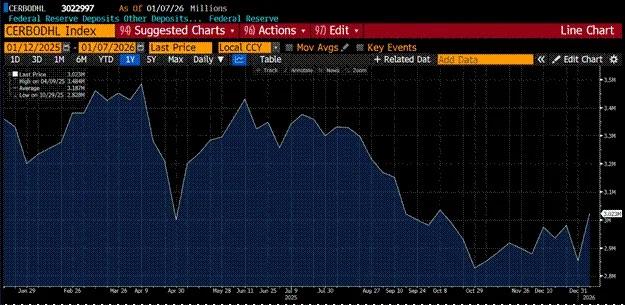
The chart above shows the weekly loan growth data for the U.S. banking system released by the Federal Reserve, called "Other Deposits and Liabilities (ODL)". I started paying attention to this indicator after reading research by Lacy Hunt. Starting in the fourth quarter of 2025, banks began increasing lending. The process of banks issuing loans is essentially creating deposits (i.e., creating money) "out of thin air".
Banks like JPMorgan Chase are happy to lend to companies directly supported by the US government—JPMorgan Chase even launched a $1.5 trillion lending facility for this purpose. The specific operating model is as follows: the US government injects capital (equity investment) into a company or provides a procurement agreement (a commitment to purchase the company's products in the future). The company then applies for loans from JPMorgan Chase or other large commercial banks to expand production. The government's "endorsement" reduces the risk of corporate default (by guaranteeing demand), so banks are also willing to "create money" to finance these strategic industries. This is strikingly similar to China's credit creation model—credit creation shifts from the central bank to commercial banks, which, at least initially, significantly increases the velocity of money, thereby driving nominal GDP growth above trend.
The United States will continue to exert its military influence, and the manufacture of weapons of mass destruction requires financing support from the commercial banking system. This is why bank credit growth is expected to show a long-term upward trend in 2026.
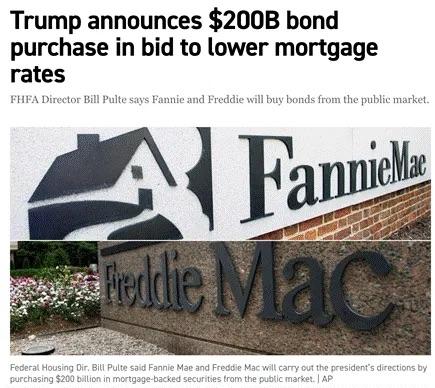
Trump comes from the real estate industry and is well-versed in financing real estate projects. Recently, Trump issued a new policy requiring the U.S. government-backed companies (GSEs) Fannie Mae and Freddie Mac to use funds on their balance sheets to purchase $200 billion worth of mortgage-backed securities (MBS)[5]. Before Trump issued this order, these funds had been idle on the balance sheets of Fannie Mae and Freddie Mac, so this policy will directly increase dollar liquidity. If this policy is effective, Trump will likely introduce similar measures in the future.
By lowering mortgage rates and boosting the housing market, many Americans will be able to take out mortgages with record home equity. This "wealth effect" will make ordinary people feel satisfied with the economy on Election Day, leading them to vote for the Republican Party (the red camp). Most importantly for us risk asset holders, this will create more credit available for purchasing various financial assets.
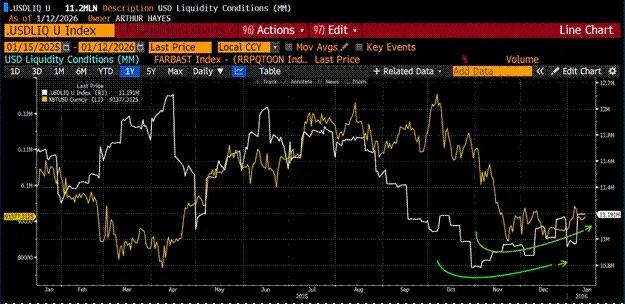
Bitcoin (gold curve) and dollar liquidity (white curve) bottomed out almost simultaneously. As mentioned earlier, with a significant expansion in dollar liquidity, the price of Bitcoin will rise accordingly. Forget about Bitcoin's lackluster performance in 2025—the liquidity at that time simply couldn't support a cryptocurrency portfolio. But we cannot draw wrong conclusions from Bitcoin's poor performance in 2025: its price movements have always been closely related to changes in liquidity, both in the past and now.
Trading Strategies
I am an aggressive speculator. Although the Maelstrom fund is already nearly fully invested, given my strong bullish outlook on the expansion of dollar liquidity, I still want to further increase my risk exposure. Therefore, I have established long positions in Strategy (ticker symbol: MSTR US) and Metaplanet (ticker symbol: 3350 JT) to gain leveraged exposure to Bitcoin without trading perpetual contracts or options derivatives.
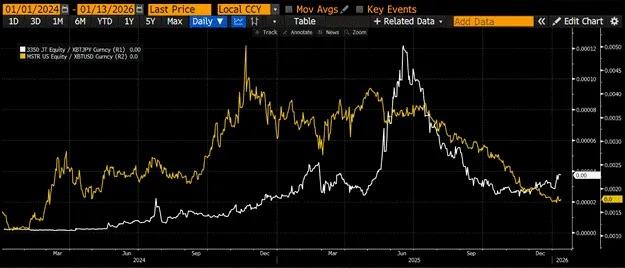
I divided Metaplanet's stock price (white curve) by the price of Bitcoin in Japanese yen, and Strategy's stock price (gold curve) by the price of Bitcoin in US dollars. The results show that the "Bitcoin ratio" for these two stocks is at a low point over the past two years and has fallen significantly from its peak in mid-2025. If the price of Bitcoin can rebound to $110,000, investors will again tend to indirectly invest in Bitcoin through these stocks. Due to the inherent leverage in the capital structures of these companies, their stock price increases will exceed those of Bitcoin itself during a Bitcoin rally.
Furthermore, we continue to increase our holdings in Zcash (ZEC). The departure of developers from Electronic Coin Company (ECC) is not bad news. I firmly believe that these developers, now working in independent, for-profit entities, will create even better and more impactful products. I am fortunate to have had the opportunity to buy ZEC at a low price from those "panic sellers."
To all speculators, forge ahead and climb higher! The outside world is full of risks, so please protect yourselves. May peace be with you, and may the goddess "Sorrowful Clouds" pay homage!
[1] QE (Quantitative Easing): refers to a policy tool by which central banks purchase financial assets by "printing money" and expand the size of their balance sheets in the process.
[2] ETF (Exchange Traded Fund): An open-ended fund that is listed and traded on an exchange and tracks a specific index or portfolio of assets.
[3] ICE (Immigration and Customs Enforcement): The federal agency in the United States responsible for immigration enforcement and customs supervision.
[4] QT (Quantitative Tightening): refers to a policy tool by which the central bank “destroys” currency by selling assets on its balance sheet, thereby reducing the liquidity of fiat currency.
[5] MBS (Mortgage-Backed Security): A type of security issued with real estate mortgage loans as underlying assets. Investors can obtain interest income from mortgage loans by purchasing MBS.


