

Three ugly plots that demonstrate why you should stop treating power curve forecasts as "probabilities."
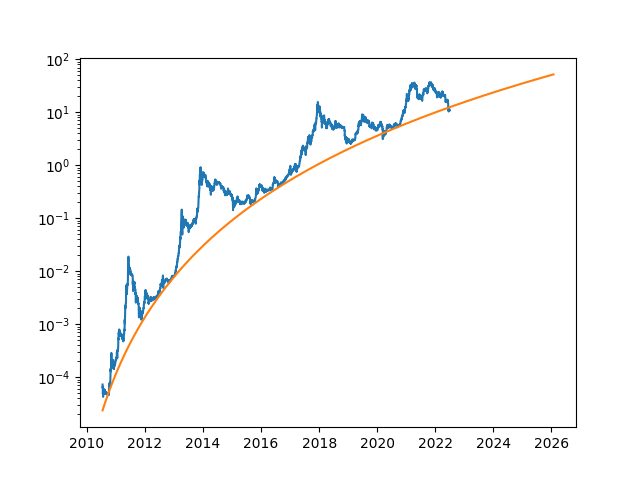
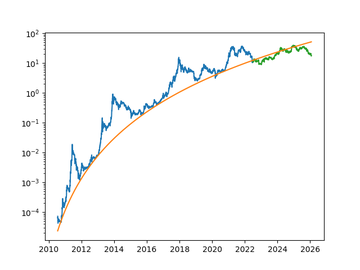
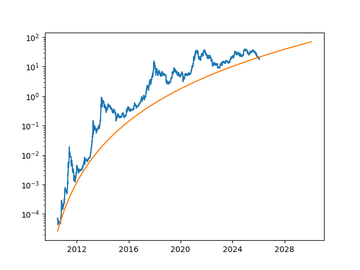
This is the BTC/GOLD 0.01 quantile power curve fit calculated on 1 July 2022. A common extension of this analysis is to claim, "there's a 99% probability that BTC/GOLD will be above this trendline in the future."
However, BTC/GOLD was only above that trendline for 16% of the next 1306 days. Not 99%.
So, what do people do? They compute a new trendline and repeat the claim. "Actually, there's a 99% probability that BTC/GOLD will be above THIS trendline."
From Twitter
Disclaimer: The content above is only the author's opinion which does not represent any position of Followin, and is not intended as, and shall not be understood or construed as, investment advice from Followin.
Like
Add to Favorites
Comments
Share
Relevant content

