

The Digital Asset Treasury (DAT) model is gaining popularity and evolving among listed companies globally. Particularly after the market correction in Q4 2025, the sustainability of this business model during a downturn has become a focus of market attention. This article, based on the market environment at the beginning of 2026, systematically dissects the operational mechanism of DAT companies, focusing on the dual dimensions of "financing structure × underlying currency" to deeply analyze the effective boundaries and potential risks of the "reflexive flywheel" of DAT companies.
The study points out that the DAT model is essentially proactive balance sheet management, with its value creation stemming from the synergy between asset-side returns (β) and capital-side operations (α). Regarding financing structures, the article demonstrates the high dependence of equity financing (such as ATMs and PIPEs) as the core driver of the flywheel on valuation premiums (mNAV), and the maturity mismatch risk introduced by debt financing (such as convertible bonds) as a second-tier funding source while providing leverage efficiency. In terms of cryptocurrency selection, the article compares and analyzes the financing resilience of Bitcoin (BTC) due to its strong consensus, the compliance and transparency challenges of Ethereum (ETH) with its added interest-bearing attributes, and the aggressive liquidity transmission mechanism of smaller cryptocurrencies achieving "crypto-stock linkage" through SPAC channels.
Based on case studies from Strategy (formerly MicroStrategy), Core Scientific, and MARA, this paper proposes a sustainability assessment framework centered on "premium window—cash buffer—debt terms," and provides four trend predictions: First, the industry has entered a cross-cycle survival phase, where the key challenge lies not in book drawdowns, but in the liquidity pressure caused by companies' refinancing capabilities and debt repayment terms under a shrinking financing window. Second, valuation logic will shift from "channel premium" to "capability pricing." With the widespread adoption of compliant allocation tools such as spot ETFs, financing premiums for DAT companies will become scarcer and shorter-lived, and the differentiation in mNAV among companies will persist in the long term. Third, differences in underlying assets will further amplify corporate differentiation. BTC-DAT is more likely to form a financing anchor but is more sensitive to the pace of financing. The upper limit of ETH-DAT depends on the ability to continuously and clearly disclose the source of revenue and risk boundaries, and to establish a verifiable governance and execution record. Fourth, DAT will continue to be used as a capital market strategy, but the industry structure is likely to move towards concentration at the top and elimination at the bottom. This article provides a framework for DAT companies to assess sustainability during a downturn and offers a reference for the standardization evolution of the DAT industry.
Keywords : Digital Asset Treasury (DAT); Financing Structure; Currency Differences; mNAV; Sustainability Analysis
Table of Contents
1. Introduction
2. Concepts and Definitions
2.1. Definition of Concept: Treasury
2.2. Terminology Explanation
2.3. Analysis of the Current Status of Digital Asset Reserves (DAT) of Global Listed Companies
3. DAT Company's Business Model
3.1. Business Model Positioning: A proactively managed balance sheet-based company
3.2. Value Creation Mechanism: Assets determine the outcome, financing determines the speed.
3.3. Structural characteristics of the business model: weakened profit and loss statement, concentrated assets, financing-driven, and valuation differentiation.
3.4. Sources of Differences in Models: Financing Structure × Currency Attributes
4. Comparison of the core financing structures of DAT
4.1. Equity Financing: The Core Driving Force of the DAT Flywheel
4.2. Debt Financing: Second Layer of Funding Sources and Time Constraints
4.3. The combination of equity and debt: flywheel formation and survival boundaries
5. Currency Analysis: How Core Assets Reshape DAT's Revenue Sources and Resilience
5.1. Bitcoin (BTC): Consensus Advantage Traded for a More Resilient Funding Window
5.2. ETH: The combination of ecosystem and revenue variables places higher demands on transparency.
5.3. The "Crypto-Stock Linkage" Model for Minor Cryptocurrencies: Asset Mapping and Liquidity Transmission under the SPAC Channel
5.3.1. Core Mechanism: Liquidity Transmission After Backdoor Listing
5.3.2. Typical Path Analysis: Static Treasury and Dynamic Market Making
6. DAT Risk Analysis
6.1. The Cyclical Stages and Differentiation Paths of DAT
6.2. Financing Structure Risk: The Boundary Between Equity and Debt
6.3. Currency Portfolio Risk: BTC's Macroeconomic Sensitivity and the Paradox of ETH Allocation
6.4. Core Assessment Indicators: Quantifying Financial Health and Expansion Potential
7. Analysis of Typical Risk Handling Cases
7.1. Strategy: Cyclical pressures of equity-bond arbitrage and the forward debt wall
7.1.1. Constraints of Premium Rate Fluctuations on Financing Window
7.1.2. Repayment pressure of forward debt
7.2. Core Scientific: The Painful Lesson of Debt-Driven Cryptocurrency Hoarding and Maturity Mismatch
7.3. MARA: A Survival Game Under Equity Dilution
8. DAT Company Sustainability Analysis and Trend Outlook
8.1. DAT Company Sustainability Assessment Framework: Premium Window, Cash Buffer, Debt Maturity and Terms
8.2. Trend Outlook: From Expansion Narratives to Survival Tests
8.2.1. Reshaping the Core Proposition: From Procyclical Expansion to Cross-Cycle Survival
8.2.2. Valuation Model Shift: Premium Scarcity and Functional Pricing
8.2.3. Divergence of Underlying Assets: Consensus Pricing of BTC and Strategic Returns of ETH
8.2.4. Industry Endgame Prediction: Intensified Matthew Effect and Tail Clearing
1. Introduction
DAT (Digital Asset Treasury) usually refers to the inclusion of crypto assets such as BTC and ETH in the balance sheet of enterprises (or DAO organizations) and their management and allocation in the form of "long-term reserves". Driven by the benchmark demonstration effect of Strategy (formerly MicroStrategy) and coupled with the support signal of the White House for the "Strategic Bitcoin Reserve", this strategy is gradually moving from case exploration to a wider range of listed companies' strategic options. The Bitwise report pointed out that as of Q3 2025, 172 listed companies worldwide held BTC, with a total holding of more than 1 million coins. [1] Therefore, based solely on the perspective of listed companies, the asset size of BTC-related DAT has exceeded US$100 billion (calculated according to the Bitcoin price at the time the Bitwise report was published); if other digital assets and unlisted corporate entities are further included, its potential coverage and size still have significant room for expansion.
However, with the continued weakening of BTC and ETH prices since Q4 2025, the effectiveness of the DAT (Digital Asset Trust) approach has begun to be more widely questioned. There have been cases where entities using "equity + debt" financing have experienced financing model failures and been forced to adjust their strategies after stock price pullbacks: the stock price of MicroStrategy, the largest Bitcoin treasury, has fallen by more than 50%, and the stock price of Bitmine, the largest Ethereum treasury, has fallen by more than 80%. At the same time, some small and medium-sized DAT companies have also seen their strategies shrink or even suspend, such as Prenetics, a BTC treasury company endorsed by football star David Beckham, which stopped its treasury strategy. These changes have shifted the market's focus on DAT from "whether to hold the tokens" to "how to navigate pullback cycles": against the backdrop of price pullbacks, declining stock prices and debt pressures can create a double impact—in other words, the core variable determining whether a strategy can weather the cycle is "what financing method to hold the tokens + what tokens to hold."
Based on this, this paper reviews the current development status and latest stress tests of DAT companies at the beginning of 2026, and provides a framework analysis of the sustainability and key risk points of corporate DAT strategies from two main lines: financing structure and currency selection, in order to provide verifiable references for subsequent strategy design and risk control.
2. Concepts and Definitions
2.1. Definition of Concept: Treasury
This article studies DAT (Digital Asset Treasury), starting with a definition of the concept.
• Broadly defined: Any fund pool that incorporates crypto assets into its fund management system and intends to hold them for the medium to long term can be considered DAT. Classified by the treasury entity (i.e., the entity holding DAT): DAT can be divided into on-chain and off-chain categories.
(1) On-chain : mainly includes DAO organizations and project foundations;
(2) Off-chain : One type is DATCo (Digital Asset Treasury Company) which focuses on "hoarding coins", and the other type is companies with other main businesses but include crypto assets in their asset allocation (such as crypto mining companies).
(3) Backdoor listing: In recent years, a new path combining on-chain and off-chain has emerged. For example, project parties can achieve backdoor listing through shell companies (SPAC, special purpose acquisition company) to take over on-chain funds and off-chain capital market channels.
• Narrow definition : In the current market context, DAT usually refers to DATCo (Digital Asset Treasury Company), which is a company (mostly a listed company) whose main business is holding and managing crypto assets off-chain . [2]
Based on the above definition, the "DAT companies" referred to in this article mainly refer to DATCo, that is, companies (mainly listed companies) whose main business is off-chain cryptocurrency holding—with Strategy (formerly MicroStrategy) being the originator of this model . Companies with a clear main business and that only invest in crypto assets (such as mining companies) are not the focus of this analysis.
Table 1: Explanation of Key Terms in the Article
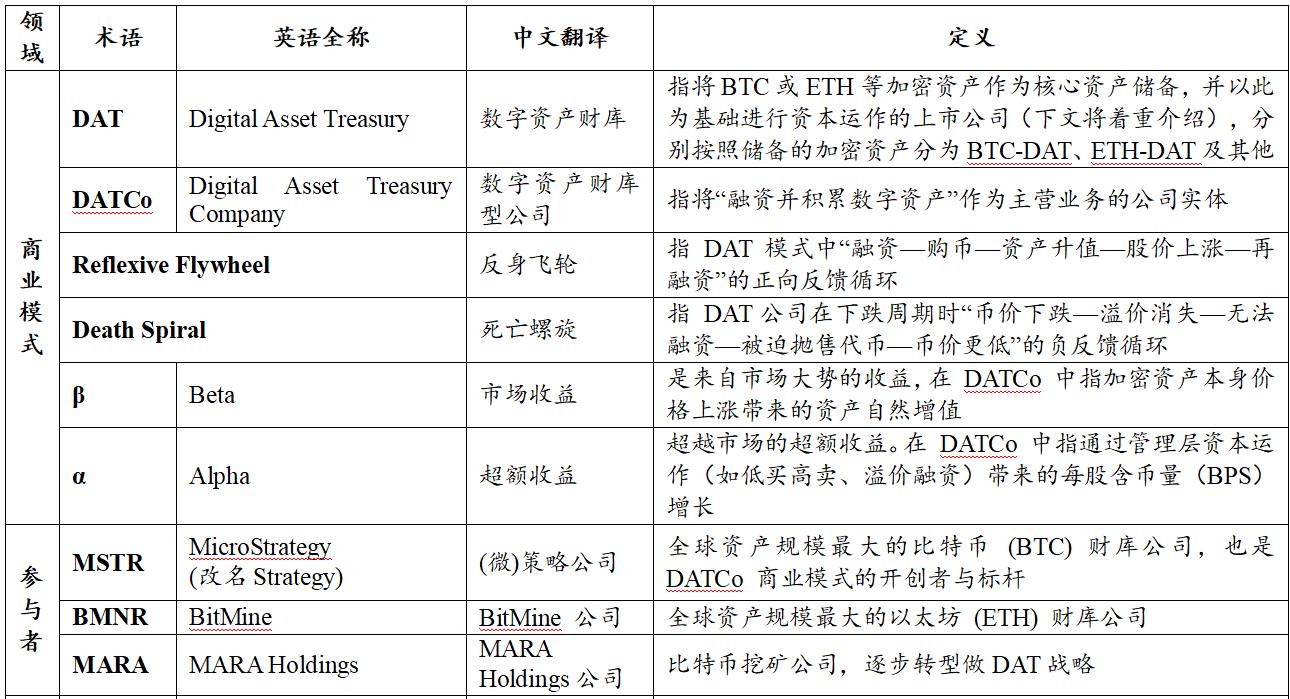
Source: Compiled by PKUBA
2.2. Analysis of the Current Status of Digital Asset Reserves (DAT) of Global Listed Companies
Based on Coingecko data (as of January 2, 2026), the following is a summary of the digital asset reserves (DAT) held by publicly listed companies worldwide. (Note: This statistic only covers data from publicly traded companies; holdings by unlisted companies are not included.)
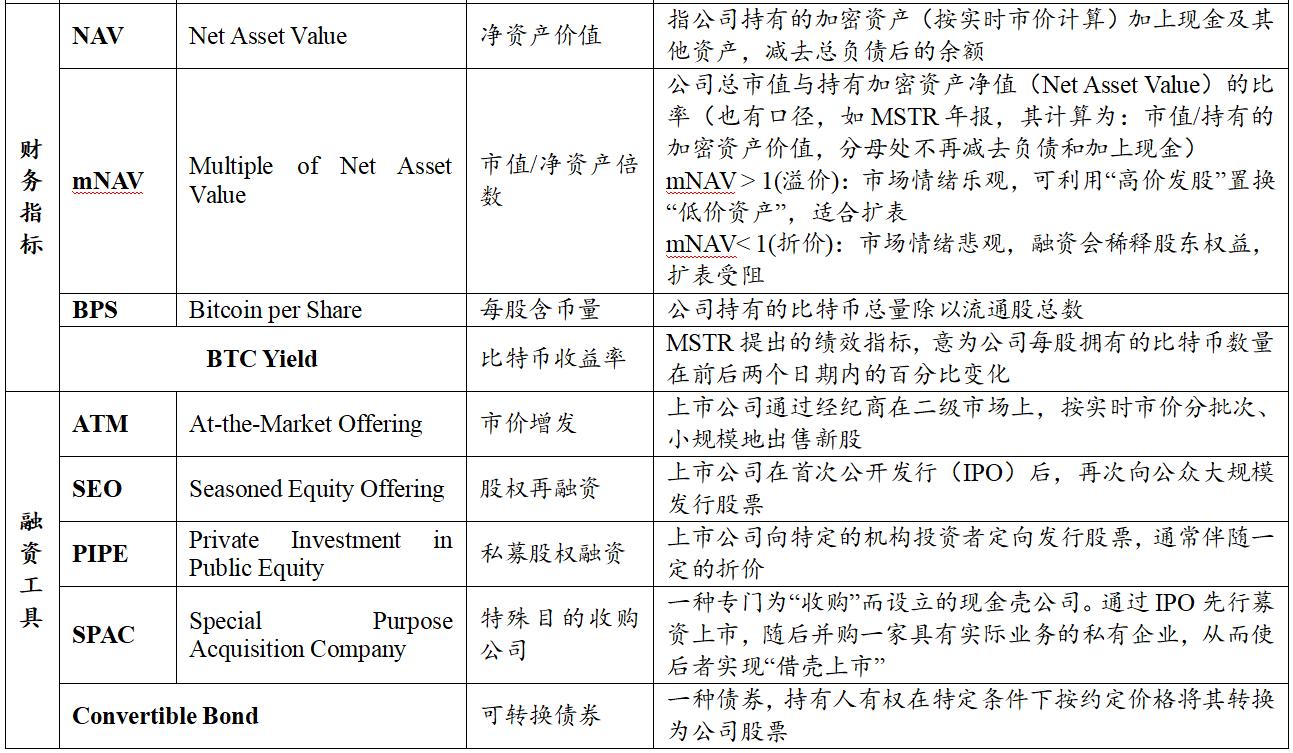
Table 2: Statistics on Digital Asset Reserves (DAT) of Listed Companies
Source: Coingecko, data as of January 2, 2026
Note: Other currencies include assets such as XRP, BNB, TON, and SUI.
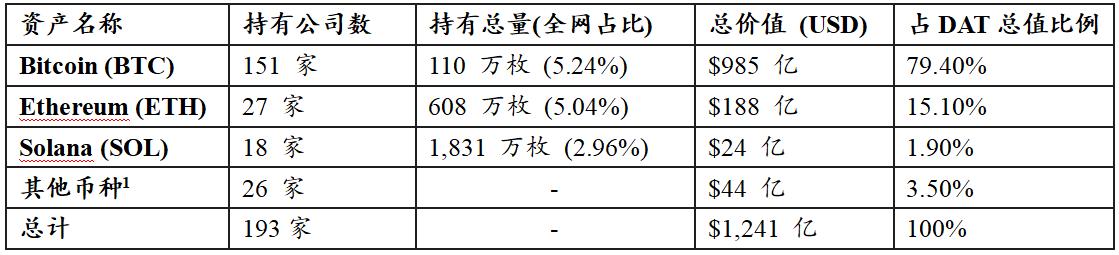
Figure 1: Value Share of Digital Asset Reserves (DAT) of Listed Companies
Source: Coingecko, data as of January 2, 2026
Based on the above, the basic structure of global listed companies DAT is as follows:
First, asset size and the leading effect: Statistics show that the total size of global listed companies' DAT has reached US$ 124.1 billion. In terms of value composition, Bitcoin (BTC) shows overwhelming dominance, accounting for as much as 79.4%; Ethereum (ETH) ranks second, accounting for 15.1%; Solana (SOL) and other long-tail assets account for only the remaining 5.5%.
Second, differences in allocation preferences and consensus : The penetration rates of various asset classes in corporate balance sheets differ significantly. BTC's total reserve value is approximately 5.2 times that of ETH and more than 41 times that of SOL. In terms of institutional coverage, as many as 151 listed companies hold BTC, far exceeding ETH (27 companies) and SOL (18 companies). This data strongly supports the fact that BTC remains the preferred asset for institutional fund allocation.
Third, the structural characteristics of long-tail assets: Within the "Other Assets" category (accounting for 3.5%), two main characteristics are observed:
• Established infrastructure category: Includes tokens from established public chains or exchanges such as XRP, LINK, TRON, and BNB, mostly held by listed companies in connection with related businesses;
• Capital Operation Category: Some emerging projects (such as 0G, Babylon, Pump.fun, etc.) exhibit obvious "crypto-equity linkage" characteristics, reflecting that some project teams are trying to achieve a deep binding between listed company equity and digital asset value through capital market operations.
3. DAT Company's Business Model
3.1. Business Model Positioning: A proactively managed balance sheet-based company
DAT companies have a relatively clear and replicable business model: they are essentially active operating companies with balance sheet management as their core, rather than ETFs or closed-end funds that passively track underlying assets.
Unlike traditional companies that rely on products and services to generate operating cash flow, DAT's core strategy is to raise funds through the capital market to purchase and hold crypto assets on a large scale for the medium to long term. Therefore, its asset portfolio typically shows a high allocation to digital assets such as BTC and ETH, while its liabilities and equity are mainly composed of equity and debt financing. Its operational goals are also primarily reflected in continuously accumulating digital asset scale on its balance sheet and increasing the asset content per unit of equity.
Figure 2: DAT Company Value-Added Cycle Diagram (Reverse Flywheel Diagram)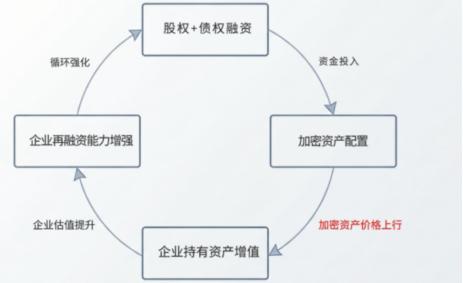
Source: Compiled by PKUBA
This model is often summarized as a "reflexive flywheel": a positive feedback loop of financing—coin purchase—asset appreciation—market capitalization increase—refinancing. Its logical chain can be broken down as follows: the company obtains funds through equity or debt financing and allocates them to crypto assets; when the coin price rises, the increased value of the assets leads to a market revaluation of the company; rising stock prices further strengthen refinancing capabilities, thereby driving a new round of balance sheet expansion.
In contrast, DAT may fall into a "death spiral" during a downturn: a negative feedback loop of falling token prices—disappearance of premiums—inability to raise funds—forced token sales—further lower token prices. Specifically, the decline in the underlying asset (token price) first leads to a shrinking of the company's balance sheet; the loss of asset value causes the disappearance of the stock price premium and a sharp drop in valuation, resulting in the rapid closure of external financing windows; liquidity depletion or debt default risks force the company to sell tokens at low prices to repay debts, thereby further depressing the token price and exacerbating a new round of balance sheet shrinkage.
Figure 3: DAT Company's Declining Cycle Chart (Death Spiral)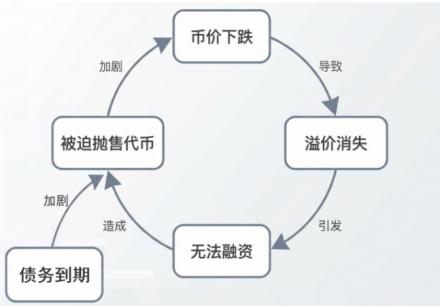
Source: Compiled by PKUBA
This positive and negative two-way cyclical mechanism makes the DAT model exhibit a strong procyclicality in the highly volatile crypto market. The stability of its financial structure is extremely dependent on the price trend of the base token. Once it enters a downward channel, companies lacking external liquidity injections are easily caught up in irreversible asset sell-offs and valuation collapses.
Therefore, the pace of balance sheet expansion for DAT companies depends on the financing window, which is influenced by both the crypto asset cycle and the management's ability to complete financing and allocation during periods of favorable valuations. The ability to conduct forward-looking asset and liability management, maintain emergency liquidity, and dynamically adjust portfolio strategies is crucial for DAT companies to survive during cyclical shifts.
3.2. Value Creation Mechanism: Assets determine the outcome, financing determines the speed.
At the mechanism level, the value creation of DAT can be summarized into two main lines: the asset side β determines the direction and result of net asset value changes, and the capital side α determines the speed and efficiency of asset expansion.
l Asset-side beta: Income from holding gains such as changes in the price of crypto assets and staking (if applicable);
l Capital side α: derived from valuation premium, resulting in more favorable financing and balance sheet expansion efficiency.
On this basis, the company also uses leverage tools (such as convertible bonds and mortgage financing) to improve capital utilization efficiency and liquidity—amplifying returns during upward phases, but at the same time increasing sensitivity to coin price pullbacks and refinancing conditions.
Table 3: Analysis of DAT Company's Value Sources and Mechanisms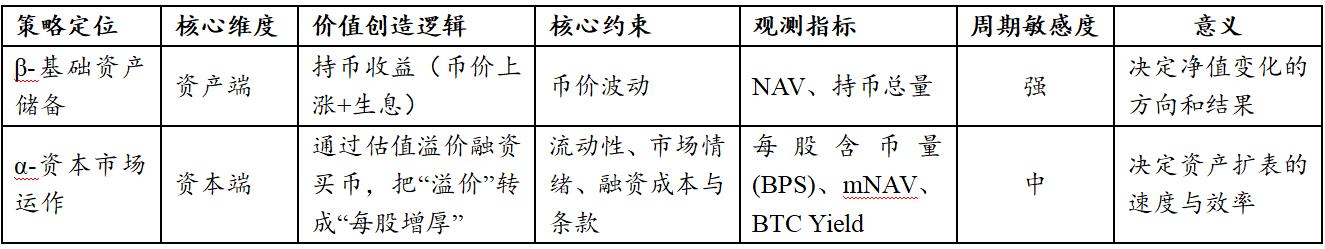
Source: Compiled by PKUBA
In summary: β is more reflected in changes in NAV and cash holdings; the key to α lies in whether the company can steadily translate its valuation advantage into an improvement in BPS when mNAV is at a favorable level; while "tool layer" arrangements (debt, collateral, etc.) have more impact on execution flexibility and constraint strength.
3.3. Structural characteristics of the business model: weakened profit and loss statement, concentrated assets, financing-driven, and valuation differentiation.
Within the framework of "β determines the outcome and α determines the speed," DAT's business model typically exhibits four structural characteristics, corresponding to the evaluation system, asset structure, financing structure, and valuation mechanism, respectively.
First, the evaluation framework has shifted from the income statement to the balance sheet. DAT's core operating activities do not rely on products or services to generate traditional revenue, but rather on balance sheet management centered around the holding and expansion of crypto assets. Therefore, indicators such as revenue, gross margin, and net profit have limited explanatory power for operating quality; more explanatory indicator systems tend to shift towards the amount of crypto held and its changes, the amount of crypto per share (BPS), and the market capitalization premium relative to net assets (mNAV) to measure whether balance sheet expansion is effective and whether the assets per unit of equity have achieved a substantial increase.
Second, assets are highly concentrated, and net assets are highly sensitive to cryptocurrency price fluctuations. DAT's asset structure is typically highly concentrated, with a high proportion of crypto assets, causing net assets to fluctuate significantly with cryptocurrency price movements. Cash primarily serves as a liquidity buffer, covering interest expenses, funding gaps, and operational safety during extreme market conditions. Therefore, the overall risk-return performance is more "non-linear": net asset elasticity amplifies during upward trends; during downward trends, net asset contraction, valuation compression, and decreased funding capacity often occur simultaneously.
Third, financing is primarily equity-based, supplemented by debt, and the structure determines the company's ability to withstand pressure across economic cycles. DAT's liabilities mainly consist of equity financing, debt financing, and a small amount of short-term borrowing or repurchase agreements. In practice, companies often expand their balance sheets through methods such as ATM (Asset-to-Money), SEO (Search-to-Earn), and PIPE (Private Partnerships) when valuations are more favorable, supplemented by convertible bonds, preferred shares, and notes to introduce a second layer of funding. These two types of financing are not simply substitutes: equity financing relies more on valuation and absorption capacity; debt financing is more constrained by currency pullbacks and refinancing conditions. Different terms and structures can significantly alter a company's financial pressure and risk exposure across economic cycles.
Fourth, valuations are sensitive to expectations, and the mNAV of similar assets may still diverge in the long term. DAT stock prices not only reflect the value of the underlying assets but also the market's overall expectations of its financing capabilities, management decisions, and the sustainability of its balance sheet expansion. Therefore, even with similar-sized and structured crypto assets, the mNAV of different DATs may still differ in the long term; these differences stem more from market sentiment, corporate governance, and financing path choices.
In summary, the risk-return characteristics of DAT are not determined by a single factor, but are often shaped by a combination of "asset concentration + financing structure + market expectations", which are amplified or weakened in different market environments.
3.4. Sources of Differences in Models: Financing Structure × Currency Attributes
From the perspective of business model structure, the differences between DAT mainly focus on two dimensions: financing structure and core asset selection.
In terms of financing structure, equity-dominated DATs can expand their balance sheets through share issuance when mNAV>1, but their financing capacity may weaken rapidly when valuations decline. DATs with a higher proportion of debt financing can improve asset expansion efficiency through convertible bonds, preferred shares, and other instruments, but they are more sensitive to currency price declines and deteriorating refinancing conditions. In particular, the term structure, interest rate level, and the presence of mandatory clauses will directly affect their survival ability in a bear market.
On the asset side, the choice of currency is another key variable determining the stability of the model. DAT, with BTC as its core asset, relies more on scarcity and market consensus; DAT with ETH or other platform tokens as its core assets, in addition to bearing the risk of price volatility, also faces uncertainties such as technological roadmap, ecosystem competition, and changes in revenue models. The differences in volatility, drawdown magnitude, and narrative stability among different currencies will be transmitted to the shareholder level through the balance sheet, significantly altering the risk curve.
Therefore, there is no single "optimal business model" for DAT; its sustainability depends more on the match between the financing method and the characteristics of the currency. The more aggressive the financing and the higher the uncertainty of the core assets, the stronger the dependence on the market environment. The following text can be developed along two lines: financing structure and currency differences.
4. Comparison of the core financing structures of DAT
Based on the above judgment that "financing structure determines the efficiency of balance sheet expansion and cross-cycle pressure", this section further breaks down common DAT financing tools and compares their applicability and constraints in different market stages.
4.1. Equity Financing: The Core Driving Force of the DAT Flywheel
Among the main financing methods, equity financing is the most strategically crucial for DAT: under specific valuation conditions, equity financing not only does not necessarily dilute the value of each share, but may even increase the number of crypto assets corresponding to each share. This is predicated on the company's stock price being higher than its intrinsic net asset value (mNAV), i.e., mNAV > 1. In this case, the company can issue new shares to raise funds, which can then be used to allocate BTC/ETH at a relative "discount" on the asset side, forming a structural condition of "exchanging valuation advantage for asset size," and constituting the core positive feedback source in the flywheel.
At the tool level, based on different financing methods, they can be divided into three approaches: ATM (At-the-Market Offering), SEO (Seasoned Equity Offering), and PIPE (Private Investment in Public Equity).
Table 4: Comparison of the Three Major Equity Financing Instruments
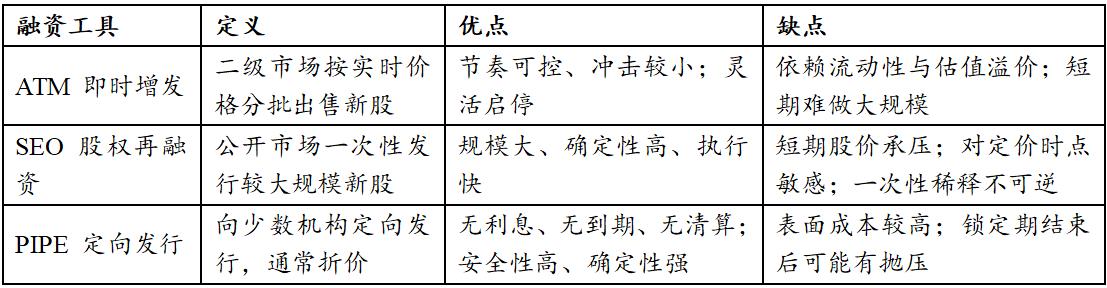
Source: Paramita Venture [3]
ATM (Instant Monetary Offering) is considered the most ideal equity financing tool. Its advantage lies not in the scale of financing, but in the highly decentralized pace of financing, allowing it to move in sync with secondary market trends. By continuously and decentralizedly issuing new shares in the public market, DAT can convert the increase in stock price into the ability to buy BTC/ETH without significantly disrupting the stock price. However, this model is extremely dependent on market conditions; once trading liquidity declines or valuation premiums converge, the viability of ATM quickly disappears.
SEO (equity refinancing) is more of a phased choice. By completing a large-scale financing in one go, DAT can significantly increase its BTC/ETH holdings in a short period of time, but at the cost of short-term stock price pressure and a high dependence on the timing of the issuance. If the market rises rapidly after the issuance, the opportunity cost of SEO will be amplified.
PIPE (Private Placement of Assets) are often issued at a discount. Although this superficially increases financing costs, from a balance sheet security perspective, PIPE is one of the most stable sources of funding for DAT (Digital Assets and Technologies). Because there is no interest burden, maturity pressure, or liquidation mechanism, PIPE transfers all uncertainty to equity investors, allowing DATs to maintain ample time options even in volatile environments. DATs using PIPE financing typically do not face passive deleveraging due to market fluctuations. This is why PIPE often becomes a practical choice for DATs during periods of unstable valuations and market uncertainty.
4.2. Debt Financing: Second Layer of Funding Sources and Time Constraints
Compared to equity financing, debt financing usually does not directly bring positive feedback, but it can significantly expand the scale of available funds at certain stages, thereby improving the efficiency of asset expansion, and can be regarded as a "second source of funds".
Convertible bonds are widely used in DAT financing structures, offering the advantage of combining the certainty of debt with the upside potential of equity. When the stock price performs well, convertible bonds can absorb debt repayment pressure through conversion; when the market performs poorly, their interest costs are usually lower than ordinary debt, providing a buffer for DAT. However, if the cryptocurrency trades sideways for an extended period and the stock price fails to meet the conversion criteria, the convertible bonds will ultimately become a rigid debt repayment burden.
In addition, heavy reliance on convertible bond financing may trigger a further "downward spiral" dominated by arbitrage institutions—that is, institutions hedge bond risks by short stocks—and when stock prices fall, in order to maintain the hedging ratio, these institutions will mechanically increase short efforts, thereby accelerating the stock price collapse and closing the financing window. This short selling mechanism embedded in the capital structure will passively amplify the decline in DATCo's downward cycle, deepen the "death spiral" and cause the financing capacity to reach zero before the asset value. [4]
Note: The "downward spiral" mentioned here is not the same as the "death spiral" under the reversal of the "reverse flywheel", but it will act as an accelerator, further deepening the degree of the "death spiral" and accelerating its collapse.
The risks of debt instruments such as ordinary bonds and senior notes do not stem from short-term price fluctuations, but rather from the time dimension. Unlike on-chain leverage, DAT creditors typically do not have the power to directly dispose of BTC/ETH, meaning the company will not be immediately liquidated due to a drop in the price of the coin. The real risks lie in the structural pressures brought about by accumulated interest expenses, concentrated debt maturities, and deteriorating refinancing conditions.
Table 5: Comparison of Debt Financing Instruments
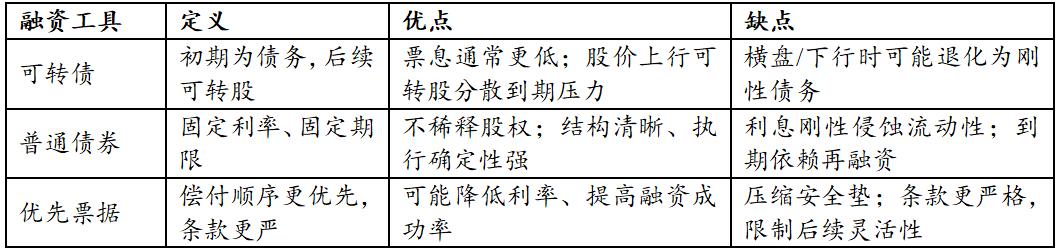
Source: Compiled by PKUBA
4.3. The combination of equity and debt: flywheel formation and survival boundaries
Ideally, DAT does not rely on a single tool, but rather gradually builds and strengthens positive feedback through the phased coordination of equity and debt: rising stock prices drive up mNAV, enhancing financing capabilities; the proceeds from financing are used to increase holdings of BTC/ETH, further improving resilience to price increases, ultimately reflected in a further rise in stock prices.
In this process, equity financing is responsible for "building the flywheel," while debt financing is responsible for "lengthening the flywheel radius." The former determines whether DAT has a structural advantage, while the latter determines whether it can survive long enough before the flywheel is fully built and whether it can expand the flywheel's scale.
Figure 4: Flywheel formation diagram of DAT Company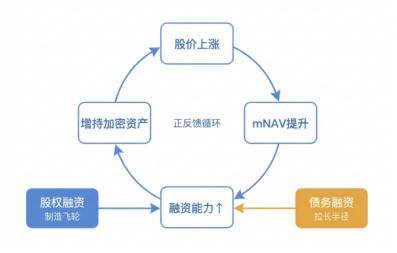
Source: Compiled by PKUBA
From a risk-return-cost perspective, the difference between different financing methods lies not in their good or bad, but in their impact on the survival margin. PIPE-financed DATs are less likely to fail due to structural problems because their costs are clear and there is no mandatory exit mechanism; debt-financed DATs typically do not exit immediately because creditors lack the right to dispose of core assets. What truly needs to be guarded against is the introduction of short-term financing structures with liquidation or forced liquidation clauses, as such arrangements directly undermine the DAT's control over time.
Overall, DAT's financing structure does not simply pursue high leverage or high elasticity, but rather revolves around a core objective: in a highly volatile crypto market, through reasonable capital structure design, to extend the holding period of core crypto assets as much as possible and amplify their return potential within an appropriate cycle window.
5. Currency Analysis: How Core Assets Reshape DAT's Revenue Streams and Resilience
Within the framework of "financing structure × currency attributes," asset selection is far more than simply betting on which asset will rise the most. It actually determines three things simultaneously: first, the volatility of the asset's net asset value; second, the ease and cost of the company obtaining funding; and third, the market's tolerance for the company's valuation premium. Therefore, when the market focus shifts from simply "whether to hold currency" to "how to navigate economic cycles," currency allocation becomes a key variable determining the success or failure of a strategy.
Figure 1 shows the current cryptocurrency allocation of mainstream DAT institutions: Bitcoin accounts for approximately 80%, Ethereum for approximately 15%, and other cryptocurrencies for approximately 5%. This concentration at the top reflects the continued strong preference of institutional funds for assets with high interpretability and liquidity. Based on this, this section divides the evolution path of DAT into BTC-dominated and ETH-dominated (yield-generating) models. After a thorough analysis of the operational logic of these two core asset types, we will further explore typical cases of "crypto-stock linkage" among smaller cryptocurrencies.
Table 6: Comparison of Characteristics of BTC-Dominated and ETH-Dominated DAT Companies
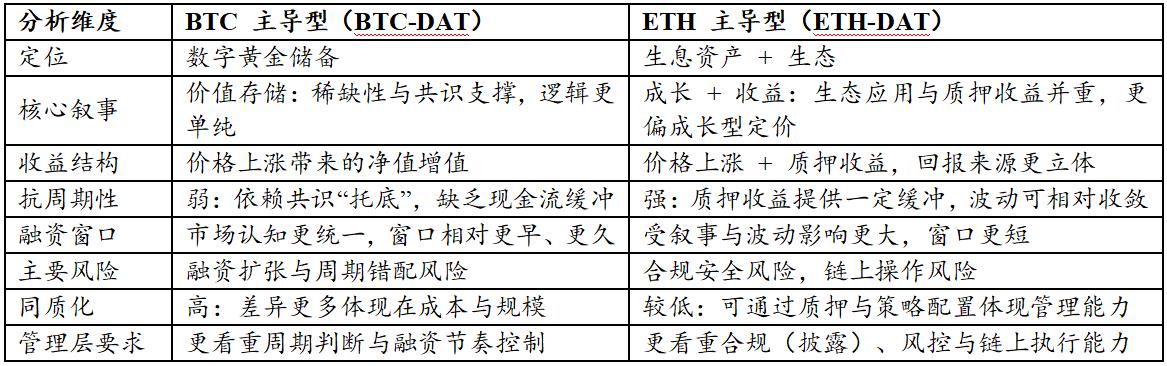
Source: Compiled by PKUBA
5.1. Bitcoin (BTC): Consensus Advantage Traded for a More Resilient Funding Window
The core logic of BTC-type DATs lies in their extremely low interpretation cost. The market tends to define BTC as a digital gold reserve. Even if the company itself lacks operating cash flow, investors can easily establish a clear pricing model through the size of their holdings, the rate of increase in holdings, and the net assets per share. This strong consensus characteristic creates two major financing advantages for the company:
• The asset pricing framework is clear, thus offering a long window of opportunity during upward cycles : Due to the clear asset attributes, the market's acceptance of BTC reserves is highest in the early stages of a bull market. This allows the company to obtain valuation premiums more quickly, thereby securing ample time and operational space for subsequent refinancing (such as share issuance or convertible bonds).
• Low uncertainty on the asset side means that discounts during downturns are manageable: When the market retraces, although the premium will be compressed, based on BTC's positioning as a mainstream asset, investors' evaluation logic will still remain within the framework of "net asset value - premium - financing capacity," and they will not easily question the risk of the asset itself going to zero. This clear valuation anchor can effectively prevent narrative collapse.
Figure 5: Statistics of the Top 100 Global BTC Treasury Companies on the Bitcointreasuries Website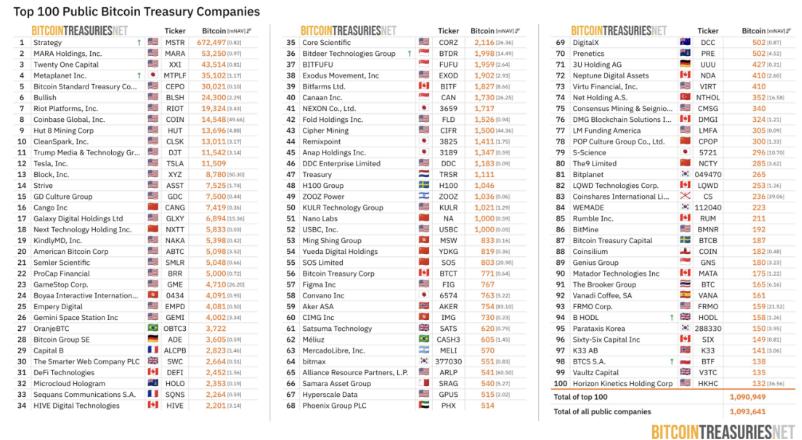
Source: Bitcointreasuries, data as of January 2, 2026
However, BTC-type DATs are not a natural safe haven; their "high beta" attribute also brings hidden structural risks.
First, the lack of a native revenue stream makes companies extremely sensitive to financing timing : Because BTC lacks a native staking reward mechanism, the company's performance is entirely dependent on price fluctuations. This deprives companies of a means to smooth out cycles, making precise timing of "financing-buying" extremely crucial. If a company's assets are at a high level at the peak of financing, and subsequently experiences a price drop, it will face severe maturity mismatch risk—the gap between the interest on rigid debt and the depreciation of its assets.
Second, homogeneous competition weakens pricing power : When most DAT companies adopt a single strategy of "hoarding coins," their business models inevitably become homogeneous. The market is unlikely to award higher management premiums to specific companies, and their stock prices may ultimately become mere shadow ETFs of BTC. This places higher demands on management: how to create alpha through "financial tricks" in a homogeneous competitive environment by using precise macro timing or innovative financing structure design.
In summary, while BTC provides a stable narrative foundation, if a company lacks a buffer mechanism for generating income and misjudges the financing cycle, it will be very likely to fall into a passive contraction predicament once the valuation falls and financing dries up.
5.2. ETH: The combination of ecosystem and revenue variables places higher demands on transparency.
Unlike BTC's pure reserve attribute, ETH possesses a dual attribute of "interest-bearing mechanism + ecosystem governance." This means that ETH-type DATs face a more complex pricing model—the market not only focuses on price trends but also incorporates the prosperity of the network ecosystem, the technology upgrade roadmap, and on-chain yield into valuation considerations.
This complexity provides DATCo with a tool to smooth out cycles and creates opportunities for differentiation among companies. Companies can use a portion of their ETH for staking or participating in on-chain DeFi, generating stable returns over the holding period. This upgrades the treasury narrative from simply holding tokens to a "manageable portfolio of interest-bearing assets," providing a cash flow buffer during bear markets. Furthermore, this model gives companies room for "active management"—the allocation of staking ratios, the deployment of node verification, and the design of liquidity release mechanisms can all become key indicators for horizontal comparison.
Figure 6: Statistics of the Top 100 Global ETH-Related Listed Companies on the Strategythreserve Official Website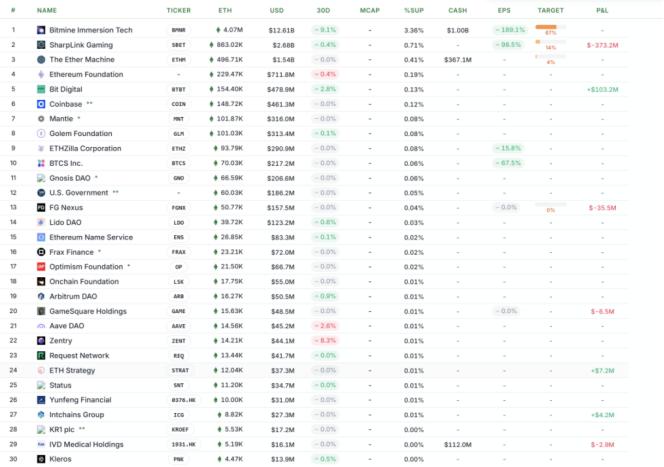
Source: Strategicethreserve, as of January 2, 2026
However, the other side of the coin is the extreme demand for risk control and transparency: given that ETH's staking mechanism may touch a nerve with securities regulators (such as the US SEC), and that on-chain interactions involve complex auditing issues, if a company cannot clearly disclose the source of its revenue or prove the independence of its asset custody, the market will struggle to assign a fair price, resulting in a significant valuation discount. Only by completing a highly transparent audit can investors' compliance concerns be eliminated.
Finally, compared to BTC's strong cyclicality, ETH exhibits more pronounced volatility, resulting in a "narrow and rapid" financing window. This window often opens and closes quickly, and the ability to complete financing and allocation within a short period directly shapes the balance sheet structure for the following quarters. In other words, the ETH treasury operates on an "opportunity window strategy": inadequate execution and governance can amplify its complexity and uncertainty.
5.3. The "Crypto-Stock Linkage" Model for Minor Cryptocurrencies: Asset Mapping and Liquidity Transmission under the SPAC Channel
Beyond mainstream assets, small-cap cryptocurrencies are exploring a more aggressive "crypto-stock linkage" path. Unlike the traditional model where business revenue supports stock prices, this model utilizes SPACs (Special Purpose Acquisition Companies) as listing vehicles, combined with financing tools such as PIPE and ATMs, to construct a transmission mechanism connecting US stock market liquidity with on-chain assets.
In short, this is not a simple "backdoor listing", but rather the encapsulation of the on-chain token "buying plan" into tradable Nasdaq stock assets, thereby achieving a deep binding between the project's assets and secondary market funds.
5.3.1. Core Mechanism: Liquidity Transmission After Backdoor Listing
On the surface, this appears to be a "backdoor listing" for the project, but a deeper analysis reveals it to be a liquidity transfer mechanism centered on capital operations—allowing funds from the stock market to be rapidly and directly transferred to the token market. This operation comprises two key elements:
SPAC provides compliance access: Utilizing shell companies to resolve compliance issues and open up access to dollar liquidity.
l Financing instruments provide new funds: Through instruments such as PIPE (private equity investment), convertible bonds, or ATM (market-based issuance), listed companies can continuously obtain low-cost funds, forming a continuous buying pressure on on-chain tokens.
Under this architecture, the pricing logic of stock prices changes: the market no longer anchors itself to the price-to-earnings ratio (P/E), but instead focuses on the token's net asset value (NAV) and refinancing capabilities. The stock price effectively becomes a leveraged reflection of the token price.
5.3.2. Typical Path Analysis: Static Treasury and Dynamic Market Making
Depending on the degree of involvement of the project team in the listed company and the different operational goals, the linkage model of small cryptocurrencies presents two different paths: one is the compliant treasury model, which focuses on asset holding; the other is the control-driven model, which focuses on capital games and subjective market making.
As analyzed in the table below, StablecoinX (TLGY) adopts a structured asset mapping model. Essentially, it establishes a highly transparent token vault on Nasdaq. Funds are primarily used to purchase and lock tokens at a discount off-exchange, thus avoiding direct impact on the secondary market. Under this model, stock price fluctuations are relatively smooth, mainly reflecting the true net asset value (NAV) of the underlying assets. The project aims to leverage the compliance of the US stock market to provide traditional institutional funds with a low-threshold channel to allocate core crypto assets, facilitating auditability and supply locking.
Table 7: Comparison of Typical Paths for Cryptocurrency-Stock Linkage Between Smaller Cryptocurrencies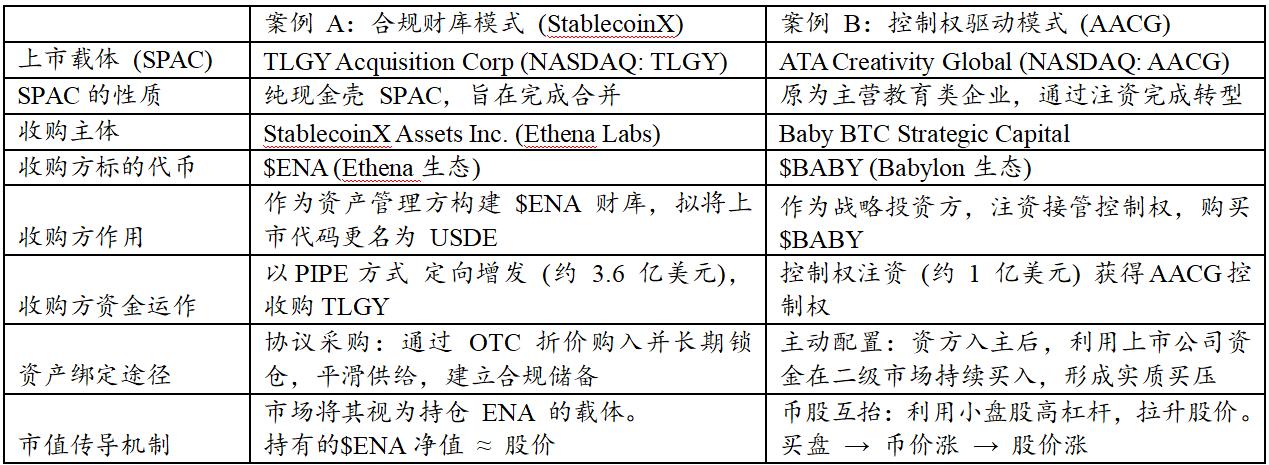
Source: Compiled by PKUBA
The AACG (Baby) case represents actively managed capital market making, i.e., capital-driven liquidity management. External capital gains control of listed companies through investment, quickly converting on-balance-sheet funds into token purchasing power. Due to the small circulating supply of altcoins, concentrated purchases by listed companies can significantly improve the supply and demand of tokens, thereby driving up the price and leading to a revaluation of the stock price. This is a more aggressive strategy that attempts to use the liquidity premium of the capital market to support on-chain assets.
While the two models described above differ in their approaches, they essentially both utilize the listing channel to securitize asset allocation. However, this logic is not without flaws. The key risk of cryptocurrency-equity linkage lies in whether the positive cycle between the asset side and the financing side can be closed. If listed companies merely become one-way buying machines, the high premium will quickly collapse once the secondary market financing window closes or the cryptocurrency price experiences a sharp correction.
Therefore, the most prudent outcome should be that listed companies are not only buyers of tokens, but also builders of the ecosystem. Only by binding corporate strategies with the long-term value of the ecosystem through governance structure can stock prices transform from mere speculative leverage into a compliant indicator that measures the prosperity of the ecosystem.
6. DAT Risk Analysis
6.1. The Cyclical Stages and Differentiation Paths of DAT
The operation of DAT is not a static model, but is simultaneously influenced by two major factors: (1) the cyclical fluctuations in the price of crypto assets, and (2) the premium level of companies holding DAT in the secondary market. Therefore, the key to judging whether a DAT company is sustainable is not "whether it holds DAT", but rather which stage of its life cycle it is in and whether its balance sheet has reserved sufficient safety margin for the next stage.
The table below illustrates the complete lifecycle of DAT. From a lifecycle perspective, the key to success or failure often lies not in the ability to expand during a pro-cyclical period, but in the divergent outcomes after a downturn: During a pro-cyclical period, premium financing is easier to access, and DAT companies can generally expand their balance sheets by leveraging market absorption capacity; however, once a pullback begins, the decline in coin price and the contraction of premiums often occur simultaneously, narrowing or even closing the financing window. At this time, only companies with more stable debt structures and lower short-term rigid debt repayment pressure are more likely to withstand volatility and remain viable; conversely, companies with weaker cash flow and potential disposal triggers may be forced to reduce their holdings in unfavorable price ranges to meet debt repayment or contractual requirements, thus amplifying cyclical fluctuations into liquidation risks.
Table 8: Comparison of DAT Cycle Stages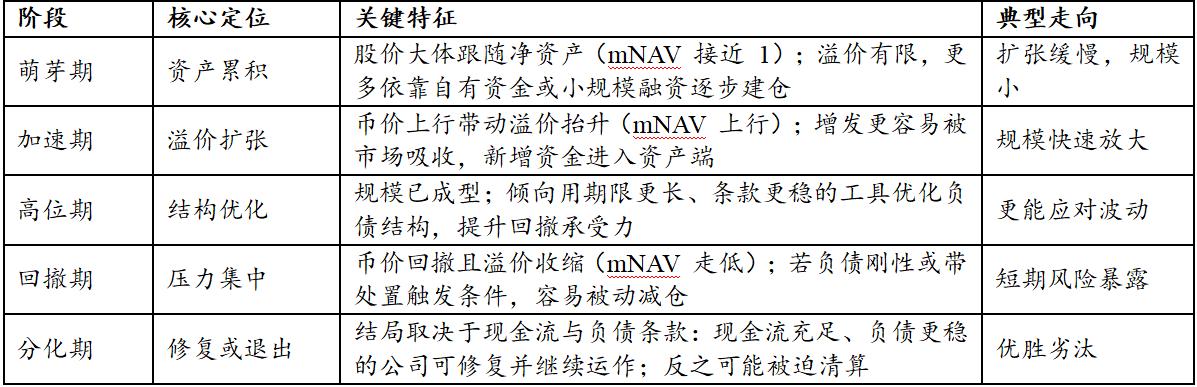
Source: Compiled by PKUBA
6.2. Financing Structure Risk: The Boundary Between Equity and Debt
The financing structure determines DAT's expansion speed and resilience under different market conditions. A well-designed financing structure is largely key for DAT to cope with downward market pressure. During an upward trend, a higher share price makes it easier to open up opportunities for share issuance, allowing new funds to enter the asset side at a lower cost, thereby accelerating expansion. However, once the premium falls, the efficiency of share issuance decreases significantly, external funding supply contracts, and expansion is forced to slow down.
Therefore, the core risk of equity financing lies in the unsustainability of premiums. As compliant cash holding channels such as spot ETFs become increasingly sophisticated, investors' tolerance for DAT premiums depends more on information disclosure, governance, and enforcement discipline, rather than simply on channel scarcity. When mNAV falls back to around 1 or even turns into a discount, further issuance often brings stronger dilution pressure.
The risks of debt financing mainly lie in the accumulation of interest burdens and maturity pressures. While increasing leverage can amplify returns during market upturns, deteriorating refinancing conditions during prolonged corrections may force companies to sell crypto assets to repay debts, translating book volatility into actual selling. Furthermore, if debt financing includes liquidation or forced liquidation arrangements, or is primarily structured with short maturities and high rigidity, it is more likely to trigger passive disposals during downturns, thereby amplifying liquidity pressures and price shocks.
It's worth noting that during a downturn, companies overly reliant on convertible bond financing are easily manipulated by arbitrage funds, creating additional selling pressure on their stock prices. The mechanism is that arbitrageurs typically employ a strategy of "buying convertible bonds and shorting the underlying stock" for hedging. When the stock price falls, to maintain the established hedging ratio, arbitrageurs often passively increase their short selling. This mechanical selling amplifies short-term downward pressure, accelerates the stock price decline, and induces a negative feedback "downward spiral."
Therefore, when designing its financing structure, DAT must find a dynamic balance between equity and debt to avoid the risk of expansion stagnation or chain reaction caused by over-reliance on a single financing method.
6.3. Currency Portfolio Risk: BTC's Macroeconomic Sensitivity and the Paradox of ETH Allocation
As the core asset on the current DAT institutional balance sheet, Bitcoin has long since broken away from its early independent market trend and instead shows a high correlation with the Federal Reserve's liquidity policy. The specific correlation is shown in the figure below, which shows that the MSTR stock price and the BTC price are correlated, and this is subject to the cyclical changes in liquidity.
Figure 7: BTC and stock price performance of companies holding BTC during the Fed's tightening cycle (November 2021 - December 2022)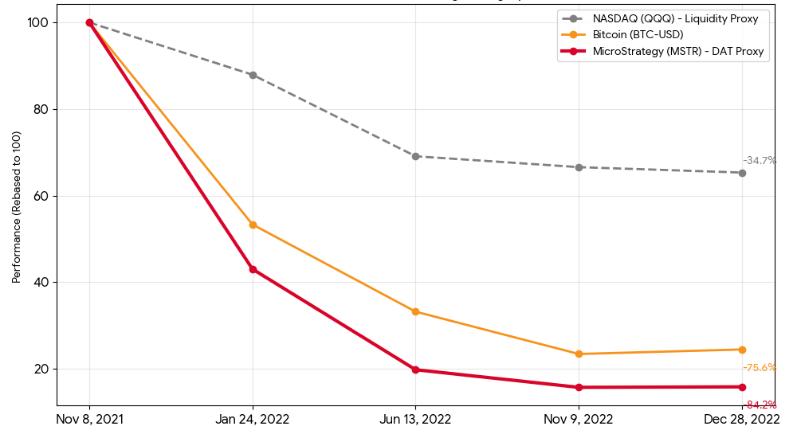
Source: Yahoo Finance Historical Data
For companies with excessively concentrated BTC-DAT holdings, this correlation is a double-edged sword. During periods of monetary easing, it acts as an accelerator of asset appreciation; however, during periods of tightening liquidity, these companies face a more severe "double whammy" effect. That is, when the price of Bitcoin falls, leading to a reduction in net asset value, the market's tolerance for the company's premium will also decrease simultaneously, causing the stock price to fall far more than the price of Bitcoin itself. Even more problematic is that native Bitcoin is a zero-interest asset and cannot generate operating cash flow. This means that during the debt's duration, the company cannot rely on asset-side returns to cover interest expenses on the liability side. This lack of cash flow significantly weakens the company's resilience during downturns.
In contrast, Ethereum's primary challenge has long centered on its regulatory characterization. It wasn't until the end of July 2025, with a substantial shift in the attitude of US regulators and SEC Chairman Paul Atkins' informal confirmation that Ethereum does not fall under the category of securities, that this long-standing legal sword hanging over institutions was finally removed. However, the logic behind its use as a reserve asset remains fraught with contradictions:
From an asset perspective, Bitcoin is scarce digital gold, while Ethereum is more like a highly volatile, growth-oriented technology asset. However, Ethereum's value proposition has an inherent contradiction: as technology upgrades and network efficiency improves, Ethereum's consumption may actually decrease, and this deflationary effect brought about by technological progress weakens price support.
The core contradiction lies in the staking dilemma: without staking, holding Ethereum with zero returns is completely outmatched by Bitcoin in terms of risk-reward ratio; however, staking to obtain 3-4% returns presents challenges such as liquidity lock-up, node penalties, and complex tax compliance. This predicament makes it difficult for Ethereum to replace Bitcoin as the cornerstone of DAT at this stage.
6.4. Core Assessment Indicators: Quantifying Financial Health and Expansion Potential
To grasp the true value creation capabilities and risk profile of DAT companies, it is necessary to establish an evaluation system that goes beyond traditional financial statements, focusing on the following three core dimensions:
First, the market capitalization to net asset value ratio (mNAV): a barometer of financing efficiency. mNAV is not only a valuation metric but also a leading indicator of whether a financing window is open. When mNAV is significantly greater than 1, it indicates that the market is offering a sufficient premium, allowing companies to efficiently raise funds through ATM (off-the-books) offerings or private placements, and acquire assets at a cost lower than the market's implied value, thus achieving a positive capital cycle of "premium for assets." Conversely, if mNAV remains at a discount for an extended period, it signifies the closure of external low-cost financing channels, a loss of expansion momentum in the business model, and even the risk of asset shrinkage.
Second, Bitcoin per Share (BPS): A true measure of shareholder value. This is the ultimate standard for judging the effectiveness of the DAT model after eliminating the impact of equity dilution. Unlike simply the growth of total assets under management (AUM), this indicator reflects whether management's capital operations truly create incremental value for shareholders. A healthy DAT model must ensure that the compound annual growth rate of Bitcoin holdings consistently outpaces the expansion rate of equity. If financing the purchase of Bitcoin leads to a decrease in Bitcoin per share, it indicates that the company's financing costs are too high or its allocation efficiency is low. This "growth for growth's sake" model is essentially destroying shareholder value.
Third, the proportion of unsecured debt and interest coverage ratio: the bottom line for survivability. In the highly volatile environment of crypto assets, the safety of the balance sheet depends on the rigidity of the liabilities. A highly survivable DAT financial structure should strictly limit asset-backed securities with margin calls, and instead rely primarily on unsecured convertible notes or long-term credit bonds. As long as the company's main business cash flow is sufficient to cover interest expenses, and the debt terms do not include early repayment triggers for price declines, the company can maintain the initiative to "trade time" during periods of significant asset price pullbacks, avoiding being forced to collapse before dawn due to liquidity depletion.
7. Analysis of Typical Risk Handling Cases
7.1. Strategy: Cyclical pressures of equity-bond arbitrage and the forward debt wall
Strategy's business model essentially revolves around establishing a cross-market capital arbitrage mechanism, leveraging the price difference between the inefficiency of the fiat currency bond market and the high volatility of digital assets. Its core strategy involves: during periods of market stability, locking in extremely low funding costs using long-term unsecured convertible bonds and safely navigating downturns by avoiding forced liquidation; and during market recovery and uptrends, issuing new shares at high premiums (market-based issuance) to purchase Bitcoin, thereby increasing the Bitcoin content per share and further enhancing its financing capabilities.
While this equity-debt hybrid mechanism has helped the company successfully navigate past cycles, it essentially shifts market risk to two key variables: "the ability to maintain the premium rate" and "the ability to repay forward debts."
7.1.1. Constraints of Premium Rate Fluctuations on Financing Window
The management's capital operations demonstrate a high degree of discipline, with a significant positive correlation between the pace of its share issuance and the premium to NAV in the secondary market. Historical data shows that when the premium is high, the company's issuance volume surges; for example, when the premium exceeded 100% at the end of 2024, its quarterly issuance volume reached a record high. Conversely, when the premium narrows or even becomes discounted (as in 2022 and the second half of 2025), the company decisively suspends or significantly reduces its share issuance.
Figure 8: Correlation between Strategy premium rate and issuance volume (2021-2025)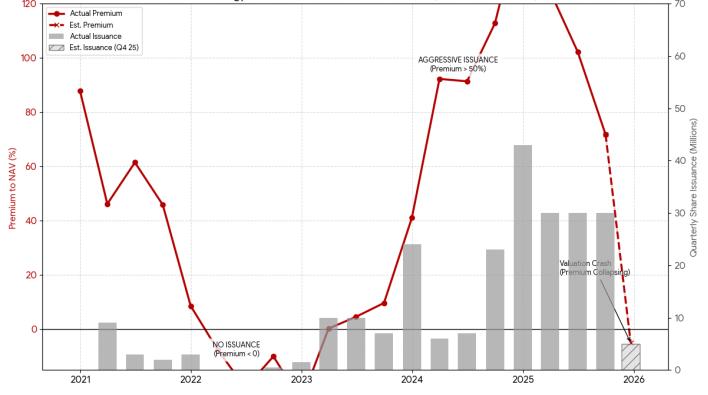
Source: Strategy News and Press Release Archive, SEC
Currently, Strategy is facing the challenge of a significant decline in its premium, with its stock price having retreated nearly 60% from its high. Based on past behavioral patterns, it is expected that the company will cease large-scale share issuance in the last quarter of 2025. This means that the positive cycle supporting the company's asset expansion will face a temporary halt, and the company must wait for market sentiment to recover and drive the premium back to normal. During this period, its balance sheet expansion capacity will be significantly suppressed.
7.1.2. Repayment pressure of forward debt
Although Strategy has no immediate debt repayment pressure, as the debt maturity date approaches, if the stock price is weak and fails to trigger creditors to convert their shares into equity, the company will face a significant cash repayment challenge.
Specifically, the exercise prices of the convertible bonds maturing in 2027 and 2030 are $143 and $150 respectively, which are lower than the current stock price of about $165 and are in a relatively safe range. If the stock price does not fall sharply, these two debts will most likely be converted into equity, which will dilute shareholder equity but protect the company's cash flow.
Figure 9: Distribution of Strategy's Existing Debt Maturities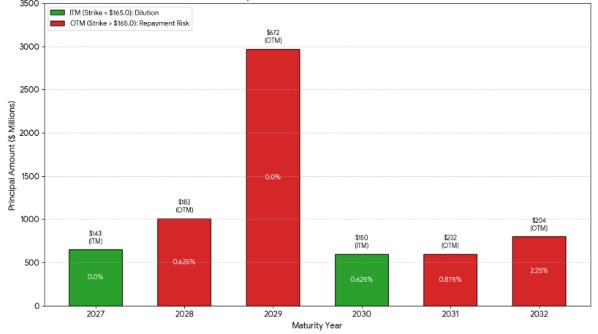
Source: SEC
However, the main risks lie with two debt maturing in 2028 and 2029. These two debts originated from a high-priced issuance in 2024, with exercise prices as high as $183 and $672 respectively, the latter reaching a staggering $2.97 billion. Although these debts currently enjoy a 0% coupon rate, given the significant gap between the exercise price and the current share price, Strategy may face severe debt repayment difficulties if the share price fails to rise significantly in four years.
7.2. Core Scientific: The Painful Lesson of Debt-Driven Cryptocurrency Hoarding and Maturity Mismatch
Unlike Strategy's unsecured financing, Core Scientific's case reveals the devastating consequences of aggressive leverage and maturity mismatch. As the largest Bitcoin mining company in North America, the company relied on a high leverage strategy to achieve rapid expansion in the early stages. The structural flaws in its balance sheet are: the debt side mainly consists of high-interest equipment financing with floating rates and includes strict forced liquidation clauses; while the asset side consists of rapidly depreciating and illiquid mining machines and highly volatile Bitcoin. [5]
Figure 10: Comparison of Core Scientific stock price and BTC price trends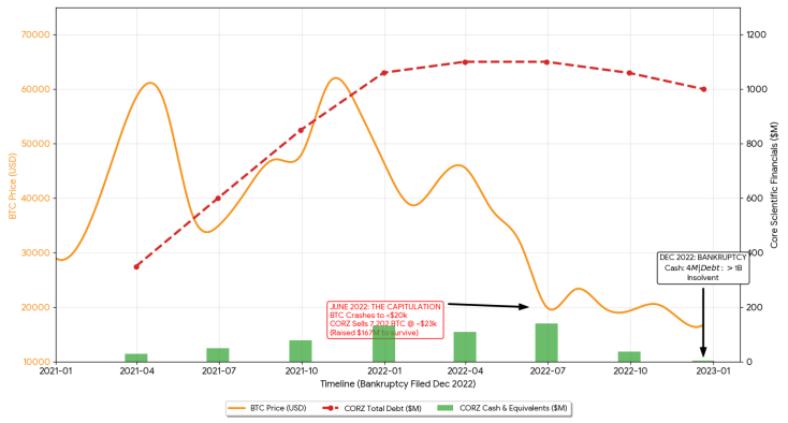
Data source: Business Quant, Dgtl Infra, SEC
During the 2021 bull market, the company's debt ballooned rapidly from approximately $350 million to $1.06 billion by the end of the year. During this period, the company sold almost none of its mined Bitcoin, relying entirely on external financing to cover operating costs and capital expenditures. However, this aggressive strategy resulted in year-end cash reserves of only about $130 million, a very thin safety cushion relative to its massive debt.
The risks finally materialized in June 2022. As the price of Bitcoin fell below $20,000, pressure from creditors forced Core Scientific to engage in a panic sell-off at the bottom of the market. The company was forced to liquidate 7,202 bitcoins at an average price of $23,000, raising only about $167 million. [6] While this move temporarily alleviated the liquidity crisis, it also completely depleted the company's core assets. By the time it filed for bankruptcy protection at the end of 2022, the company still had a high level of debt and only $4 million in cash on hand, ultimately becoming insolvent. [7]
7.3. MARA: A Survival Game Under Equity Dilution
MARA (formerly Marathon Digital), another Bitcoin mining company, demonstrated a different survival path: maintaining survival through extreme equity dilution. Unlike Core Scientific's debt collapse, MARA adopted an ATM (Action-the-Moment) equity financing strategy, that is, continuously issuing new shares on the secondary market to obtain cash to pay for fixed expenses such as electricity bills and to purchase Bitcoin.
Figure 11: MARA Stock Price and Number of Circulating Shares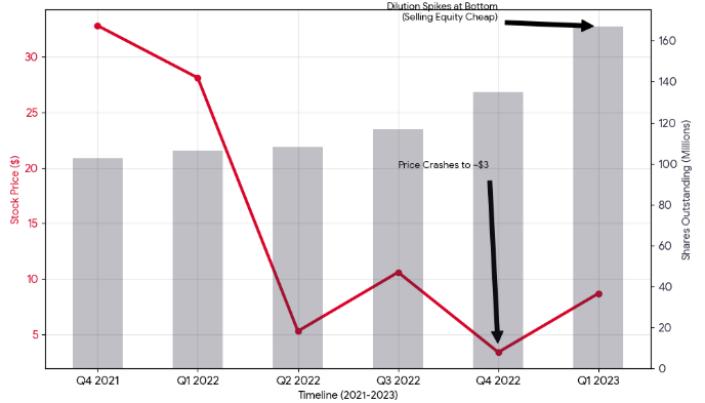
Source: Yahoo Finance Historical Data, SEC
Even in the extreme environment of the 2022 Bitcoin crash and the near disappearance of stock premiums, MARA persisted in raising liquidity through continuous share issuance. While this method preserved the company's continued operation, it severely diluted the equity of existing shareholders. Data shows that in the fourth quarter of 2022, although the stock price had fallen by 95% from its 2021 high, the number of outstanding shares surged against the trend: from 116 million shares in the previous quarter to 135 million shares, and further expanded to 167 million shares in the following quarter, an increase of nearly 60% year-on-year.
Figure 12: Comparison of MARA stock price and monthly trading volume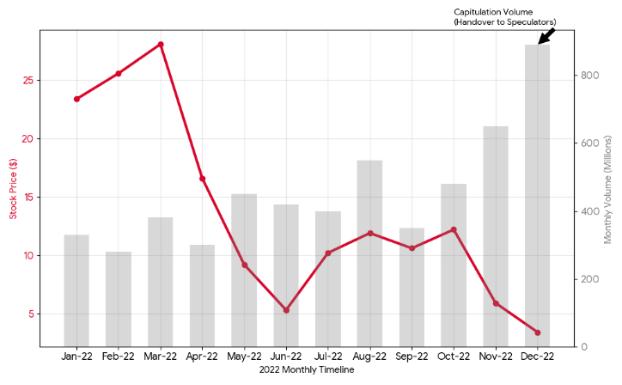
Source: Yahoo Finance Historical Data
The cost of this "equity-for-capital" swap is a complete overhaul of the shareholder structure. Most of the original long-term shareholders chose to cut their losses and leave, replaced by high-frequency trading algorithms, market makers, quantitative funds, and speculative retail investors. The massive trading volume at the end of 2022 is a true reflection of this shareholder reshuffling. The MARA case demonstrates that in a downturn with limited debt financing capabilities, while equity financing may be the last resort, it comes at the cost of sacrificing per-share value and the interests of long-term shareholders.
8. DAT Company Sustainability Analysis and Trend Outlook
8.1. DAT Company Sustainability Assessment Framework: Premium Window, Cash Buffer, Debt Maturity and Terms
Looking back at past cycles, many companies' slowdowns did not begin with a decline in asset prices, but rather with a mismatch between debt maturity and cash flow capacity: price pullbacks turned "book value fluctuations" into "capital constraints," ultimately evolving into passive asset disposals and a comprehensive credit contraction. Therefore, the most effective way to judge whether a DAT company can operate across cycles is not by the size of its cash holdings, but by three hard constraints—premium, cash, and financing terms.
First, the premium window: mNAV determines the speed of balance sheet expansion and the sustainability of financing. mNAV is not just a valuation metric, but also directly reflects the economic viability of equity refinancing. When mNAV is significantly higher than 1, companies can issue equity instruments at relatively favorable prices, converting external funds into new assets, thereby maintaining the pace of balance sheet expansion. When mNAV is consistently close to 1 or even turns into a discount, further issuance often amounts to diluting existing shareholders, significantly reducing the marginal returns of financing, and expansion naturally becomes more conservative. Meanwhile, with the gradual popularization of compliant cash-holding tools such as spot ETFs, the market's tolerance for DAT premiums relies more on information disclosure, governance quality, and enforcement discipline, rather than solely on the narrative of "scarcity of compliant channels."
Second, cash buffer: The ability to cover interest and necessary expenses is more crucial than the book value of cash. The role of cash is not to increase profits, but to ensure the company's operational safety and timely payment of interest and necessary expenses during periods of closed financing windows or extreme market conditions. For DAT (Digital Assets and Technologies), the core test of "survival" often occurs after a prolonged period of unfavorable market conditions—that is, whether there is still sufficient cash and available credit to cover fixed expenses, and whether interest and operational pressures will force the company to dispose of core assets at low prices. The availability of cash and credit determines whether the company reacts passively or proactively during a downturn.
Third, term and terms: Does the debt leave the company time to recover? Debt risk comes not only from interest rate levels, but also from concentrated maturity, deteriorating refinancing conditions, and whether there are triggering arrangements such as liquidation or forced disposal: (1) The pressure of ordinary debt mainly comes from the accumulation of interest and the uncertainty of refinancing upon maturity; (2) Convertible bonds may lose the expectation of conversion during the sideways or downward phase, thus presenting pressure closer to "rigid repayment upon maturity". The term structure and triggering terms often determine whether the company can get through the cycle during the pullback period or is forced to dispose of core assets at a low level.
In summary, DATs with stronger survivability typically share two common characteristics: First, on the liability side, they avoid mortgage loans with mandatory disposal triggers, relying more on unsecured convertible bonds or equity financing to ensure that the disposal rights of core assets are not squeezed by the terms; second, on the cash side, they either have a continuous supply from their main business or, in favorable environments, lock in longer-term, lower-cost funds in advance to prevent interest expenses from rapidly consuming cash. Ultimately, the long-term competitiveness of DATs is more reflected in their financial management capabilities: a meticulous control over the cost of capital, maturity structure, and liquidity.
8.2. Trend Outlook: From Expansion Narratives to Survival Tests
With the industry entering a full-blown downturn in 2026, DAT (Data Technology, Alibaba, Tencent) companies will face a survival test. Based on their current situation, this article offers the following four perspectives.
8.2.1. Reshaping the Core Proposition: From Procyclical Expansion to Cross-Cycle Survival
The pullback since the second half of 2025 has shifted DAT's focus from "pro-cyclical balance sheet expansion" to "cross-cycle operations." When the price decline and valuation premium shrink simultaneously, the pressure on companies does not primarily stem from unrealized losses, but rather from the combined effects of liquidity and contractual constraints: interest expenses and maturity structures determine the elasticity of the cash flow, while tightening refinancing conditions translate price volatility into the real risk of forced asset disposal. At this point, the watershed in competition lies not in the size of cryptocurrency holdings, but in whether companies can maintain room for maneuver when valuations converge, and whether they can sustain operations during financing lulls and avoid being forced to dispose of core assets at low prices.
Within this framework, sustainability assessments can be reduced to three more actionable questions: First, can cash and available funds cover fixed expenses for a future period, especially interest and necessary operating costs? Second, are liabilities concentrated in maturing, and are there trigger clauses highly sensitive to price declines, thus amplifying risk during pullbacks? Third, when mNAV begins to approach 1 or turns into a discount, does the company still have feasible financing and asset management plans, rather than simply waiting for a market reversal? Only when all three points are met simultaneously can the company be considered to have the basic qualifications to "weather the storm until the next window."
8.2.2. Valuation Model Shift: Premium Scarcity and Functional Pricing
The widespread adoption of spot ETFs has diminished the role of DAT as a "compliant cash holding channel," making DAT valuation premiums even scarcer. For DAT companies to maintain their market capitalization premium, they must provide elements that ETFs cannot easily replace: more credible fundraising capabilities, clearer asset management discipline, and more verifiable risk control and information disclosure. The more likely scenario for DAT companies going forward is a shorter premium window and a longer discount period; only companies whose governance, custody, disclosure, and fundraising discipline are consistently recognized by the market are more likely to see stable premiums.
Meanwhile, even with similar underlying asset sizes, the mNAV of different companies will diverge in the long run because the market directly incorporates "company quality" into the price: the reliability of financing capabilities, the restraint of decision-making, the soundness of capital structure, and the transparency of execution will all translate into valuation differences. Companies lacking a clear value-added path and existing merely as "shadow ETFs" will see their premiums disappear and are more likely to slide into discounts; while entities that are more mature in their terms, terms, and instrument selection, and consistently maintain transparent disclosure and verifiable processes, are more likely to retain their financing opportunities.
8.2.3. Divergence of Underlying Assets: Consensus Pricing of BTC and Strategic Returns of ETH
From an asset perspective, BTC-type DATs have the advantage of lower interpretation costs and a more unified pricing framework, making it easier to obtain longer financing windows; during pullbacks, the market questions the underlying asset less. However, their weaknesses are also more direct: the lack of a native revenue path makes companies more sensitive to the timing and cycle of financing; if financing and balance sheet expansion occur at high levels, subsequent price pullbacks will more easily expose maturity and cash flow pressures. Furthermore, strategy homogenization compresses management premiums, making stock prices more likely to degenerate into an amplified reflection of the underlying asset's volatility.
The potential of ETH-based DATs primarily stems from yield and strategy selection, but this comes with higher compliance, disclosure, and execution requirements. The market will pay closer attention to whether the custody arrangements are clear, whether the source of returns is traceable, whether risk isolation is adequate, and whether on-chain operations are verifiable. The more complex the asset, the higher the requirements for transparency and process verifiability; the ability to clearly explain and consistently deliver on "how assets are managed, how returns are generated, and how risks are controlled" will directly determine its pricing potential and financing availability.
8.2.4. Industry Endgame Prediction: Intensified Matthew Effect and Tail Clearing
DAT as a capital market strategy will not disappear, but the key to success will shift from "whether you can continue to buy" to "whether you can maintain the option under different market conditions".
When premiums become scarcer and financing becomes more selective, scale and reputation translate into real advantages: leading companies are more likely to secure financing when the window opens, obtain longer funding terms, and are better positioned to use a more robust combination of tools to defer pressure and improve their survival rate across economic cycles. Conversely, smaller companies that rely primarily on continuous share issuance to maintain liquidity, even if it doesn't break down in the short term, often do so at the expense of per-share value, leading to frequent changes in shareholder structure, increased difficulty in valuation repair, and ultimately, greater marginalization by the market.
Ultimately, companies that can weather economic cycles are usually not the most aggressive expanders, but rather those that are more restrained when premiums are high and more stable when premiums are low: they avoid excessive financing, maintain flexibility in debt and cash flow management, and ensure transparency and verifiability in custody and on-chain operations. In the future, the market will use stricter terms and less emotional premiums to continuously filter out a few DAT companies with long-term sustainability.
References
[1] Bitwise Asset Management & Hougan, M. (2025, October 17). Crypto Market Review (Q3 2025). Bitwise Investments.
[2] Owens, W. (2025, July 30). The rise of digital asset treasury companies (DATCOs). Galaxy. https://www.galaxy.com/insights/research/digital-asset-treasury-companies
[3] TechFlow. (August 14, 2025). The Future Trend of Cryptocurrency from the Perspective of "Crypto-Stocks". TechFlow TechFlow. https://www.techflowpost.com/zh-CN/article/27575
[4] Ma, M. (2025, December 4). Bubble burst? MSTR: A liquidity crisis more brutal than Bitcoin's crash. TradingKey.
[5] Core Scientific. (2022, March 7). Core Scientific announces preliminary 2021 financial results, 2022 operating guidance and February updates. Core Scientific Investor Relations
[6] The Block. (2022, July 5). Core Scientific sold 7,202 bitcoin in June, generating $167 million.
[7] Zhang, M. (2022, December 21). Core Scientific – Chapter 11 bankruptcy filing in-depth. Dgtl Infra.


