

This is the MOVE, which measures U.S. bond market volatility.
It's making new cycle lows for the bull market in equities.
This is the chart of the MOVE, but here's where it gets interesting...
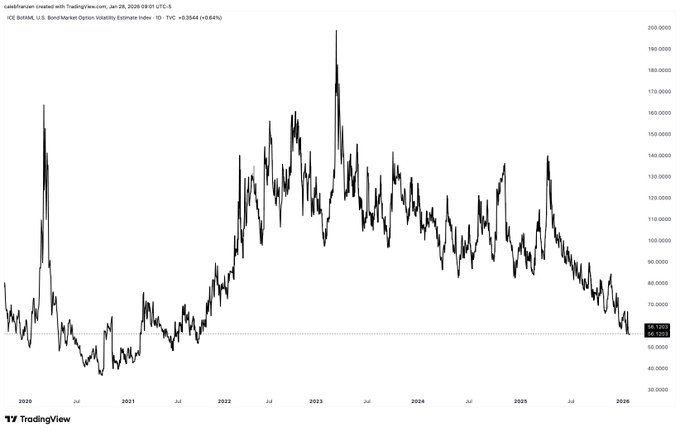
Lower bond market volatility is great for stocks.
So we can invert the MOVE, then add the S&P 500 in the lower pane.
It's crystal clear.
The magnitude of the moves are different (of course), but the directional correlation is extremely clear if you look for 5 seconds.
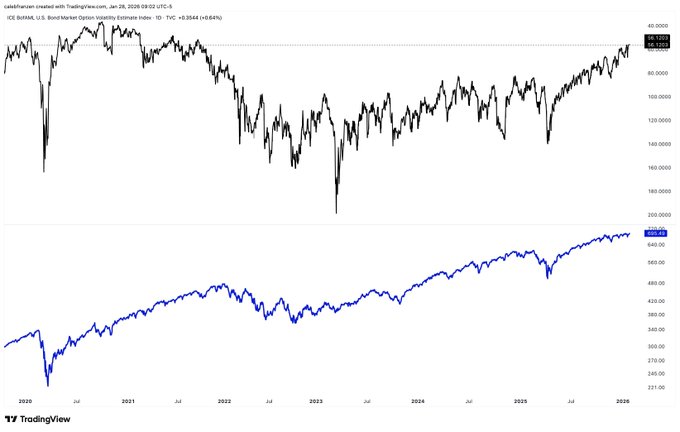
Are they perfectly correlated?
No, of course not.
But all else being equal, the decline in bond market volatility is reaffirming the health of the uptrend in equities.
Sometimes, it's really that simple.
From Twitter
Disclaimer: The content above is only the author's opinion which does not represent any position of Followin, and is not intended as, and shall not be understood or construed as, investment advice from Followin.
Like
Add to Favorites
Comments
Share
Relevant content


