Bitcoin isn’t in the mood for fireworks today. With price holding at $87,867, the market cap clocks in at a sturdy $1.75 trillion, and 24-hour trading volume stands at a healthy $47.44 billion. The intraday range between $87,640 and $90,315 shows traders are tiptoeing between key levels without much conviction. Volatility is tightening, momentum is sagging, and price structure is hinting at a bigger move—but the charts aren’t spilling the secret just yet.
Bitcoin Chart Outlook
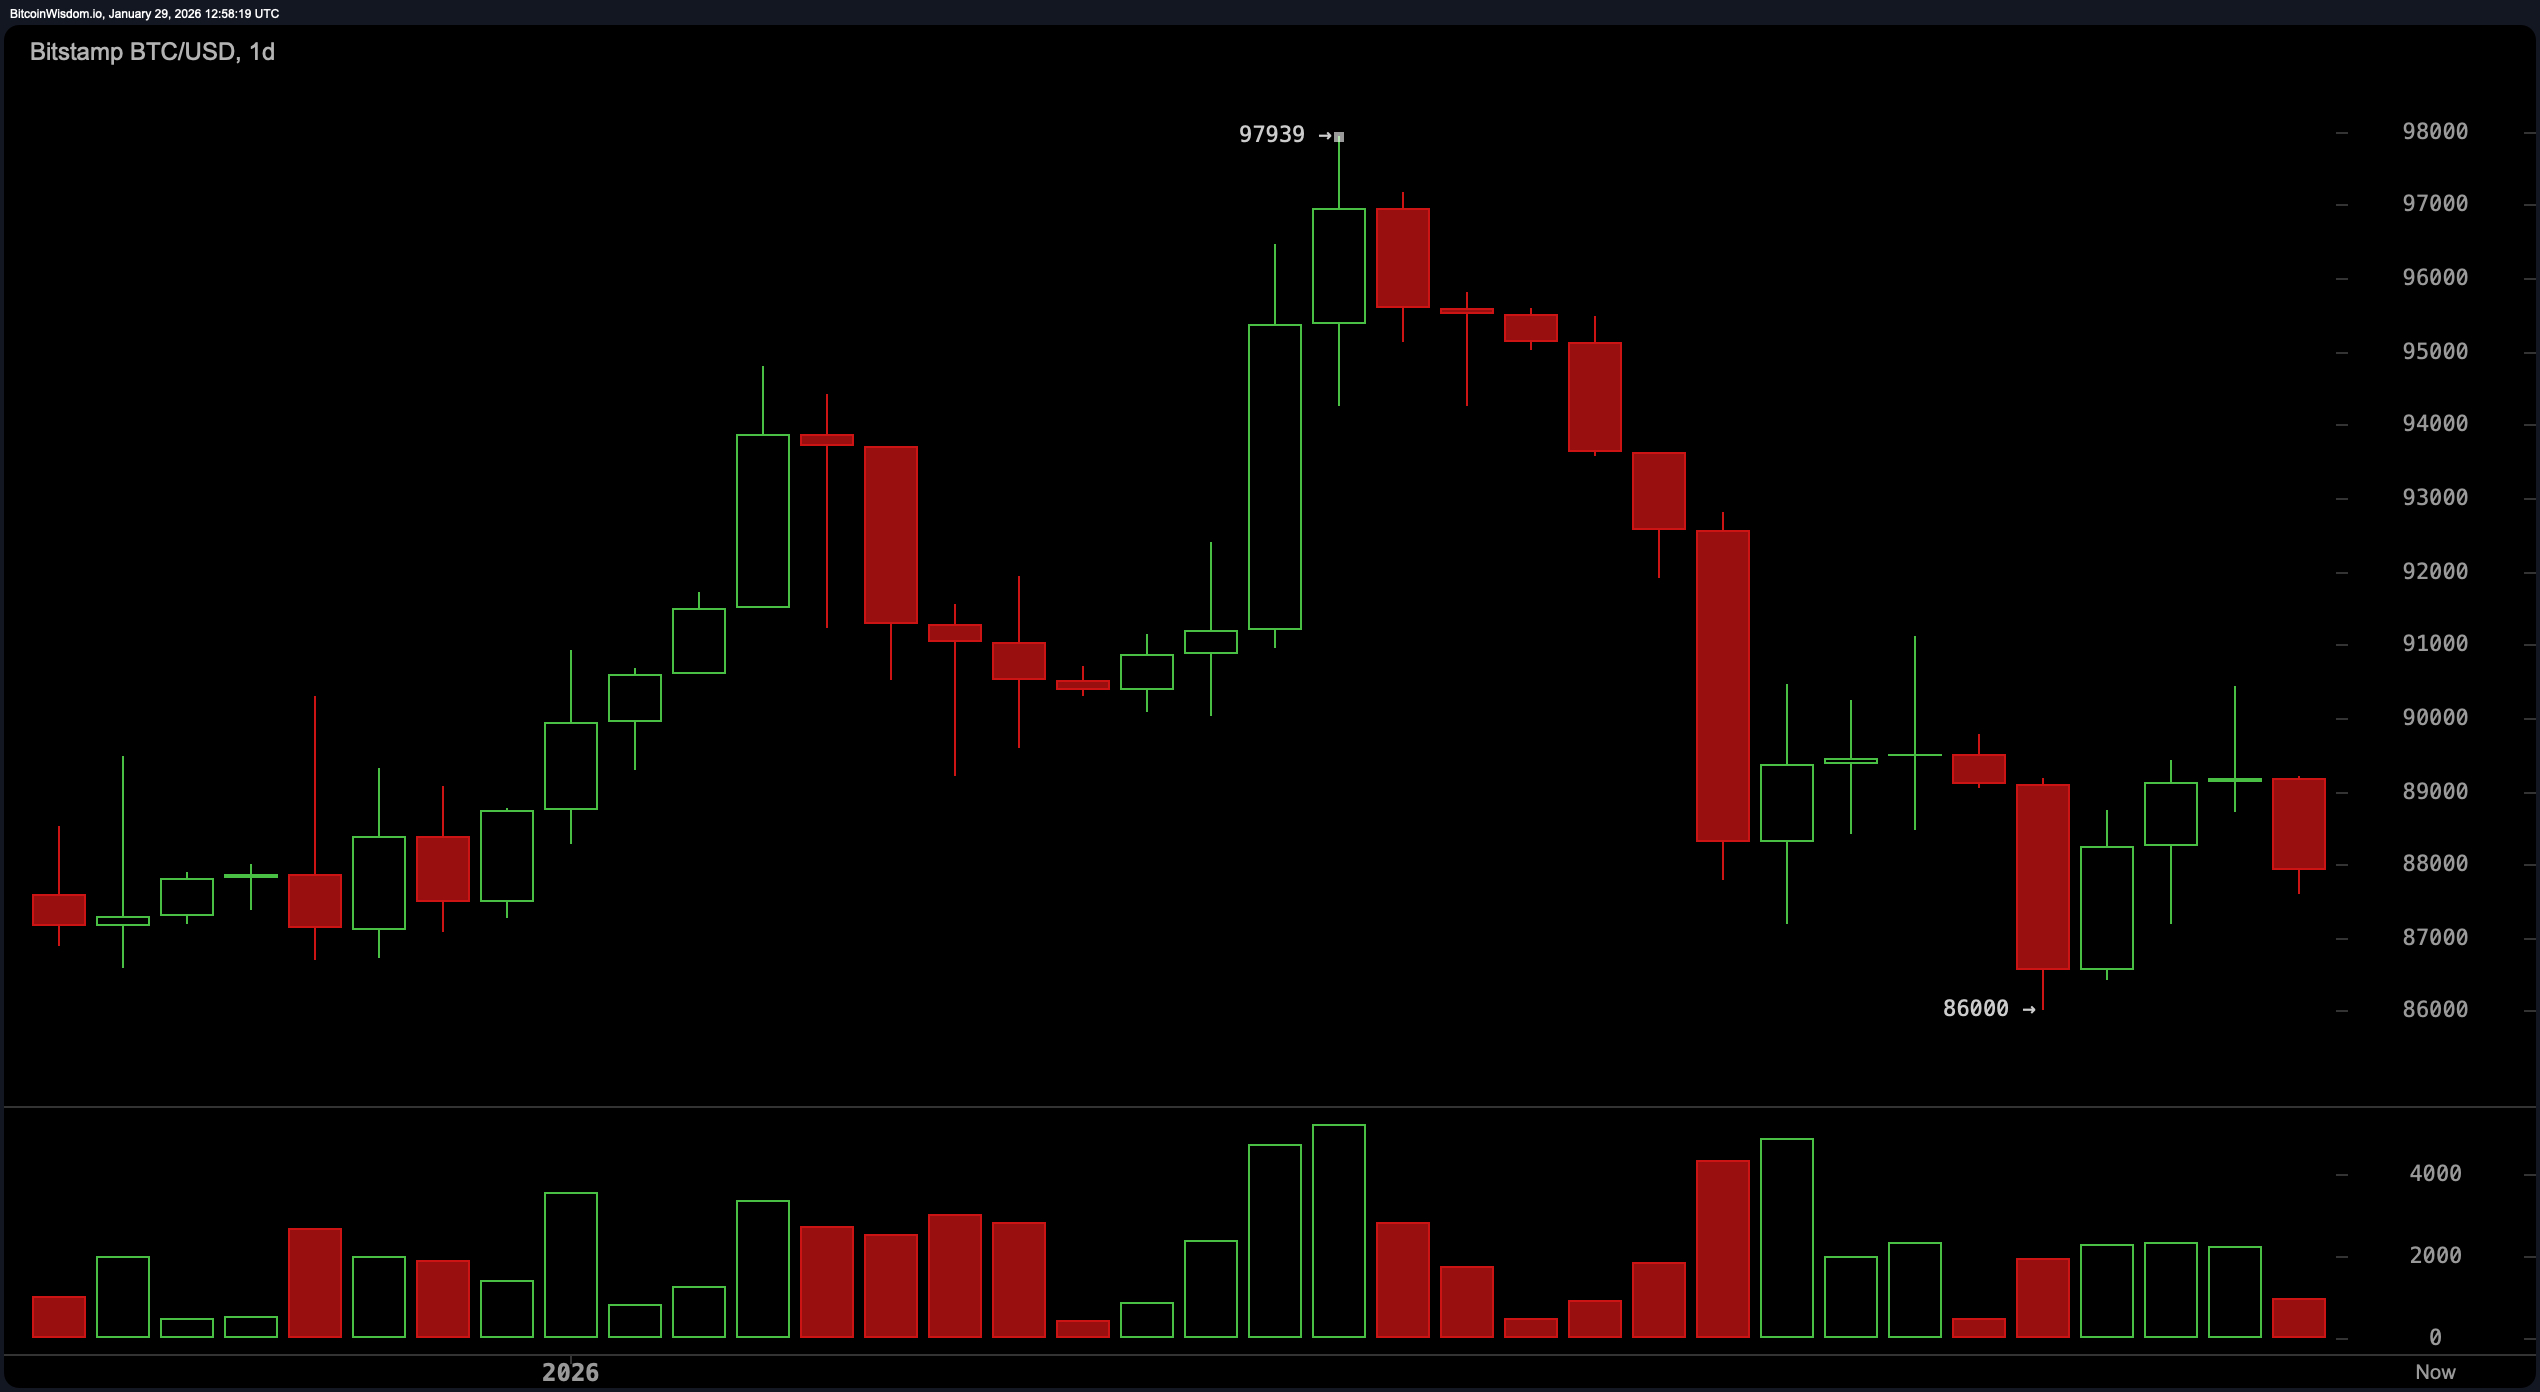
Across the daily chart, bitcoin is caught in a short-term corrective phase inside a broader sideways shuffle. The sharp rejection near $98,000 sent prices cascading to $86,000, where they have since found some footing.
However, the recovery feels hesitant, failing to reclaim the $92,000 to $93,000 resistance range—an area that once offered support but now functions more like a velvet rope. While $86,000 remains a structurally critical level, any decisive breakdown below it would pull the plug on the current base-building narrative.
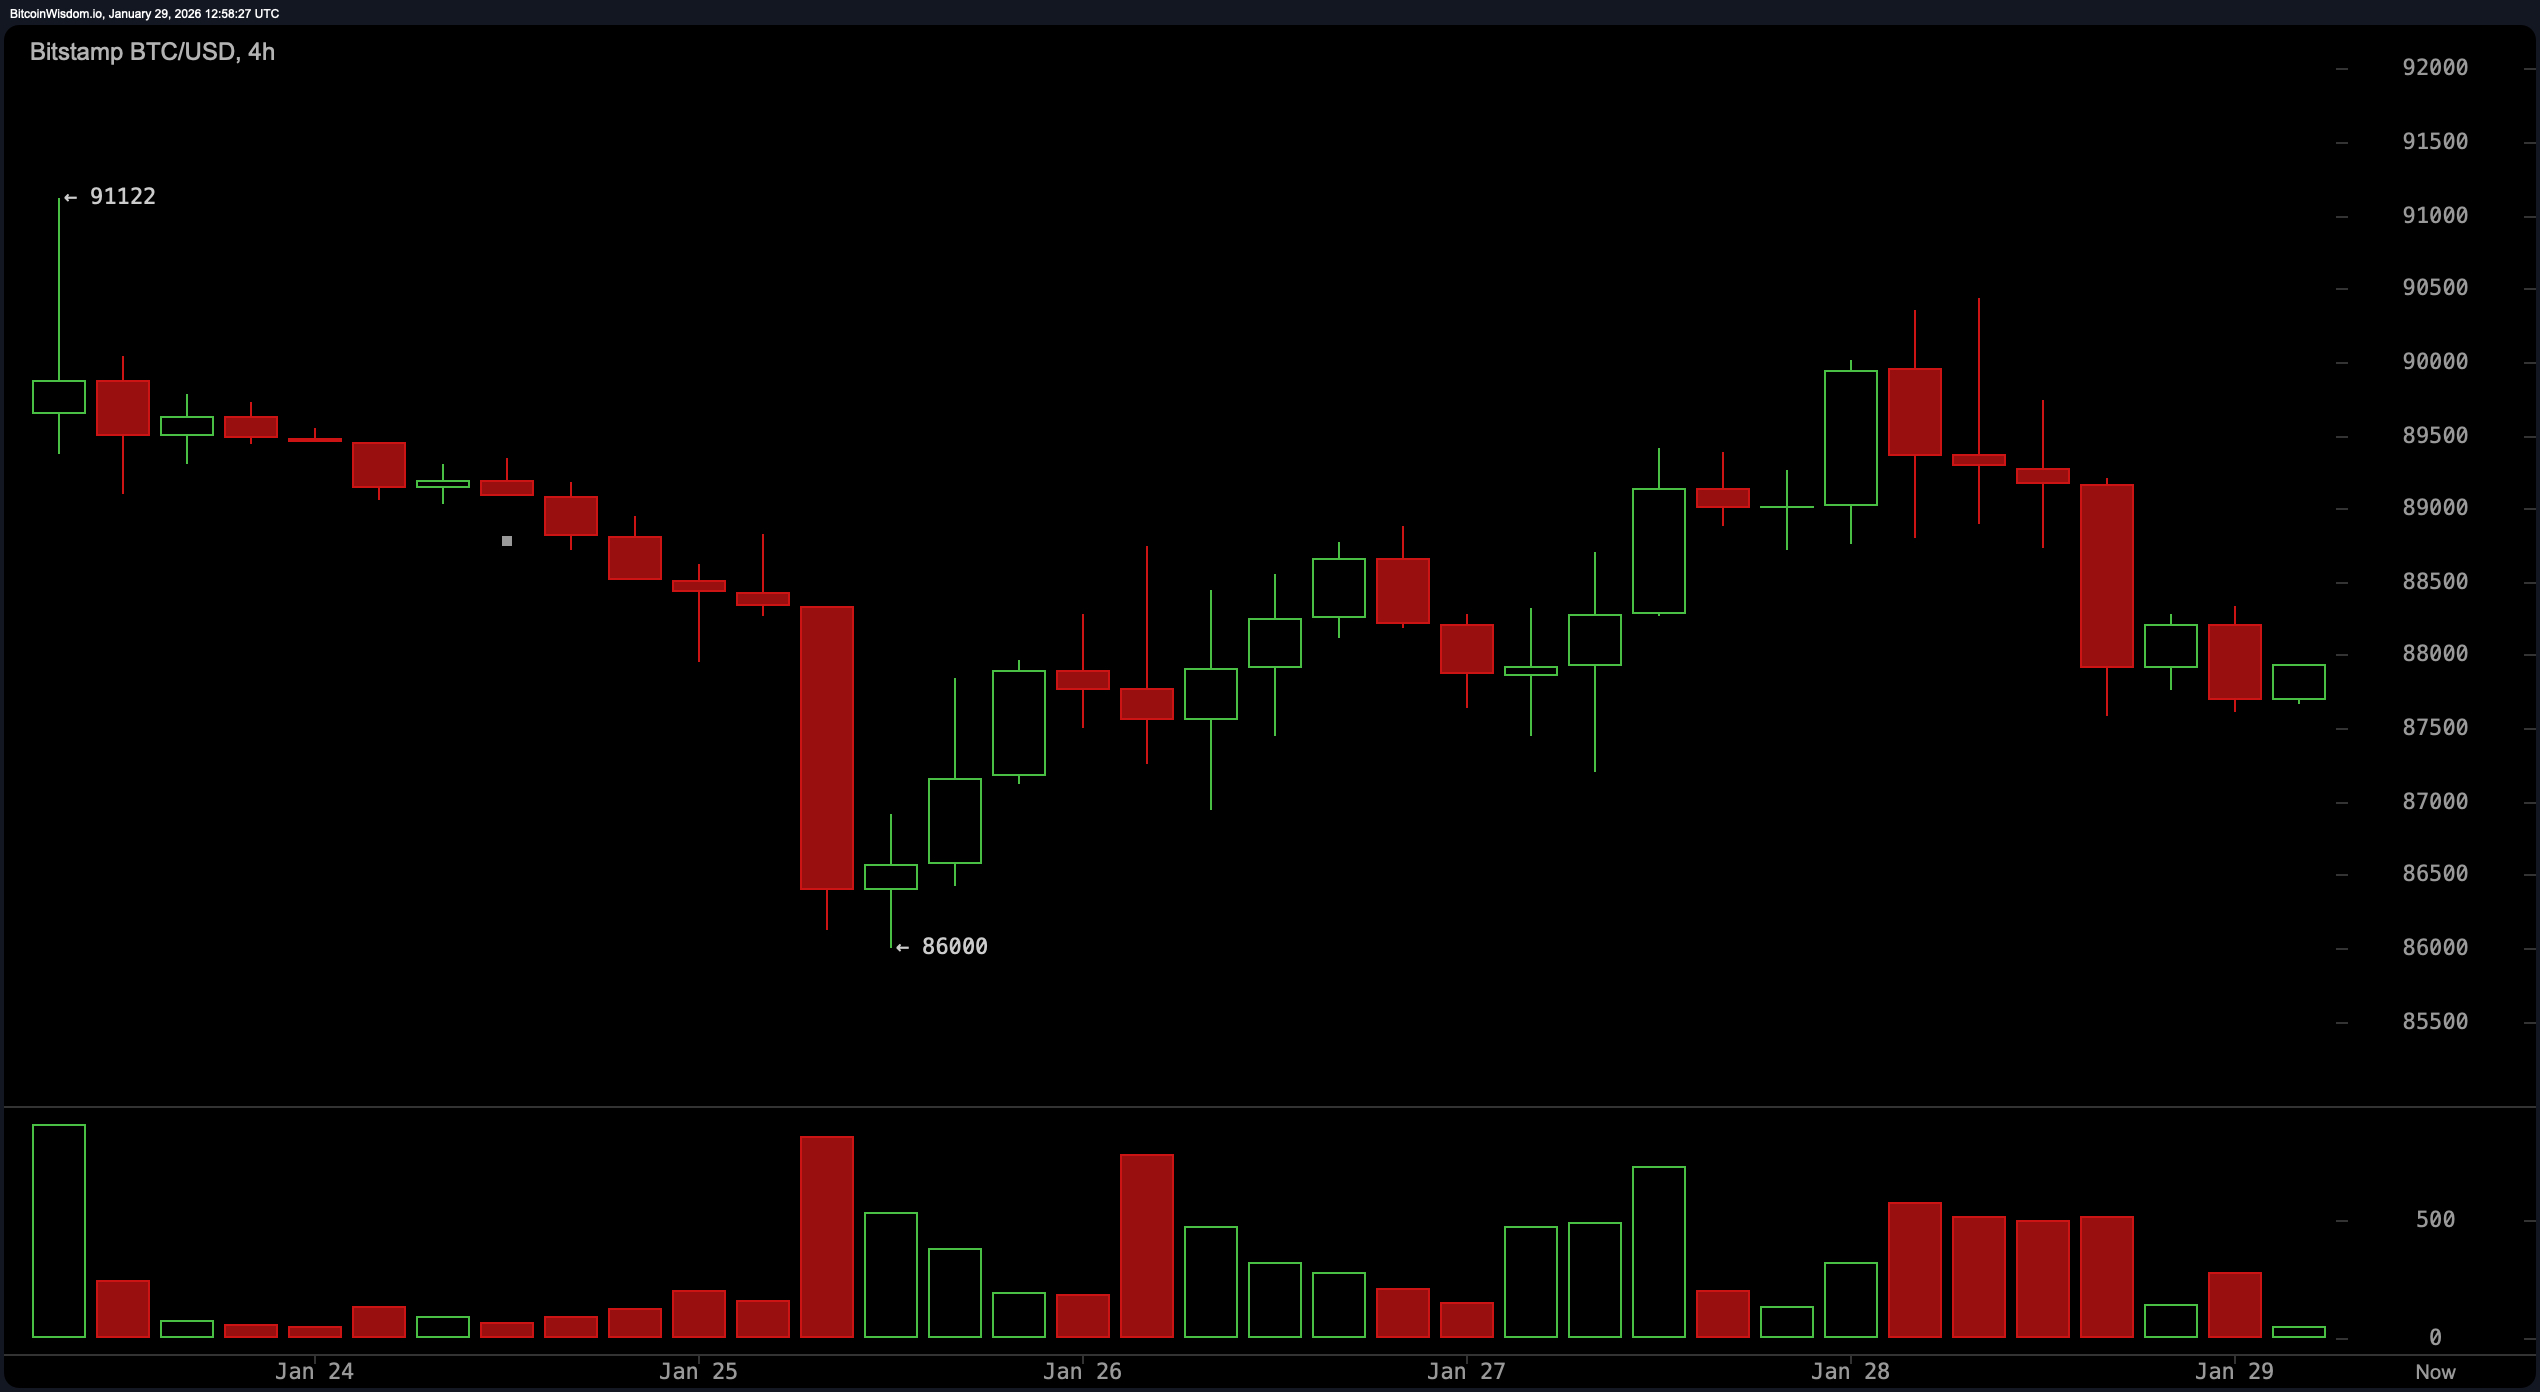
On the 4-hour chart, things remain range-bound, and the price action is giving more whiplash than direction. A bounce from $86,000 sparked brief optimism, but it petered out just below the $91,000 mark. Volume patterns confirm the skepticism: selling was heavy during the breakdown, but the rebound lacked punch—classic signs of a corrective move rather than a trend reversal. As long as bitcoin stays trapped below $92,000, bulls will find it hard to push their agenda, while bears are lurking just above to pounce on weak rallies.
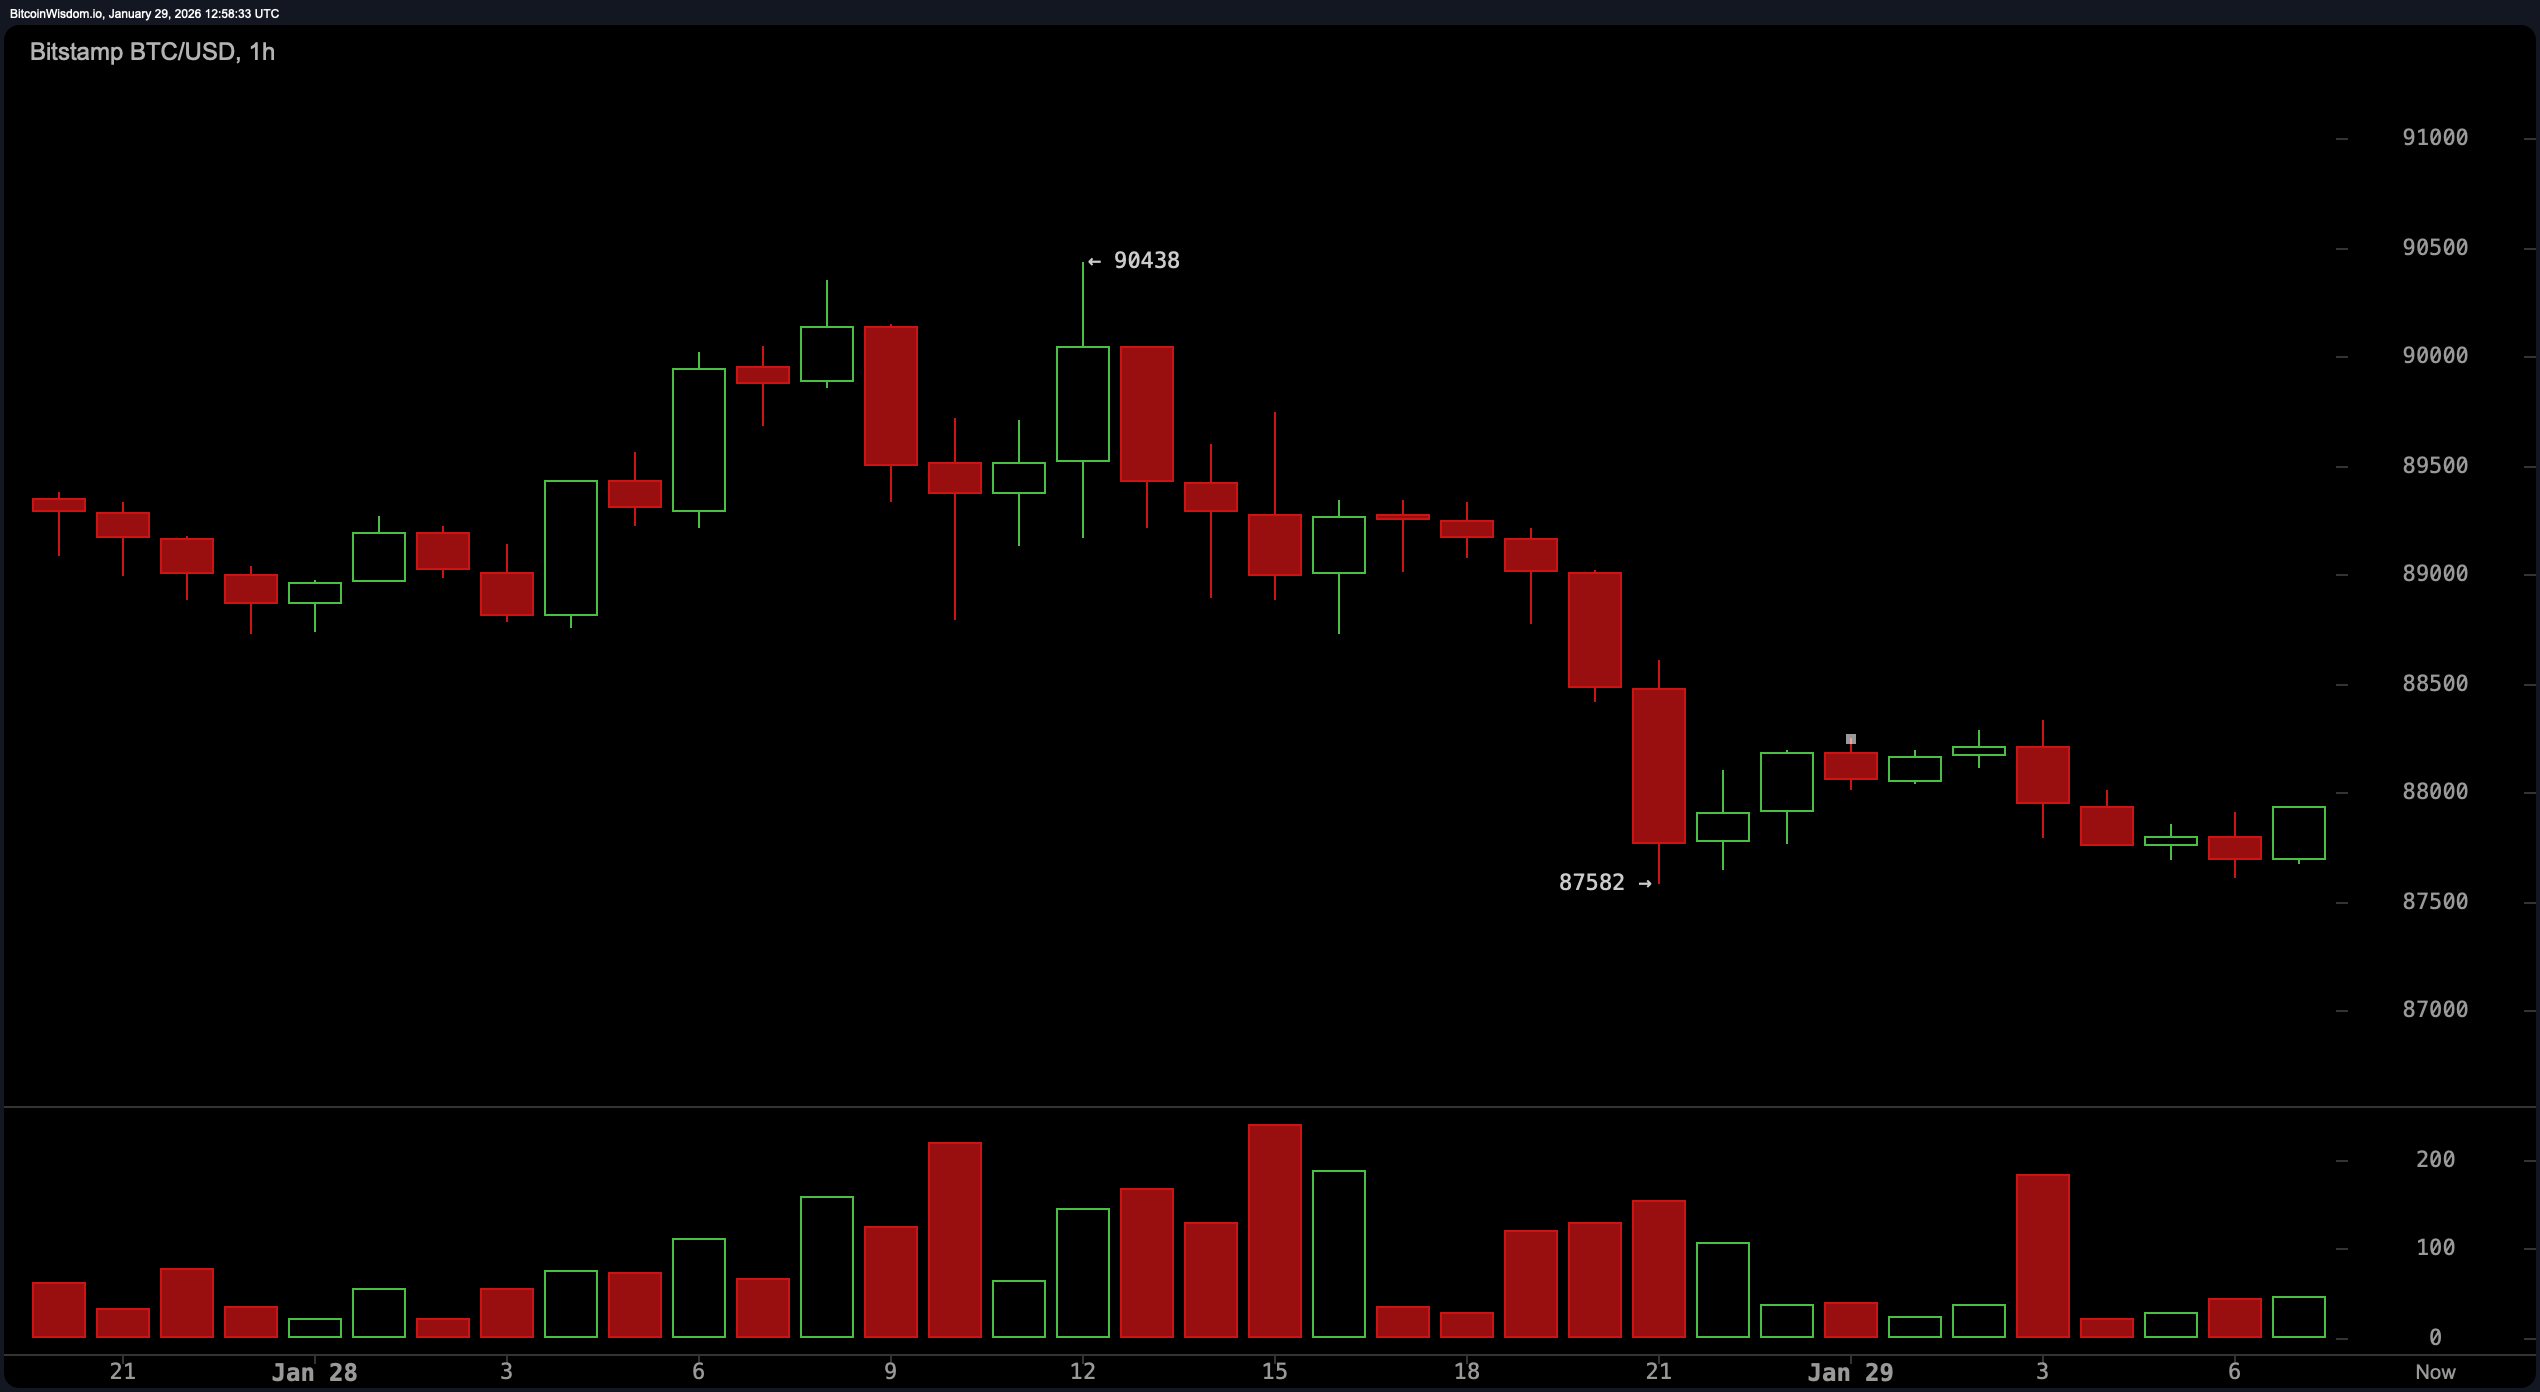
The 1-hour chart takes the indecision and wraps it in a tight bow of consolidation. Price is meandering between $87,500 and $88,800, flirting with support but refusing to commit to a breakout. The presence of weak higher lows hints at some buyer interest, but without a strong move past $89,500, it all feels like shadowboxing. Conversely, a break below $87,300 would likely trigger a revisit to the $86,000 level, and the tension here is palpable—like the moment before a cork pops.
Turning to the daily chart oscillators, most indicators are about as noncommittal as a first date. The relative strength index ( RSI) at 41.7, stochastic at 24.6, commodity channel index (CCI) at -79.2, average directional index (ADX) at 23.4, and awesome oscillator at -2,379.6 all suggest a wait-and-see mode. Meanwhile, momentum sits deep in the red at -4,686.0, and the moving average convergence divergence ( MACD) level rests at -769.2, pointing to a potential underlying shift that just hasn’t manifested—yet.
The moving averages (MAs) don’t offer much comfort either. Every single one—yes, from the 10-period exponential moving average (EMA) at 89,227.6 to the 200-period simple moving average (SMA) at a lofty 104,544.0—is hovering above the current price and signaling downside pressure. It’s a clean sweep of pessimism across all short, medium, and long-term timeframes, reinforcing the notion that bitcoin needs to punch back above $92,000 before anyone starts rewriting the bull thesis. Until then, the road ahead looks more like a grind than a sprint.
Bull Verdict:
For the optimists in the room, the case hinges on one critical outcome: hold above $86,000 and reclaim $92,000 with authority. Only then can bitcoin mount a credible push toward the $97,000–$98,000 region, rewriting the short-term structure and reawakening upward momentum. Until that scenario unfolds, bullish ambitions remain more wish than reality—hanging in the balance like a candle with no follow-through.
Bear Verdict:
Bears have the upper hand as long as bitcoin continues to fumble below $90,000. Failure to hold the $87,000 level—let alone $86,000—could open the trapdoor for a deeper dive, possibly targeting previous demand zones in the low $80Ks. With every moving average leaning south and momentum indicators flashing fatigue, the downside scenario carries the cleaner technical structure and a louder voice in the current setup.
FAQ ⏱️
- What is bitcoin’s current price? Bitcoin is trading at $87,867 as of January 29, 2026.
- What key support level should traders watch?$86,000 is the critical support level that could trigger further downside if breached.
- What resistance is capping bitcoin’s upside?The $92,000–$93,000 zone is blocking upward momentum.
- Is bitcoin trending up or down?Bitcoin remains range-bound with bearish pressure dominating short-term charts.