

This article is machine translated
Show original
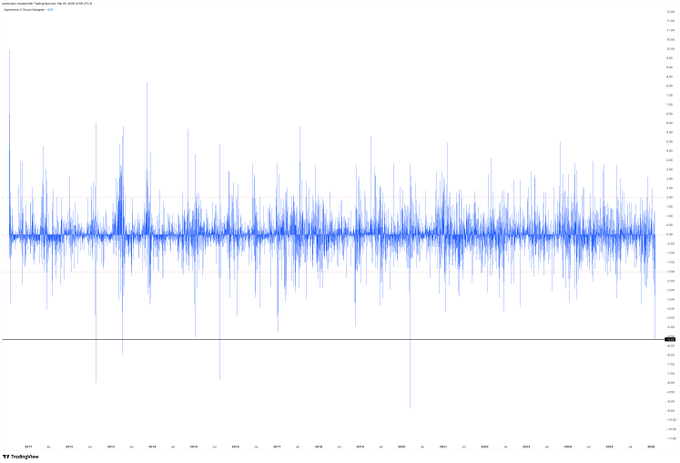
This morning's BTC drop, calculated over a 200-day retracement period, reached -5.65σ.
You might ask: what exactly does 5.65 standard deviations mean?
Let's start with something you might have heard of: Six Sigma.
This is the highest quality control standard in global manufacturing.
Companies like Toyota, Intel, and Samsung have spent decades striving to achieve a quality control level of six standard deviations. In industry, six standard deviations means allowing only 3.4 defects per million iterations.
In other words, this is the definition of "almost impossible" by human industrial civilization.
Yesterday's BTC volatility was only 0.35 standard deviations away from this "industrially impossible" scenario. Using a normal distribution, the probability of a -5.65σ event occurring is approximately one in a billion.
Of course, financial markets don't perfectly conform to a normal distribution; the fat-tail effect makes extreme events more frequent than theoretically possible.
Even considering this, since BTC trading began (July 14, 2010), this level of volatility has only occurred four times, accounting for a mere 0.07% of all trading days.
If you were watching the market this morning, congratulations. You witnessed an event that is statistically "almost nonexistent." Even the deep bear markets of 2018 and 2022 didn't see such a rapid decline over a 200-day rolling period.
This is a fatal test for all quantitative strategies.
Because the essence of quantitative trading is to build price prediction models based on historical data. BTC's history of truly active trading volume and sufficient data for modeling only began around 2015.
The vast majority of quantitative models on the market are based on data from this period. No one can predict what hasn't happened.
A drop exceeding 5.65 standard deviations, excluding this instance, has only occurred three times in history. One of those was the flash crash on March 12, 2020, which was considered an outlier.
The remaining two instances occurred before 2015, in the prehistoric era before quantitative models could even model them.
In other words, after Bitcoin became a trillion-dollar asset, this level of volatility is virtually unprecedented.
CoinKarma's quantitative strategy is no exception; this time, there's a significant floating loss on paper. But we're still alive because our leverage has always been kept very low, only 1.4x, with a drawdown of 30%.
Every extreme market condition is tuition. But you have to survive to be eligible to pay that tuition.
These absolute outliers, contract data, and on-chain data are all invaluable resources for future risk management models.
Only by surviving can you evolve.

◢
@joemccann
02-06
-5.65 Standard Deviations.
We just witnessed a -5.65σ move in $BTC using a 200-day lookback.
To put that in perspective, this volatility profile has only been reached 4 times since inception (July 14, 2010) or 0.07% of all trading days since inception (July 14, 2010)
Another event of epic scale 👀
Sector:
From Twitter
Disclaimer: The content above is only the author's opinion which does not represent any position of Followin, and is not intended as, and shall not be understood or construed as, investment advice from Followin.
Like
Add to Favorites
Comments
Share


