
The BMNR stock price hovered at the crucial support level of $20 as BitMine continued to accumulate Ethereum, and its fundamentals improved.
- BitMine’s stock price has formed a falling wedge pattern, pointing to a rebound.
- Data shows that Ethereum’s transactions and network fees have soared recently.
- The supply of $ETH tokens in exchanges has continued falling this month.
BitMine stock has retreated by over 85%from its highest level in July last year. It is also slowly forming the highly bullish falling wedge pattern, pointing to a strong rebound.
In a statement, Tom Lee’s BitMine said that it continued to buy Ethereum ($ETH) tokens last week, bringing its total holdings to over 4.326 million. It also holds 193 Bitcoin ($BTC) and nearly $600 million in cash. Its other assets include $200 million in Beast Industries and $19 million in Eightco Holdings, a company that has invested in Worldcoin.
🧵
— Bitmine (NYSE-BMNR) $ETH (@BitMNR) February 9, 2026
1/
BitMine provided its latest holdings update for February 9th, 2026:
$10.7 billion in total crypto + "moonshots":
– 4,325,738 $ETH at $2,125 (@coinbase)
– 193 Bitcoin ($BTC)
– $200 million stake in Beast Industries @MrBeast
– $19 million stake in Eightco Holdings (NASDAQ:… pic.twitter.com/MR6hWu8lio
BitMine stock may ultimately benefit from Ethereum’s fundamentals, which have continued improving in the past few months, with third-party data showing relentless growth. Ethereum transactions, fees, and active addresses have continued to soar over the past few months, a trend that has accelerated after the Fusaka upgrade.
More data show that the amount of staked Ethereum continues to rise. The staking queue has jumped to over 4 million coins, with entry rising to over 70 days. Rising staking inflow is a sign that demand continues rising.
At the same time, data show that the supply of $ETH tokens on exchanges has continued to fall and is now at its lowest level since 2016.
BMNR stock price prediction: Technical analysis
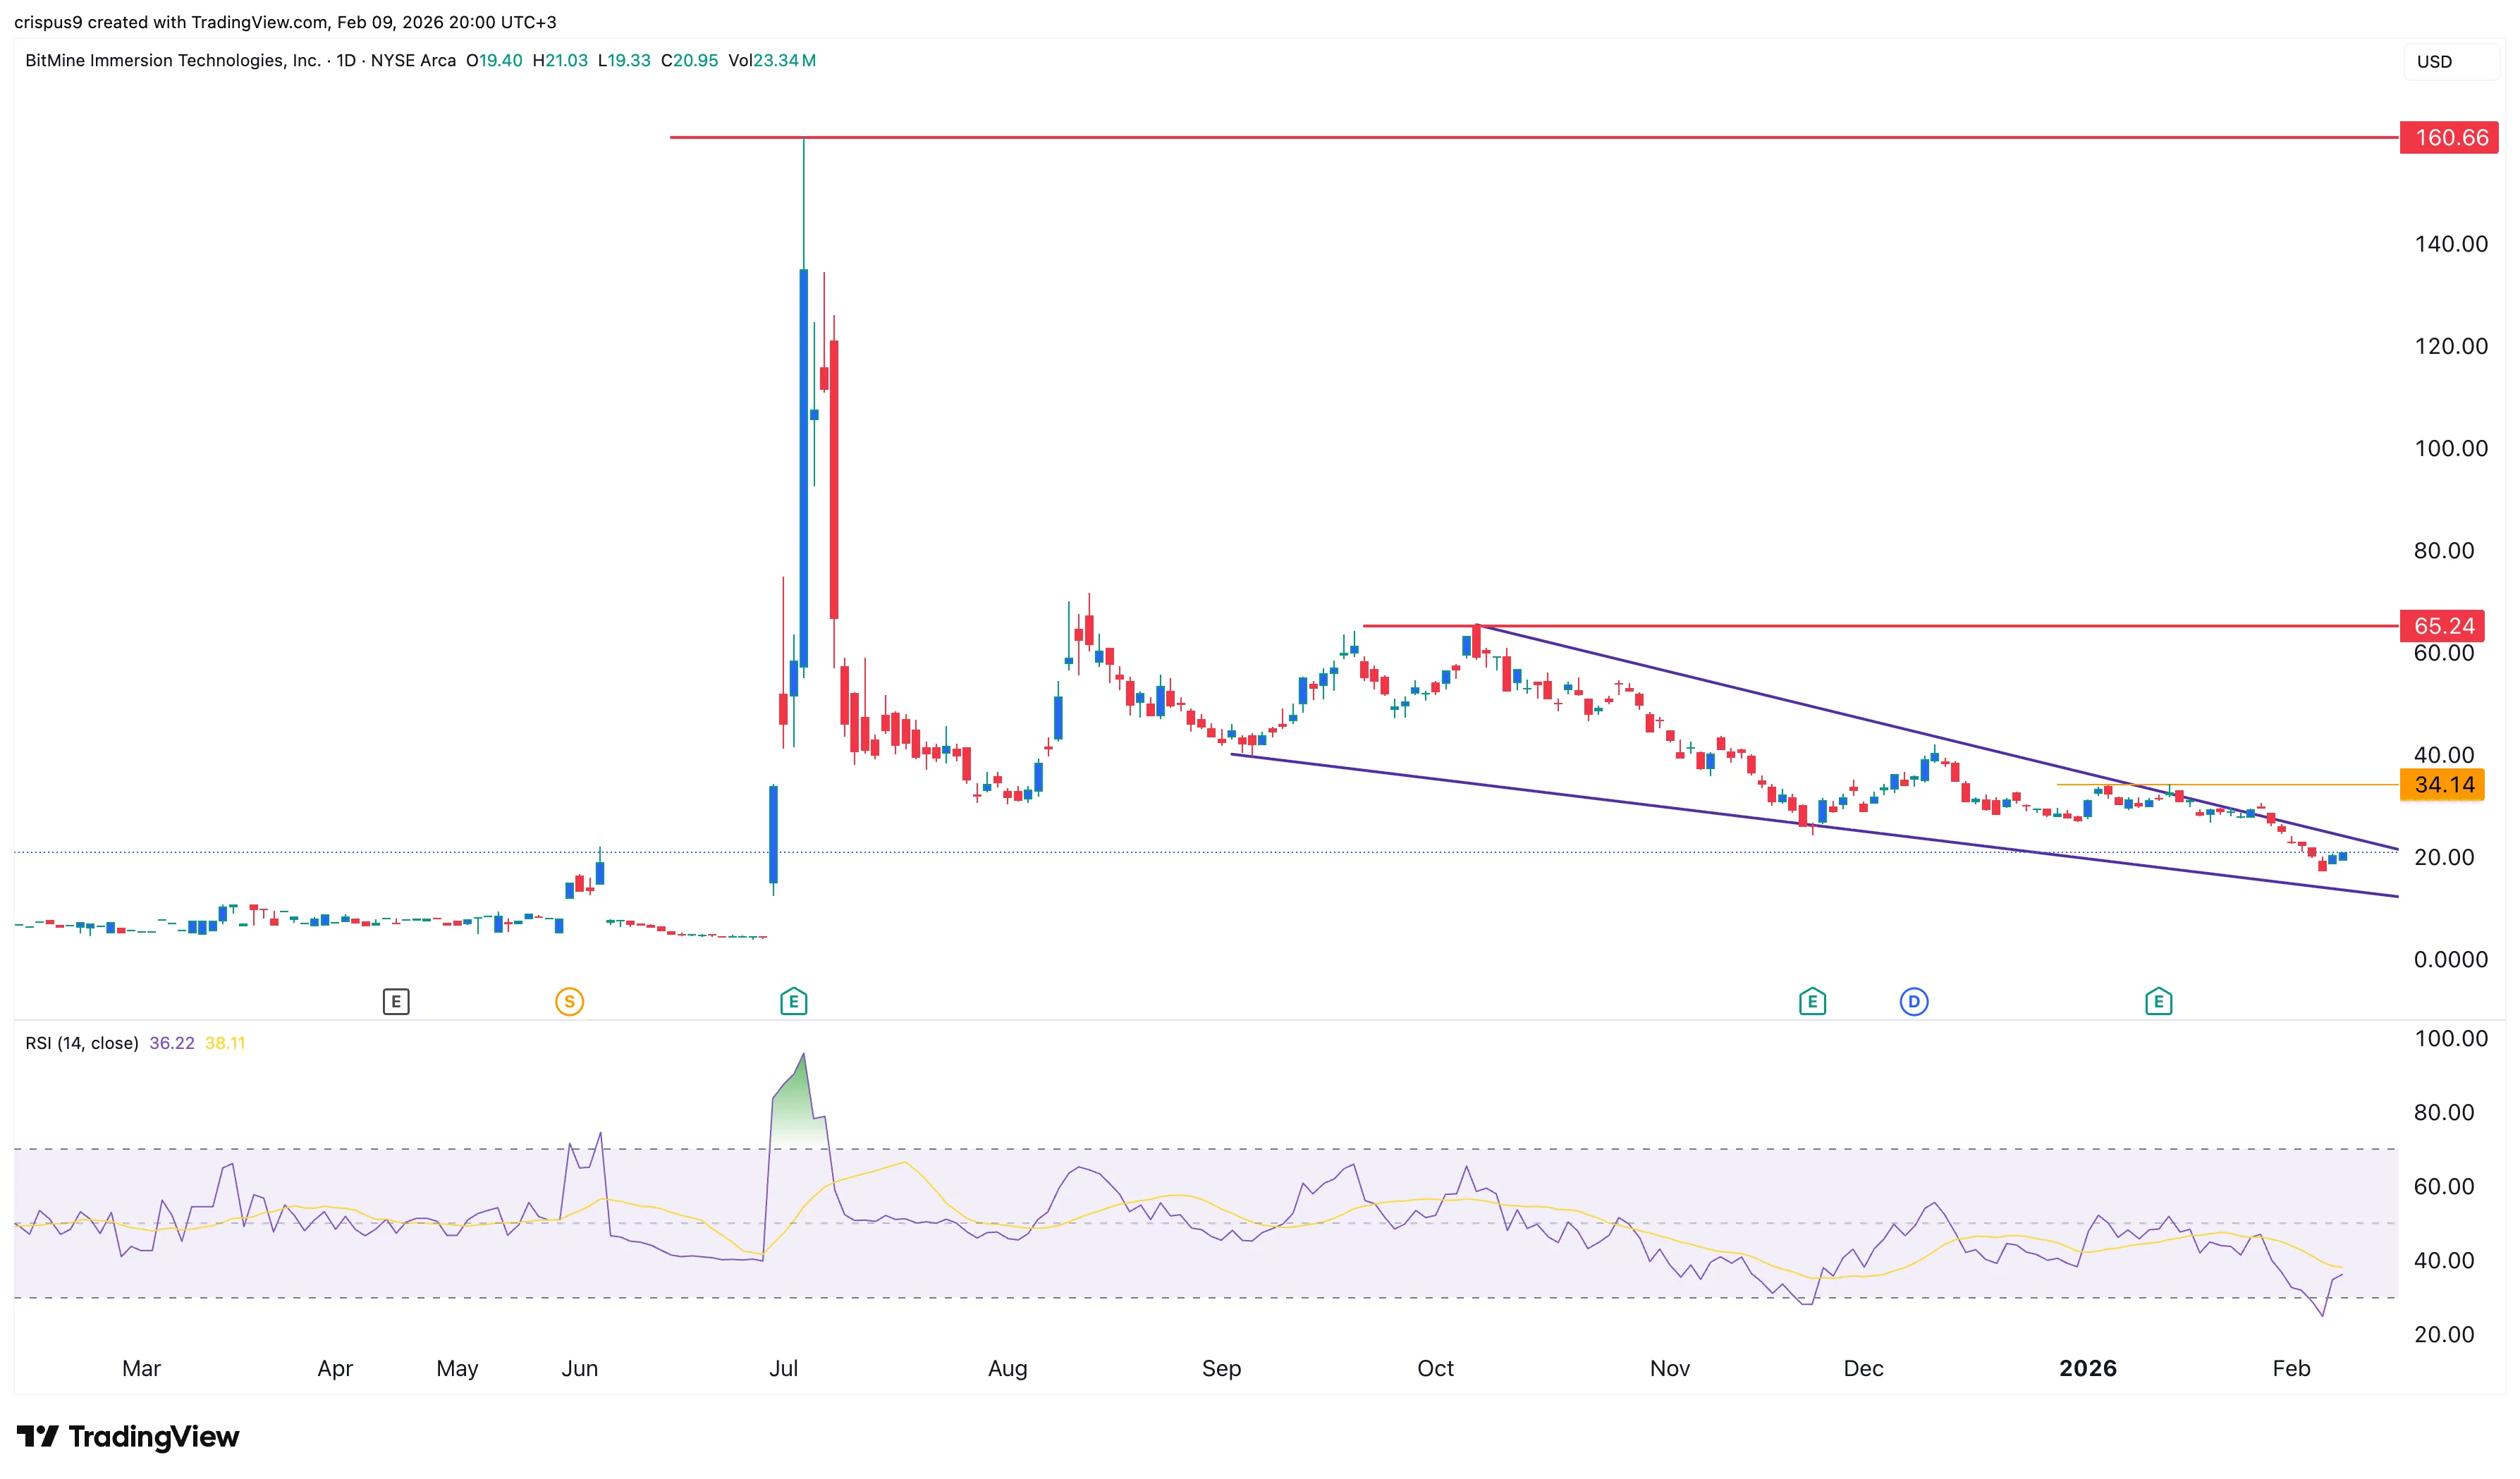
The daily timeframe chart shows that the BitMine stock price has been in a strong downward trend in the past few months. It plunged from a record high of $160 to the current $20.
On the positive side, the coin has formed a falling wedge pattern, which consists of two descending and converging trendlines.
This wedge is nearing its confluence, which could lead to a rebound soon. Also, the Relative Strength Index has moved from the oversold level of 30 to the current 32.
Therefore, the stock will likely have a strong bullish breakout in the coming days, potentially to the key resistance level at $35, its highest level in January this year.
On the other hand, a move below the lower side of the wedge will point to more downside in the near term.