

Market Overview
This week, the cryptocurrency market experienced a volatile downward trend, with both BTC and ETH showing fluctuating declines. BTC fell 4.19% this week, ETH dropped 2.91%, and TOTAL3 decreased by 1.68%. The market sentiment index rose to 10, remaining within the extreme fear range overall.
Stablecoin Market Dynamics
The total market capitalization of stablecoins declined, with USDT decreasing and USDC increasing:
- USDT: Market cap reached $182.9 billion, down 0.43% week-over-week. Capital outflows resumed, indicating that as market prices continued to fall this week, non-U.S. investors began withdrawing funds for risk avoidance.
- USDC: Market cap of $75 billion, up 0.94% week-over-week. Continued last week’s capital inflow trend, though this week’s growth slowed to only $700 million. This still reflects U.S.-based investors’ continued entry into the market.
BTC Market Trading Volume
This week showed signs of increased trading activity in the BTC market compared to last week. Data shows that the combined trading volume of BTC on Binance and Coinbase reached 267,699 BTC this week, up from 189,683 BTC last week. Specifically, Binance’s volume rose from 128,606 BTC to 179,267 BTC, while Coinbase’s volume increased from 61,077 BTC to 88,432 BTC.
BTC ETF Market Trading Volume
This week’s BTC ETF market trading volume increased compared to last week. Taking BlackRock’s IBIT — the largest by market share — as an example, this week’s trading volume reached 289 million shares, a slight increase from last week’s 186 million shares.
Market Driver Analysis
Chip Battle: Moderate Institutional Buying vs. Whale Exits at Highs
This week, spot ETFs for BTC and ETH, along with listed treasury companies, demonstrated strong resilience with increased purchasing power compared to last week. However, this incremental capital was nearly offset by a wave of reductions from “traditional whales”: Wu Jihan, Vitalik Buterin, and active “Satoshi era” addresses all engaged in selling activities. Buyers and sellers engaged in intense battles at current price levels. Although net buying slightly exceeded selling, prices failed to break through resistance levels, reflecting how bullish momentum was significantly diluted by whales exiting positions.
Macro Headwinds: Sticky Inflation Data Smashes Rate Cut Expectations
January’s U.S. PPI data registered 2.9%, not only exceeding the expected 2.6% but also signaling persistent wholesale price pressures. This has severely shaken market confidence in a June Fed rate cut (expected probability now at 42.9%). Amid renewed uncertainty over inflation trajectories and the prospect of prolonged high interest rates, capital markets’ intense craving for certainty has fueled risk aversion, directly suppressing liquidity premiums in crypto markets.
Tariff Cloud: Liquidity Defense Triggered by Trump Policy Expectations
The Trump administration’s proposed “national security tariffs” on six core industries — including batteries and chemicals — is viewed by markets as a potential inflation catalyst and source of trade uncertainty. Given capital markets’ heightened sensitivity to potential global supply chain disruptions from a “tariff war,” investors initiated defensive repositioning in advance, causing significant volatility in risk assets midweek.
Geopolitical Shockwaves: Escalating Middle East Conflict and Complex Sentiment Post-Decapitation Strike
Saturday’s U.S.-Israel strikes on Iran and subsequent retaliatory actions pushed geopolitical risks to a peak, triggering massive panic selling at market close. However, Sunday’s sudden assassination of Iran’s Supreme Leader sparked divergent market interpretations: some capital viewed this as potentially causing short-term paralysis of the Iranian regime or rapid de-escalation of hostilities, driving sharp market volatility and a brief rebound. Yet the power vacuum created by this “violent conclusion” also leaves markets facing more unpredictable retaliatory risks in the coming week.
Key Events Forecast for Next Week
Focus on “Nonfarm Payroll Week”: Employment Data to Set Rate Cut Tone
Friday’s February nonfarm payroll figures and unemployment rate will dominate attention. Against the backdrop of soaring PPI, persistent labor market overheating would further raise the bar for Fed rate cuts. This data will directly determine whether markets enter a “calming phase” or plunge deeper into “tightening panic.”
Monitoring Post-Conflict Fallout: Middle East Power Realignment and Strait Security
Iran’s response following the assassination attempt on its Supreme Leader warrants close scrutiny. Markets oscillate between optimism that “the situation may be ending” and fears of “massive retaliation.” Particularly, shipping conditions in the Strait of Hormuz will directly impact global inflation expectations and risk asset pricing.
Indicator Anchor: Can ETF Net Inflows Absorb Selling Pressure?
With whales retreating, spot ETF buying has become the sole “anchor of stability.” Next week, focus shifts to whether institutional capital — under dual macroeconomic and geopolitical shocks — will shift from “cautious buying” to “wait-and-see” or even “capital withdrawal.” This marks the pivotal barometer for gauging whether the broader market can hold critical support levels.
Market Outlook
Fragile Equilibrium: Short-Term Stabilization Coexists with Long-Term Risks
While the Middle East’s dramatic shifts have triggered a temporary sentiment rebound (fueled by expectations of war’s end), the underlying logic of stubborn inflation and insufficient institutional buying power remains unchanged. The market hovers at an extremely fragile equilibrium point, where any disappointing data could trigger a renewed downturn.
Strategic Guidance: Maintain Vigilance and Await Clear Trends
Until next Friday’s nonfarm payroll data is finalized and Middle East stability becomes evident, investors should adhere to the defensive principle of “cash is king.” Given the market remains within an “extreme panic” range and faces massive lock-up expirations (e.g., SOMI, MOVE), light positions represent the most rational risk-mitigation approach.
Next Week’s Forecast Targets
Bearish Targets: SOMI, MOVE
SOMI: High-performance Layer 1 vision shattered; chain-wide data plummets amid unlocking crisis
Project Fundamentals & Positioning
Somnia is a high-performance Layer 1 blockchain built for real-time on-chain applications like immersive gaming and social networks. Unlike traditional solutions, it avoids sidechains or off-chain workarounds to deliver seamless scalability and low costs. EVM-compatible and rooted in gaming/metaverse innovation, Somnia empowers developers to create accessible, high-performance virtual economies and communities.
Fundamental Data Severely Deteriorating
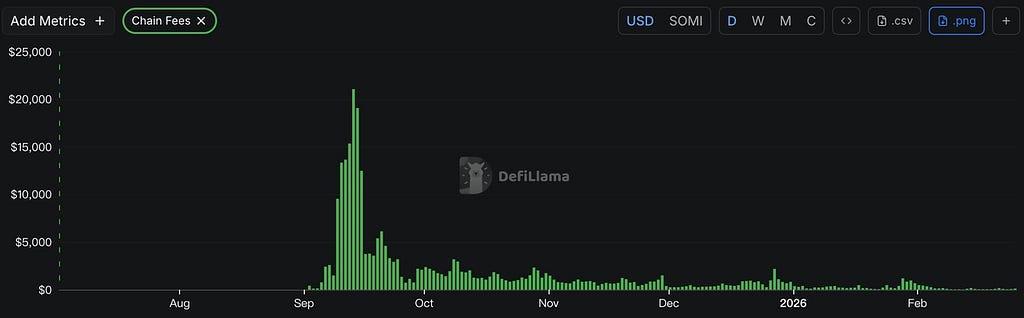
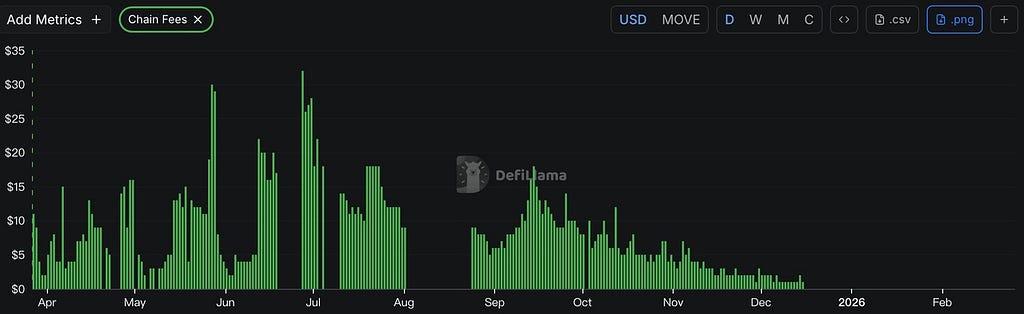
- Plummeting On-Chain Activity: Somnia’s daily transaction fees have dropped to approximately $100, a significant decline from historical highs, indicating near-zero user engagement and severely underutilized project usage.
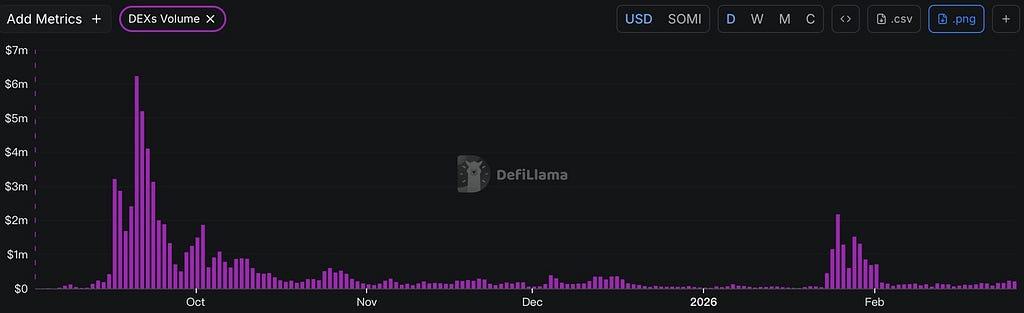
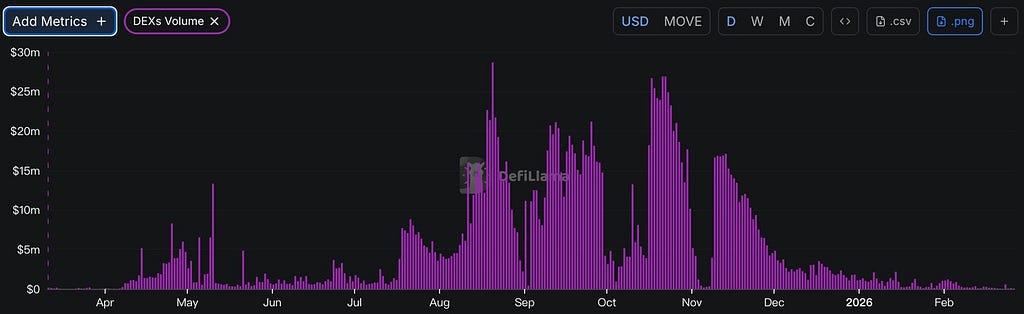
- Persistently Shrinking DEX Volume: On-chain DEX trading volume shows a continuous downward trend, currently stagnating at a low of $100,000 per day. This reflects severely insufficient trading demand and depleted ecosystem liquidity.
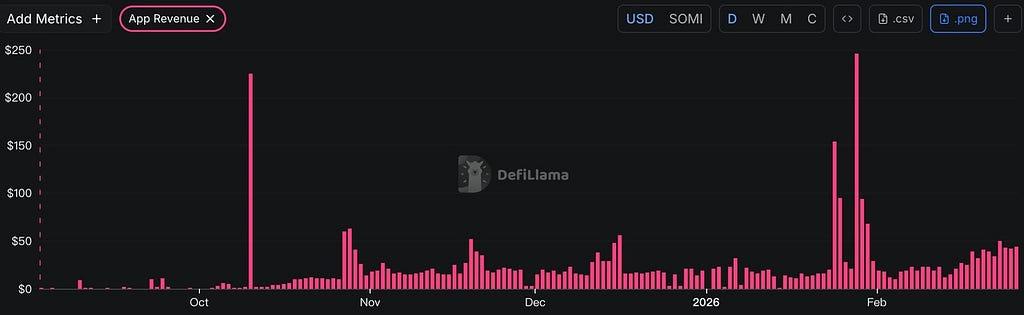
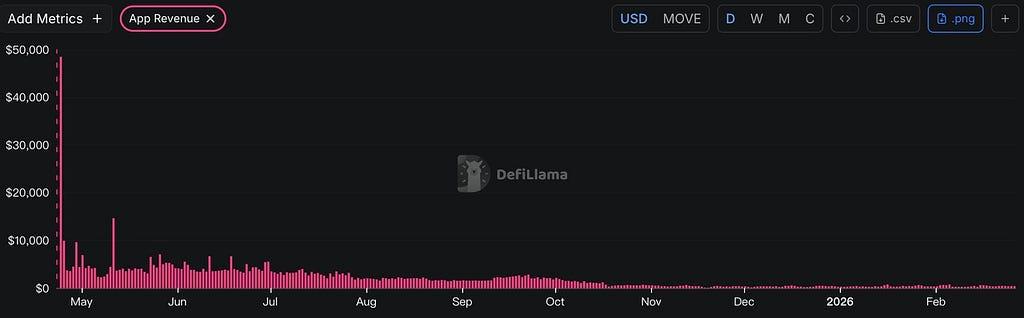
- Collapse of ecosystem application revenue: Total daily revenue from on-chain ecosystem projects is only around $40, indicating applications have essentially lost their user base and the entire ecosystem is stagnant.
Token Unlock Risk Assessment
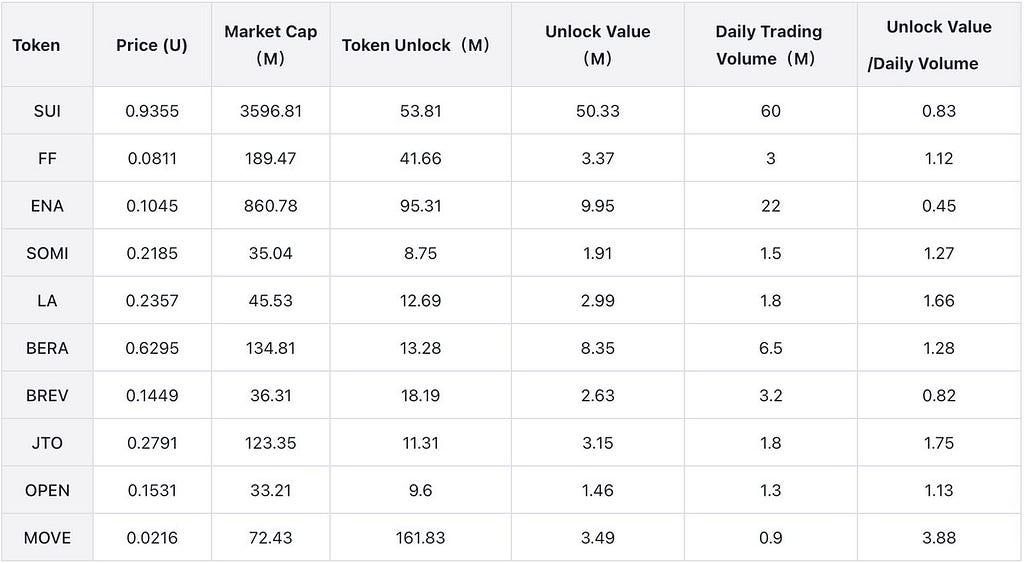
- Unlock scale and timing are both unfavorable: 8.75 million SOMI tokens will unlock on March 3rd. This large-scale unlock occurs at a critical juncture when project fundamentals have deteriorated across the board, making the timing extremely unfavorable.
- Seriously Insufficient Market Absorption Capacity: SOMI tokens have an average daily trading volume of only around $1.5 million. Compared to the unlock scale of 8.75 million tokens, market liquidity is clearly unable to effectively absorb the new supply, creating significant selling pressure.
- Strong Selling Motivation Among Unlocked Holders: Under the linear unlocking schedule, this release primarily affects institutional investors and the project team. Amid the project’s pronounced downturn, these holders possess strong cash-out incentives and are highly likely to exit via selling.
- Weak Liquidity Depth: The relatively low daily trading volume reflects severely insufficient market depth, incapable of effectively cushioning the price impact from this massive token release.
Summary
Somnia faces comprehensive fundamental deterioration: on-chain fees, DEX trading volume, and ecosystem revenue are all declining, with user activity nearly at zero. The March 3 unlock of 8.75 million tokens will create massive selling pressure within the fragile liquidity of $1.5 million daily average trading volume. The strong cash-out motivation of institutional investors and the team further exacerbates the sell-off risk.
MOVE: Move Language L2 Project Caught in Dual Crisis of Fundamental Collapse and Unlocking Pressure
Project Fundamentals and Positioning
Movement is an Ethereum L2 built on the Move programming language, aiming to bring Move’s security and performance to various blockchain ecosystems, including Ethereum. It enhances Ethereum’s network by constructing an L2 solution that improves transaction speed and efficiency while addressing scalability, interoperability, and security vulnerabilities.
Fundamental Metrics Severely Deteriorate
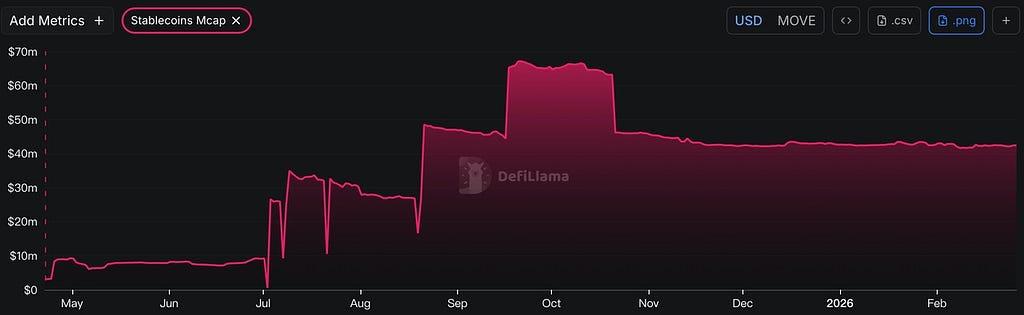
- Stablecoin Market Cap Continues to Shrink: On-chain stablecoin market cap has dropped from $67.09 million to $41 million, a 38.88% decline, indicating sustained capital outflows from the Movement ecosystem and eroding market confidence.
- On-Chain Activity Halted: On-chain fee data shows Movement’s daily transaction fees have recently reached zero, directly reflecting the disappearance of on-chain activity.
- Persistent Decline in DEX Volume: On-chain DEX trading volume shows a continuous downward trend, currently hovering at just $60,000 per day, indicating diminishing on-chain trading activity.
- Extremely Low Ecosystem Project Revenue: The combined daily revenue of all applications on the Movement chain is only around $400 and remains persistently low, signaling the ecosystem is on the brink of decline.
Token Unlock Risk Assessment
- Unlock scale and timing are unfavorable: On March 8, 161.83 million MOVE tokens will be unlocked, representing 1.62% of the total locked supply. This unlock occurs at a critical juncture when the project’s fundamentals continue to deteriorate.
- Seriously Insufficient Market Absorption Capacity: With an average daily trading volume of only around $900,000, market liquidity is clearly inadequate to effectively absorb the upcoming unlocked tokens, creating significant selling pressure.
- Strong Selling Motivation Among Unlocked Holders: Analysis of the linear unlocking schedule indicates this release primarily involves institutional investors and the project team. Given the project’s current pronounced downturn, these holders possess strong cash-out incentives and are highly likely to exit via selling.
- Weak liquidity depth: The relatively small daily trading volume reflects insufficient market depth, unable to effectively cushion the price impact from token unlocking.
Summary
The Movement project faces multiple systemic risks:
Business-wise: Stablecoin market cap has shrunk by 38.87%, on-chain fees have dropped to zero, DEX trading volume continues to decline, and ecosystem revenue is only $400/day. — Capital dimension: The upcoming unlocking of 161.83 million MOVE tokens on March 8 will generate significant selling pressure in a market with weak liquidity and an average daily trading volume of just $900,000. The unlocking entities are primarily institutional investors and the project team, who possess strong cash-out incentives. The convergence of these multiple bearish factors exerts sustained downward pressure on the MOVE token price, making it difficult to reverse the downward trend in the short term.
Next Week’s Token Unlock Schedule
(Amounts Exceeding $1 Million)
Weekly Hot Topic
DeFi Retreat, RWA Takeover: Deep Dive into Hastra’s 59% TVL Surge — Four Key Drivers and Advanced Profit Strategies
Event Background
Over the past month, the crypto market has faced sustained, significant declines. Not only have prices for the vast majority of projects plummeted, but Total Value Locked (TVL) across most DeFi projects has also experienced substantial drops. This indicates not only capital flight but also a gradual loss of user confidence in the crypto market, with on-chain funds continuously exiting DeFi projects. Amid this downturn, Hastra’s TVL has bucked the trend, surging 59.15% over the past 20 days. Crucially, this growth has been gradual and sustained — a, a remarkable phenomenon warranting close examination in the current bearish market.
Hastra is a DeFi protocol on the Solana chain specializing in Real World Assets (RWA) and Private Credit categories. Its core narrative lies in introducing traditional institutional-grade credit yields (primarily Figure HELOCs, or home equity lines of credit) into the DeFi ecosystem through its on-chain assets wYLDS and PRIME, offering users “real interest” aligned with their risk preferences.
Data Analysis
TVL
Hastra’s TVL data reveals a stair-step upward trend since early February, demonstrating sustained growth momentum.
TVL Composition
Hastra’s TVL is almost entirely comprised of WYLDS. Therefore, analyzing its growth drivers requires focusing solely on WYLDS’s expansion factors.
On-Chain Capital Flows
Hastra’s on-chain capital flows demonstrate a sustained inflow rather than a sudden surge, indicating genuine demand for on-chain capital continuously entering the ecosystem.
In summary, Hastra’s TVL growth primarily stems from WYLDS expansion.
Reasons for Rapid Data Growth
Hastra’s 59% surge in TVL within a short period is not coincidental. It is driven by four key factors: product yield, the launch of leverage tools, community incentives, and demand for RWA allocation.
1⃣The Appeal of Real Yields
Against a backdrop of declining DeFi yields, Hastra’s 7.50% APY offers exceptional competitiveness. This yield stems not from unsustainable token rewards prevalent on-chain, but from underlying HELOC (Home Equity Line of Credit) interest. Real-time data on Hastra’s website currently shows PRIME’s base APY consistently at 7.50%. This “real yield” narrative has attracted substantial risk-averse capital seeking returns above government bonds.
2⃣Kamino Leverage Cycles Boost Capital Efficiency
Another core driver of TVL growth is enhanced capital efficiency. Hastra prominently showcases its integration with Solana’s leading lending protocol Kamino, enabling users to amplify returns through “revolving loan” strategies. Official calculations indicate that 2x leverage boosts yields to 9.8%, while 3x leverage reaches 12.5%. This composability enables aggressive capital to flood into the PRIME market via leveraged borrowing, directly inflating the total funds locked in the protocol.
3⃣Community Incentives
Hastra’s official website is currently running the “Road BEYOND $200M” incentive campaign. By deeply aligning user interests through clear phased goals and lottery-style rewards, it not only attracts rapid capital accumulation with short-term bonuses but also effectively reduces asset selling pressure by boosting holding confidence. Simultaneously, this mechanism stimulates the adoption of leveraged strategies like “revolving loans” through social sharing. While significantly amplifying the protocol’s TVL metrics, it has successfully boosted retail user activity and wallet growth.
4⃣RWA Allocation Demand Amid Risk Aversion
From a market structure perspective, the current DeFi landscape is transitioning from “pure speculation” to “yield-generating assets.” In an environment lacking high yields, stable, transparent RWA assets offering returns above risk-free rates (e.g., U.S. Treasuries) have become a safe haven for capital. Hastra precisely fills the gap for highly liquid RWA products on the Solana chain, absorbing this excess capital.
Investor Participation in Sentora Strategy
Hold and Use wYLDS (Base Yield)
Users purchase and hold wYLDS on the Solana chain (via Jupiter or other DEXs) to earn approximately 3.32% APY from underlying RWA assets. This requires no lock-up and completely avoids impermanent loss inherent in liquidity mining, making it ideal for conservative investors prioritizing capital safety and on-demand liquidity.
Obtain PRIME through Staking
Users can stake wYLDS for PRIME on the Hastra platform to directly capture lending interest dividends from Figure HELOCs asset pools. This strategy maintains strong liquidity while delivering enhanced yields of approximately 7.50% APY, representing the mainstream advanced approach for balancing risk and reward while deeply engaging with the Hastra ecosystem.
Kamino Leverage Cycle (2x/3x Leverage)
Users can implement a “revolving loan” strategy on Kamino Finance by borrowing stablecoins against PRIME collateral and repeatedly adding positions. This leverages the underlying yield to approximately 9.8% (2x) or even 12.5% (3x). Core returns depend on the spread between PRIME yields and borrowing costs, making it an advanced leverage solution suited for higher-risk-tolerant users aiming to maximize capital efficiency.
Crypto Events Next Week
- Monday (March 2): US February ISM Manufacturing PMI
- Wednesday (March 4): US February ADP Employment Report
- Thursday (March 5): US Initial Jobless Claims (Week Ending February 28)
- Friday (March 6): US February Unemployment Rate; US February Nonfarm Payrolls (Seasonally Adjusted); US January Retail Sales (Monthly Change)
Sector Performance
Based on weekly return statistics, the AI sector performed best while the Meme sector performed worst.
- AI Sector: Within the AI sector, TAO, WLD, RENDER, VIRTUAL, and FET accounted for a significant portion, totaling 88.16%. This week’s respective declines were: -5.11%, -3.56%, -10.49%, 1.69%, and -11.72%. It is evident that projects with heavier weighting in the AI sector experienced smaller declines this week compared to other sectors, thereby making the AI sector the top performer.
- Meme Sector: DOGE, SHIB, M, and PEPE dominate the Meme sector, collectively accounting for 88.56% of the total. This week, their respective declines were: -9.63%, -13.96%, 6.23%, and -17.52%. It is evident that most projects in the Meme sector experienced larger declines than those in other sectors, resulting in the Meme sector’s worst performance.
Summary
1⃣This week, the cryptocurrency market continued its volatile downward trend. BTC and ETH recorded weekly declines of 2.35% and 1.55% respectively, while the market sentiment index remained at 10, persistently stuck in the “extreme fear” zone. Capital flows showed significant regional divergence: USDT, primarily held by non-US investors, saw its market cap decrease by 0.43%, indicating risk-averse exits; while USDC, dominated by US investors, saw a 0.94% increase in market value, suggesting some long-term capital is still attempting to position at lower levels. This tug-of-war stems from multiple pressures: stubborn inflation data, cooling expectations for Fed rate cuts (June rate cut probability now at 42.9%), and uncertainties surrounding Trump’s tariff policies and geopolitical tensions.
2⃣Despite the broader downturn, the RWA (Real-World Asset) sector, exemplified by Hastra, stands out with its TVL surging 59.15% over the past 20 days. This performance is no coincidence but precisely meets the market’s dual demand for “safety plus yield.” By bringing underlying home equity lines of credit (HELOCs) on-chain, Hastra offers a stable 7.50% real yield. Combined with its “Road BEYOND $200M” incentive campaign and Kamino leverage cycle strategy, it has successfully attracted substantial defensive capital. Its stair-step TVL growth starkly contrasts with the broader DeFi capital outflow trend, reaffirming that projects with clear, sustainable cash flows remain “safe havens” for capital even in weak markets.
3⃣Looking ahead to next week, the market faces a “super week” of intensive data tests. Macro-wise, February’s U.S. nonfarm payrolls and unemployment rate will be pivotal indicators determining the path of interest rate cuts. Operationally, investors should maintain high vigilance until institutional buying resumes and geopolitical risks subside. Adopting a “defense-first, strict position control” approach is advised, with close monitoring of ETF fund flows and the potential secondary impact of macro data on market sentiment.