
EL-CL Monitoring Dashboards: A Study with Nimbus
StereumLabs, in collaboration with MigaLabs, has led the development of a comprehensive suite of Grafana dashboards designed to monitor metrics across multiple Consensus and Execution clients. More than 70 client combinations (including super nodes) are continuously operated and observed, providing a broad and representative view of client behavior under live network conditions.
Understanding the meaning and operational impact of client metrics can often be challenging, particularly when distinguishing between normal variance and actual malfunction. In this article, we examine how a bug affecting the Nimbus consensus client was clearly and rapidly identifiable through these dashboards, illustrating their practical value in real-world monitoring scenarios.
The purpose of this analysis is not to single out a specific client, but to demonstrate how effective observability tooling makes abnormal behavior immediately visible. The situation went back to normal within a few hours and the incident had limited overall impact. At the same time, it serves as a reminder of the importance of maintaining client diversity within the Ethereum ecosystem.
A secondary finding — the unnoticed loss of metric support in a subsequent Nimbus release — was surfaced during a collaborative review meeting with the Nimbus team, further highlighting the value of continuous observability and cross-team communication.
Additionally, this document presents a comparative analysis between a Nimbus regular node and a super node, leveraging the side-by-side capabilities of the dashboards to illustrate the operational differences introduced by the PeerDAS specification.
Nimbus Consensus Client Disruption — February 8, 2026
On February 8, 2026, between 01:00 and 02:00 UTC, the Nimbus consensus client experienced an important bug that temporarily disrupted its participation on the Ethereum mainnet.
According to the official post-mortem:
“Nimbus clients falsely rejected as invalid a mainnet block and forked off. Cache corruption in Nimbus’s implementation Merkle tree hashing causing this arose from certain size changes of SSZ List objects which appeared on mainnet which bypassed correct cache invalidation… Because descendants of block inaccurately determined to be invalid could
not be processed without violating protocol, Nimbus could not continue to follow mainnet’s canonical chain until the node was restarted”
Observable Impact at the Node Level
Although network participation returned to normal a few hours later, the operational impact was immediately visible on monitoring systems exporting Nimbus metrics. While metric visualization alone is not sufficient to determine root cause, it provides a rapid and unambiguous indication that abnormal behavior is occurring — even for operators without deep protocol expertise.
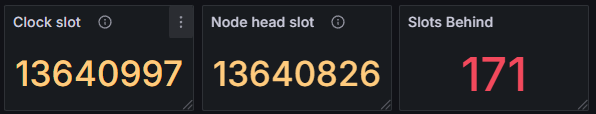
One of the most prominent indicators was the “Slots Behind” metric. At approximately 02:00 UTC, the affected node in this example (Nimbus/Nethermind) was observed to lag 171 slots behind the clock slot, clearly indicating a loss of synchronization with the canonical chain.
While many professional stakers run their own set of dashboards, they cannot see what they cannot run. In other words, they only see data about the nodes they run, but they cannot compare it with other clients they are not running. This is an key difference.
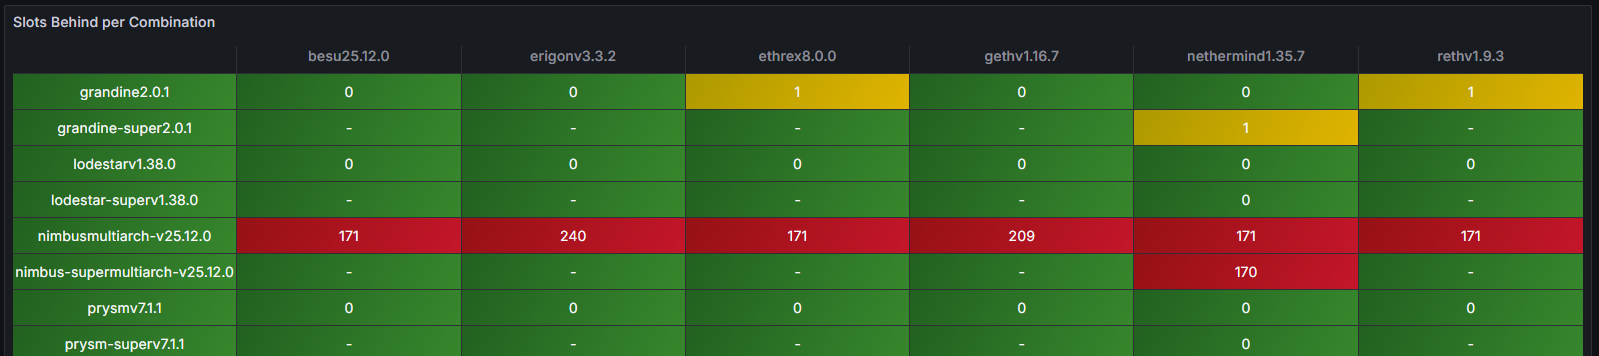
Since StereumLabs runs a large number of node combinations, it is very easy to quickly verify if other nodes are been also affected and which ones. Indeed, the overview sync state table dashboard, immediately revealed a clear pattern: all instances running the Nimbus consensus client were falling behind the clock slot, while other Consensus–Execution client combinations continued to operate normally. This side-by-side comparison made the anomaly both visible and attributable at a glance, without requiring deep log inspection or manual cross-node correlation.
This observation was further corroborated by the dedicated dashboards of the other consensus clients, whose synchronization, block processing, and networking metrics remained stable throughout the same time window.
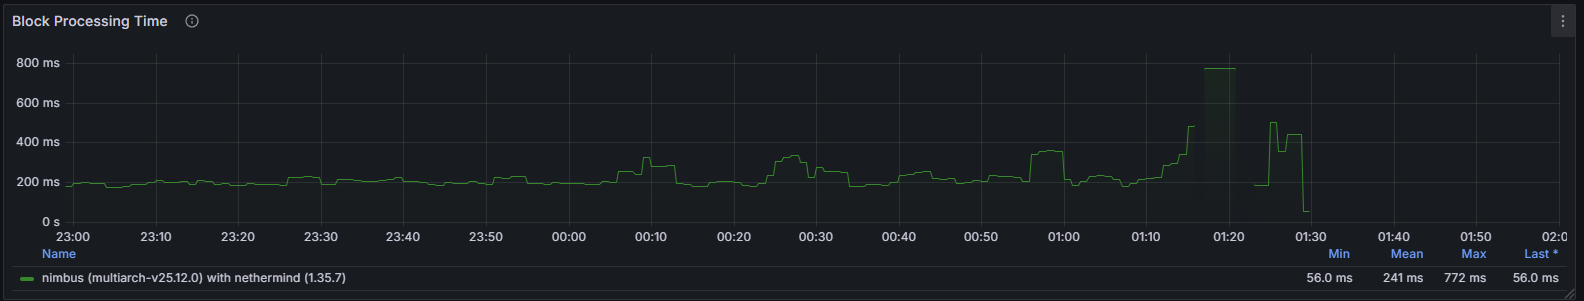
Simultaneously, block processing effectively halted. The absence of newly processed blocks was directly reflected in block import metrics, making the issue unmistakable from an operational standpoint.
Network and Peer Connectivity Degradation
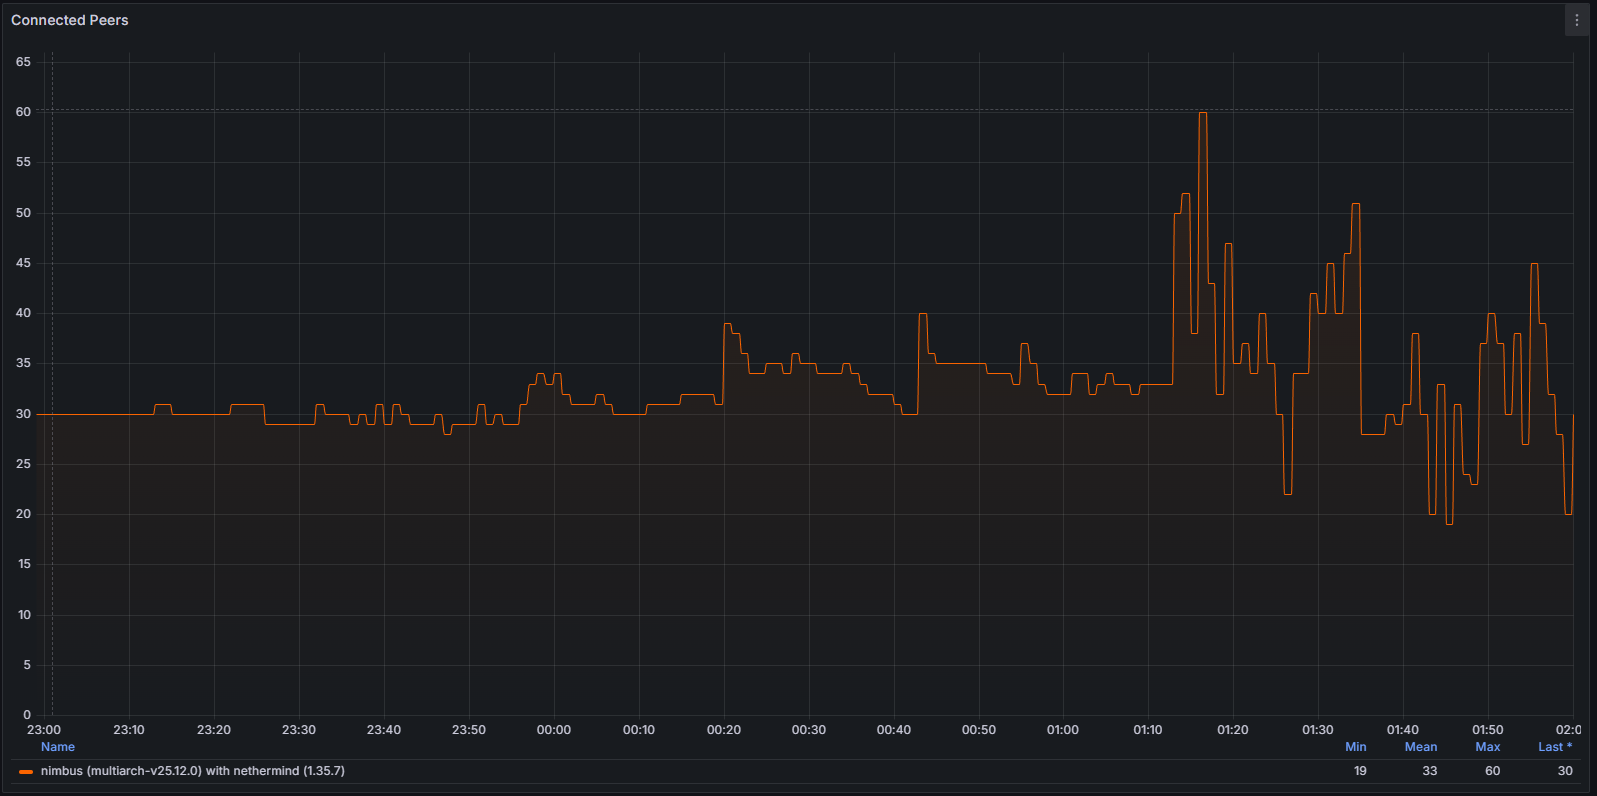
The instability also manifested at the networking layer. As the client diverged from the canonical chain, it repeatedly attempted to establish productive peer connections. This behavior was clearly observable through:
Connected Peers
Bandwidth Utilization
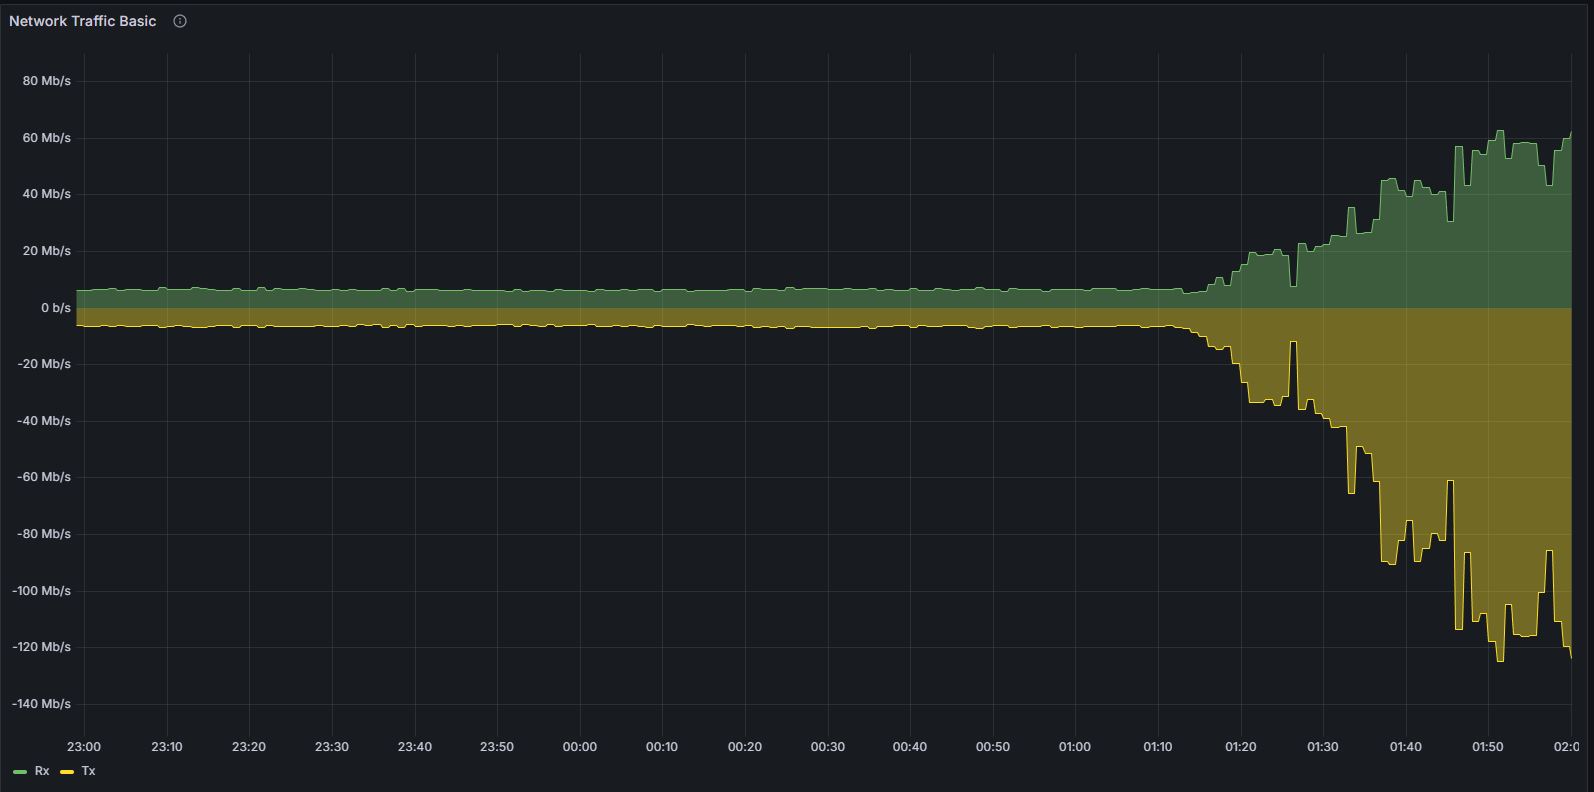
libp2p Metrics
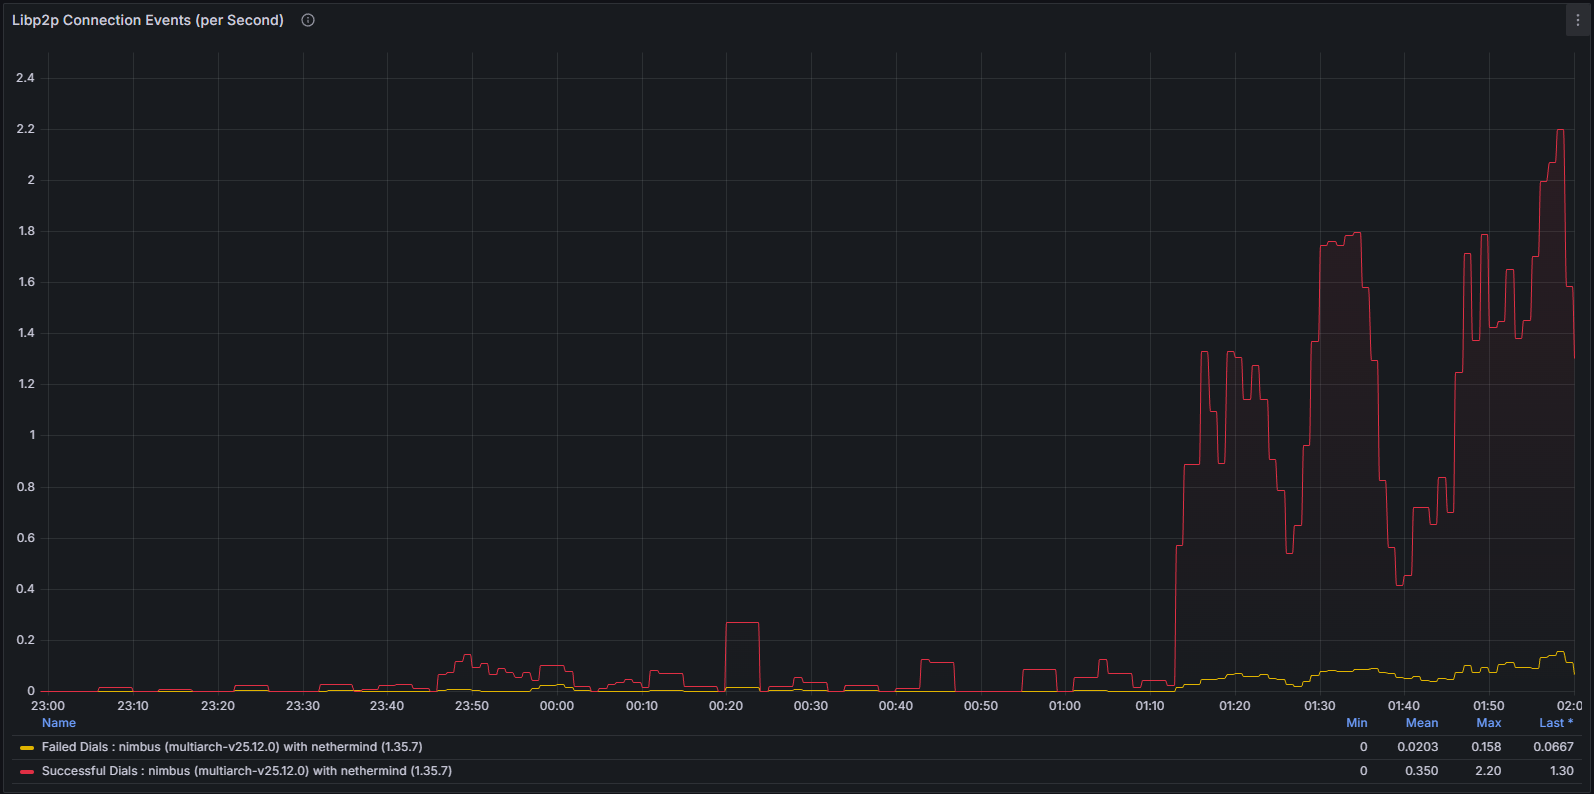
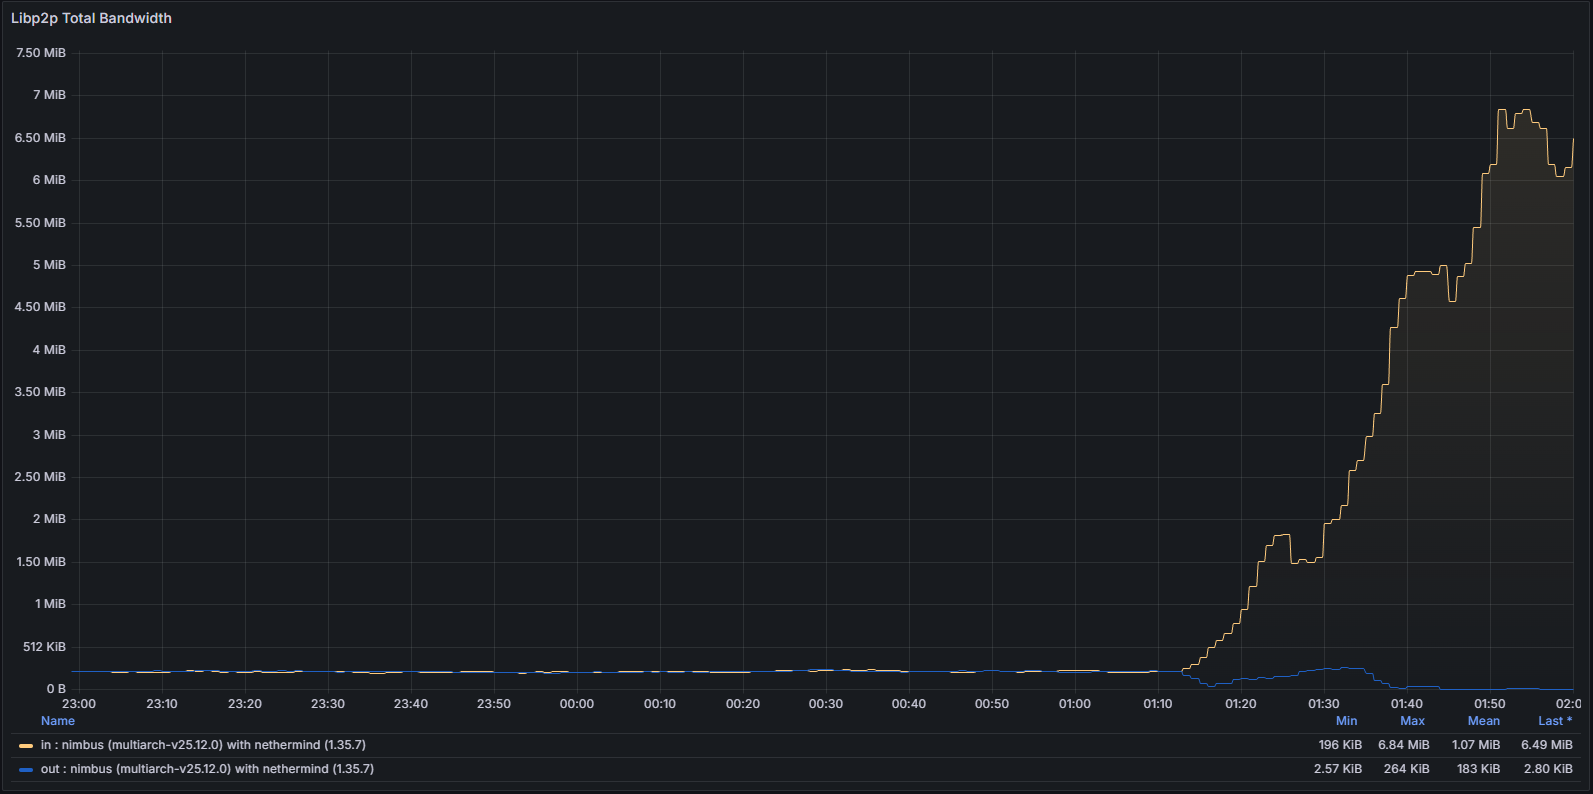
Both system-level network usage and protocol-specific metrics exhibited abnormal patterns consistent with a node unable to successfully validate and propagate canonical blocks.
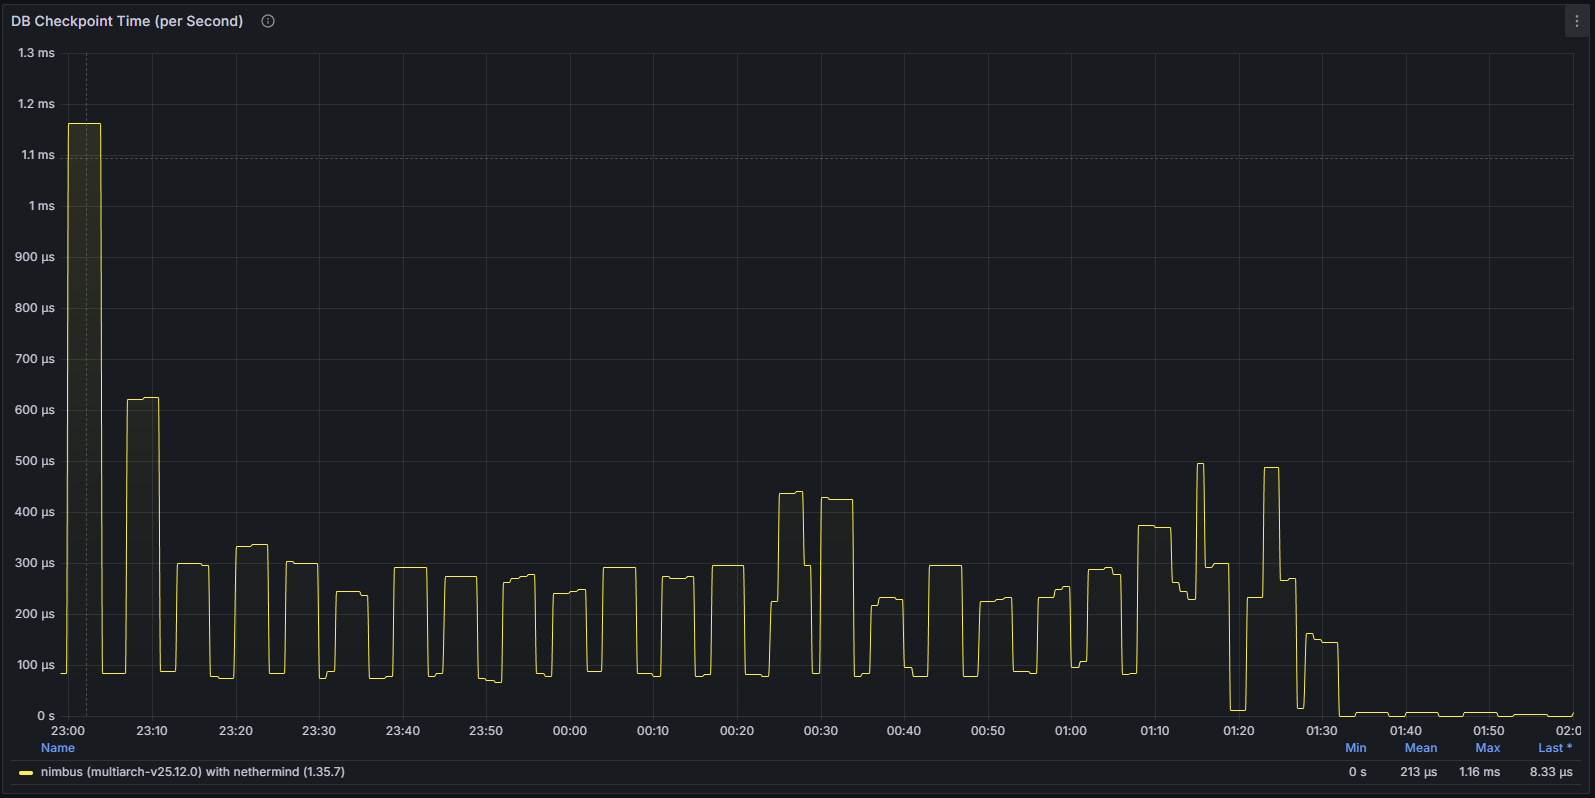
Database Activity Stagnation
Database-related metrics further highlighted the issue. Write operations and state updates dropped significantly, reflecting the fact that the client was no longer successfully processing new canonical data. This provided an additional layer of confirmation that the node was effectively stalled rather than simply experiencing transient network latency.
Overall, the disruption of this bug was very limited, and it was solved by simply rebooting the node. Nimbus remains one of the most robust CL clients in the space, with no major incident since the genesis of the Beacon chain. The bug fix was released just a few days later and no issue has been observed since then.
Unnoticed loss of metric’s support
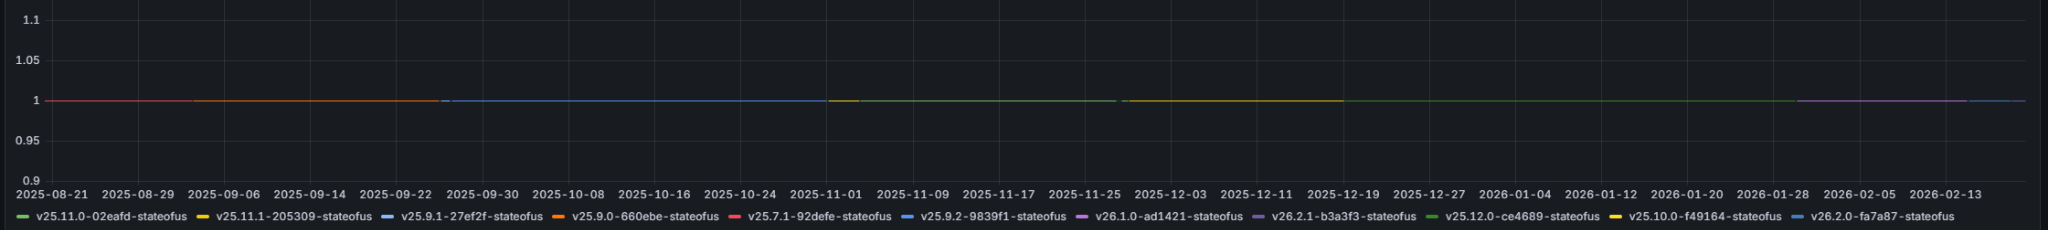
Anomaly detection is one of the important use cases for these compilation of dashboards, but is not the only one. While having a brief technical exchange with the Nimbus team regarding dashboard coverage and metric exposure, we identified a regression affecting one specific metric.
The distribution of connected peers per client — a metric available in previous versions — was no longer being properly exported. Through version comparison and historical dashboard data, this change could be correlated with a release deployed at the end of 2025, indicating a likely accidental regression introduced during that update cycle. While all Ethereum clients runs a large battery of tests before any release, those test usually cover complex problems, such as consensus, finality, validation, performance, among others, but they not always cover metrics given that they are not critical for operations.
This finding further illustrates the value of continuous, cross-version observability: beyond detecting runtime incidents, comprehensive dashboards also help surface subtle metric-level inconsistencies that might otherwise go unnoticed.

Comparing a Nimbus regular node with a supernode
The Stereumlabs dashboards provide side-by-side comparison capabilities for regular nodes and supernodes, enabling operators to observe and quantify the operational differences between these two configurations
The distinction between a regular node and a supernode in Nimbus is rooted in the PeerDAS specification, introduced as part of the Fusaka upgrade (EIP-7594). The core architectural difference lies in the number of blob data columns each node custodies and propagates across the peer-to-peer network: a regular node subscribes to a randomly assigned subset of 8 column subnets, whereas a supernode subscribes to all 128 column subnets, custodying the complete dataset.
Given the substantially larger volume of data managed by a supernode, the most pronounced and immediate observable difference manifests in general network bandwidth consumption. This is visible in the top-level network I/O panels of the dashboard
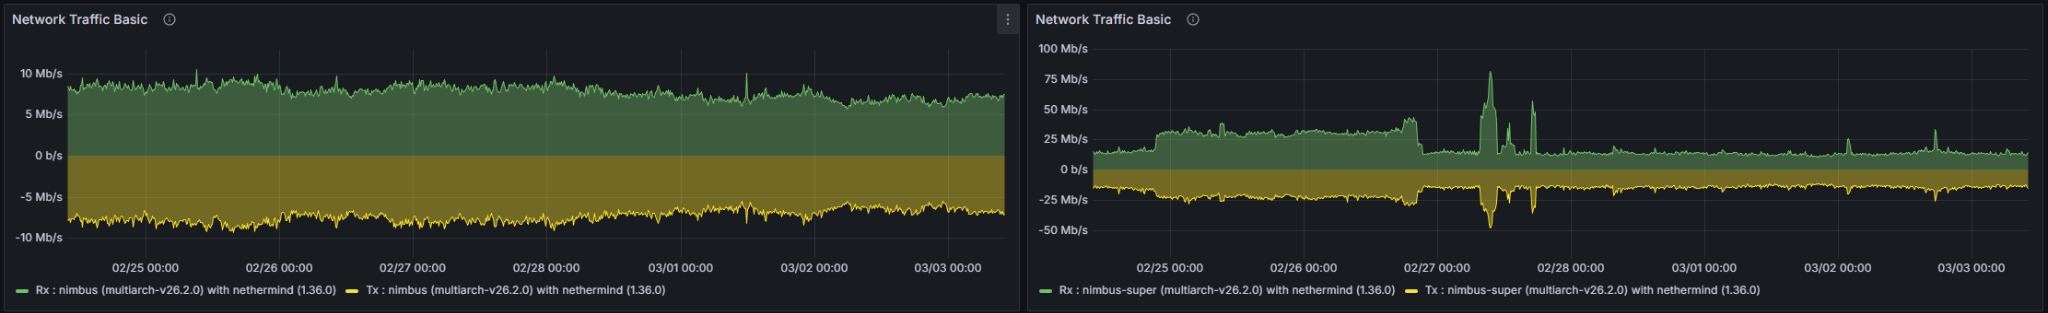
and is further corroborated by the libp2p bandwidth metrics, which reflect the node’s participation in the gossip layer.
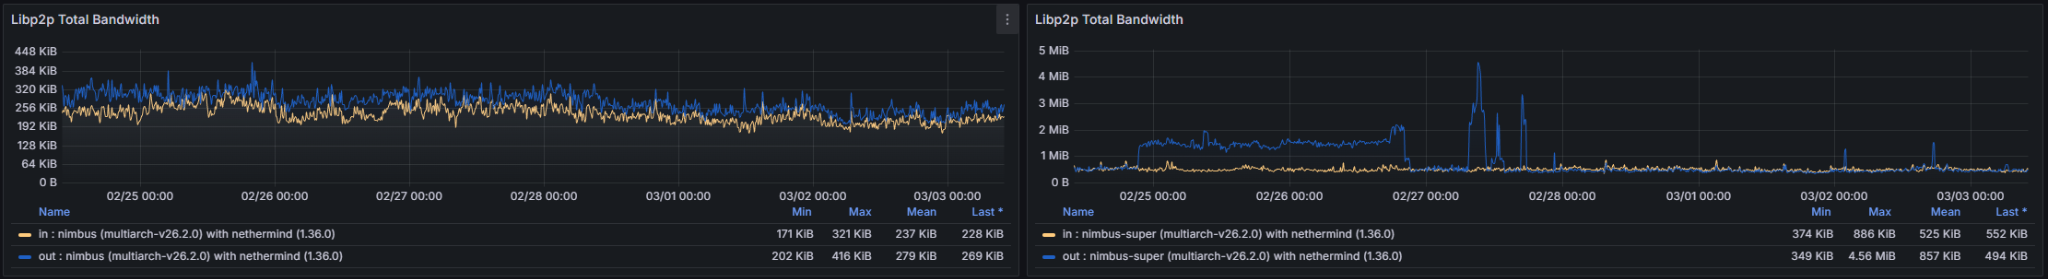
Both inbound and outbound throughput are significantly elevated on a supernode, with peak spikes occurring around slot boundaries as column data is received and re-propagated. While one might intuitively expect the bandwidth of a super node to be approximately 16 times greater than that of a regular node — given its subscription to all 128 column subnets versus 8 — the observed multiplier is considerably lower in practice. This is due to the fact that a significant portion of bandwidth is consumed by fixed network overhead (peer management, attestations, block propagation) that remains constant regardless of subnet subscription count, combined with the GossipSub mesh topology which limits the number of peers from which a node receives any given column. The theoretical ×16 ratio would only hold if bandwidth were purely a function of column data volume with no fixed overhead, which is not the case in a live p2p network.
Over the 7-day observation window at the time of writing, mean inbound and outbound bandwidth shows a difference of approximately 40% between a super node and a regular node.
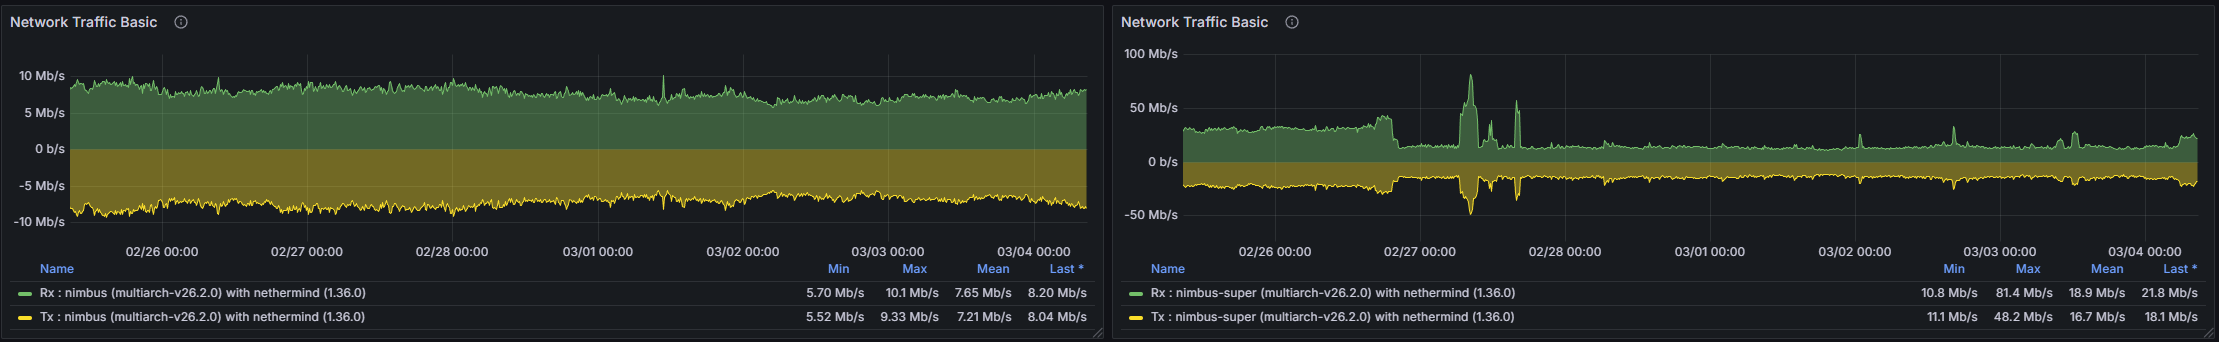
| Mb/s | Regular Min | Regular Max | Regular Mean | Supernode Min | Supernode Max | Supernode Mean | Delta Min | Delta Max | Delta Mean |
|---|---|---|---|---|---|---|---|---|---|
| Received | 5.7 | 10.1 | 7.65 | 10.8 | 81.4 | 18.9 | 52.78% | 12.41% | 40.48% |
| Transmitted | 5.52 | 9.33 | 7.21 | 11.1 | 48.2 | 16.7 | 49.73% | 19.36% | 43.17% |
Due to the greater number of KZG cell verification and gossip processing operations performed across all 128 column subnets, a super node is expected to exhibit a higher CPU utilization than a regular node. That said, this metric alone does not constitute a reliable differentiator between the two configurations.
Regular:

Supernode:
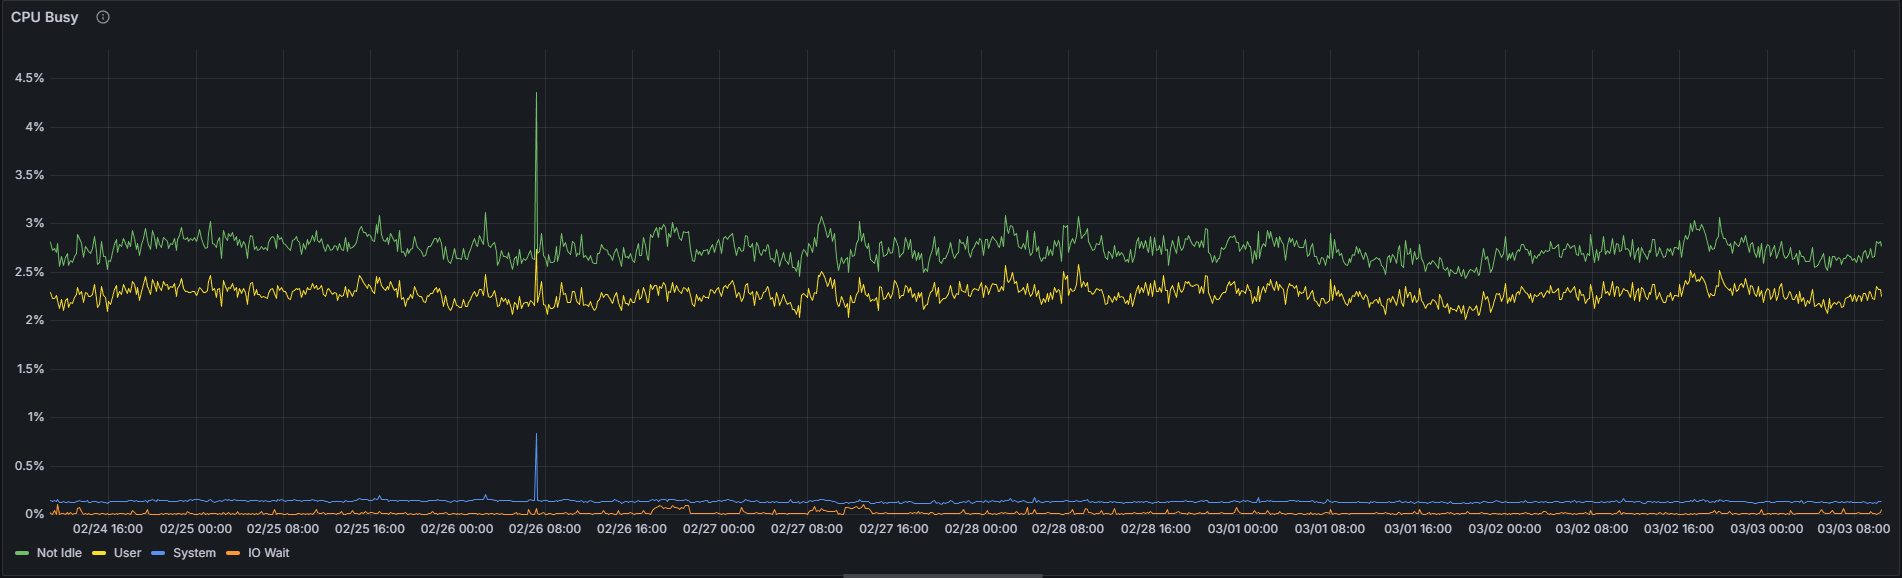
Over the 7-day observation window at the time of writing, the absolute difference in mean CPU utilization between a super node and a regular node is less than 1 percentage point (1.92% vs. 2.74%) for this specific Nimbus/Nethermind combination. While the relative delta of approximately 70% may appear significant, it should be interpreted in the context of the very low absolute values involved — an increase from 1.92% to 2.74% remains operationally negligible. The slightly higher CPU utilization on a super node is real, but should not be a cause for concern in practice.
| Regular | Supernode | Delta | |
|---|---|---|---|
| Not Idle CPU | 1.92% | 2.74% | 70.07% |
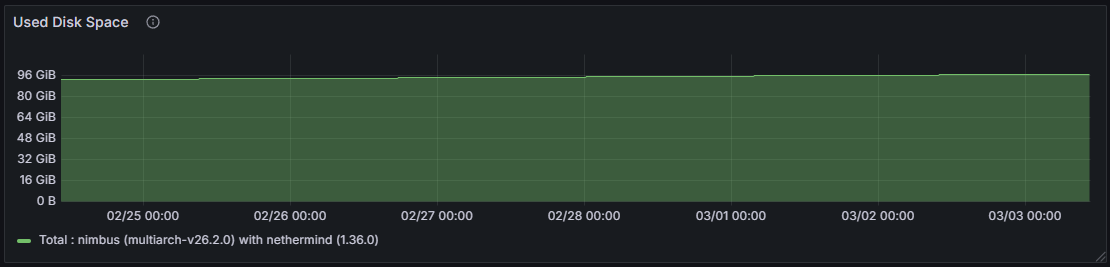
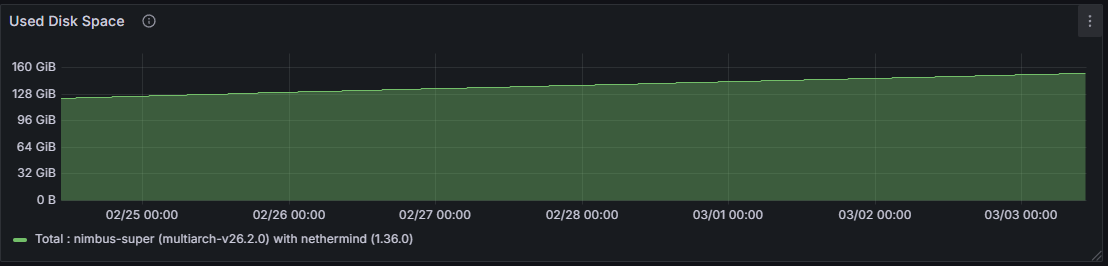
Increased column custody directly translates into higher disk write throughput and greater overall storage consumption on the consensus layer. A supernode retains data for all columns across the custody period, whereas a regular node’s on-disk footprint is proportionally smaller, reflecting custody of only its assigned subset.
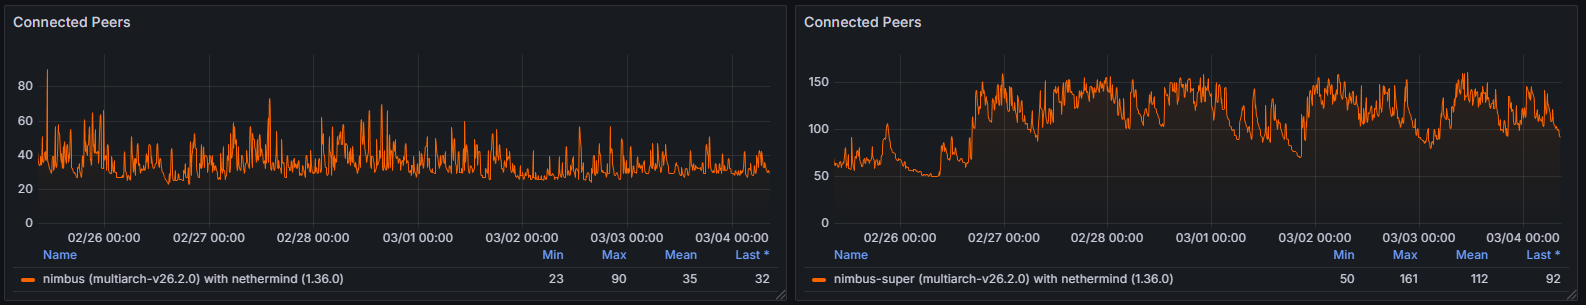
Broader subnet participation on a supernode necessitates engagement with a larger and more diverse set of peers, resulting in a higher connected peer count compared to a regular node. Over the 7-day observation window, the connected peer count on a regular node ranged from 23 to 90, with a mean of 35, while the supernode ranged from 50 to 161, with a mean of 112 connected peers.
Supernodes subscribe to all 128 column subnets, resulting in a significantly higher number of active gossip topic subscriptions. Regular nodes, participating in only 8 assigned subnets, will present substantially lower values in gossip subscription metrics.

Conclusion
This incident demonstrates the operational value of comprehensive observability for consensus clients. While dashboards do not replace formal debugging or post-mortem analysis, they provide immediate, actionable visibility into client health and network participation
The presented incident was clearly detectable through multiple independent metric dimensions — synchronization lag, block processing, peer connectivity, network utilization, and database activity. Such multi-layered visibility enables operators to rapidly identify anomalies, assess severity, and take corrective action within minutes rather than hours.
Additionally, the identification of a missing connected peers distribution metric following a late-2025 release further illustrates another key benefit of long-term metric tracking. Continuous monitoring across versions does not only help detect runtime failures; it also exposes regressions, metric inconsistencies, and unintended changes in observability itself. Without structured dashboards and historical comparisons, such issues can easily remain unnoticed.
In short, well-designed and consistently maintained dashboards are not merely visualization layers. They form an essential operational interface to the Ethereum ecosystem — enabling validation teams, infrastructure operators, and researchers to detect incidents, validate fixes, compare client behavior, and continuously improve reliability.