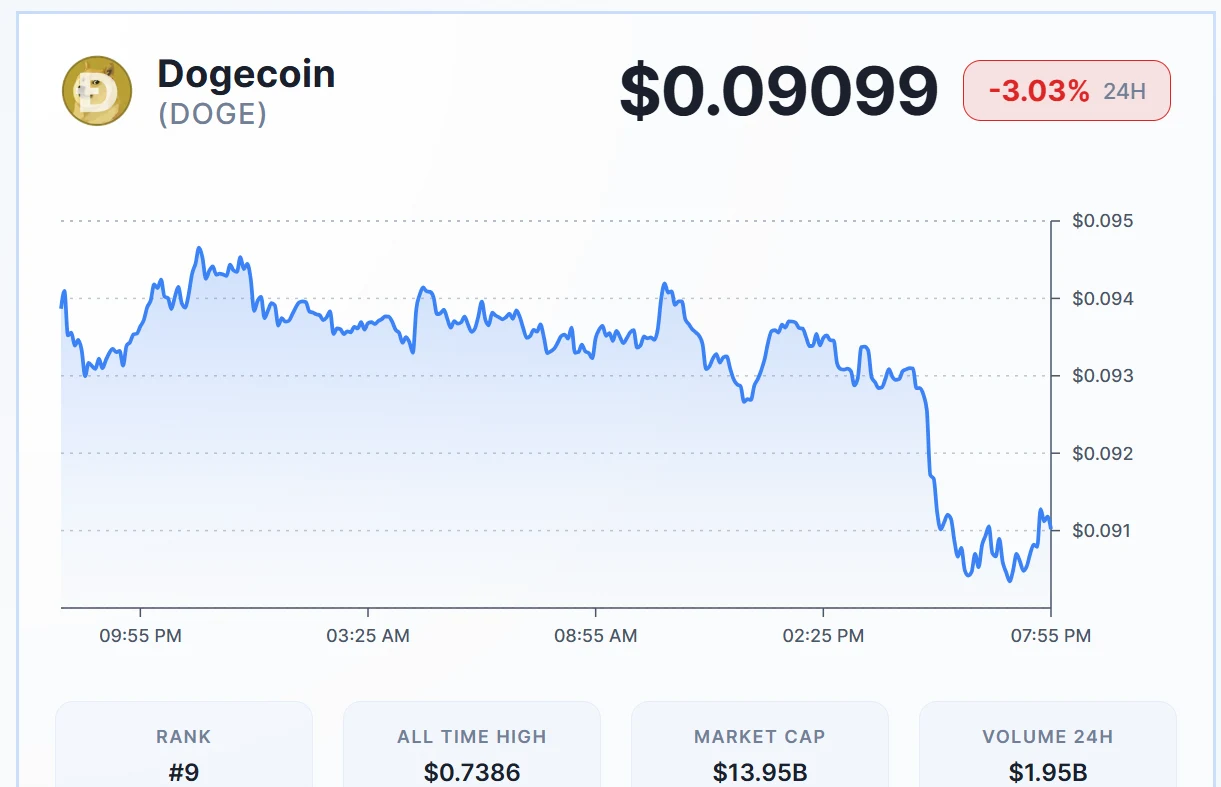
Dogecoin is trading at $0.09099, showing a clear short-term bearish trend. Earlier in the session, the price hovered near $0.0944, but steady selling pressure pushed the market lower throughout the day. The decline accelerated later, leading to a sharp drop toward the $0.091 area before stabilizing slightly around the current level. Overall, this move represents an approximate 3.03% decrease from the earlier high. This suggests sellers currently dominate the market while buyers attempt to defend the $0.090 support zone.
$DOGE Price Consolidates in Triangle With $0.080 Support at Risk
According to the analyst CryptoPulse, the chart indicates that Dogecoin ($DOGE) remains in a broader bearish trend on the daily timeframe. Price has been forming lower highs since the previous peak near the $0.15 region. Recently, the market stopped falling aggressively and moved into consolidation. The candles are compressing between two trendlines. This structure forms a symmetrical triangle or pennant pattern. Such patterns usually signal a pause before the next strong move.
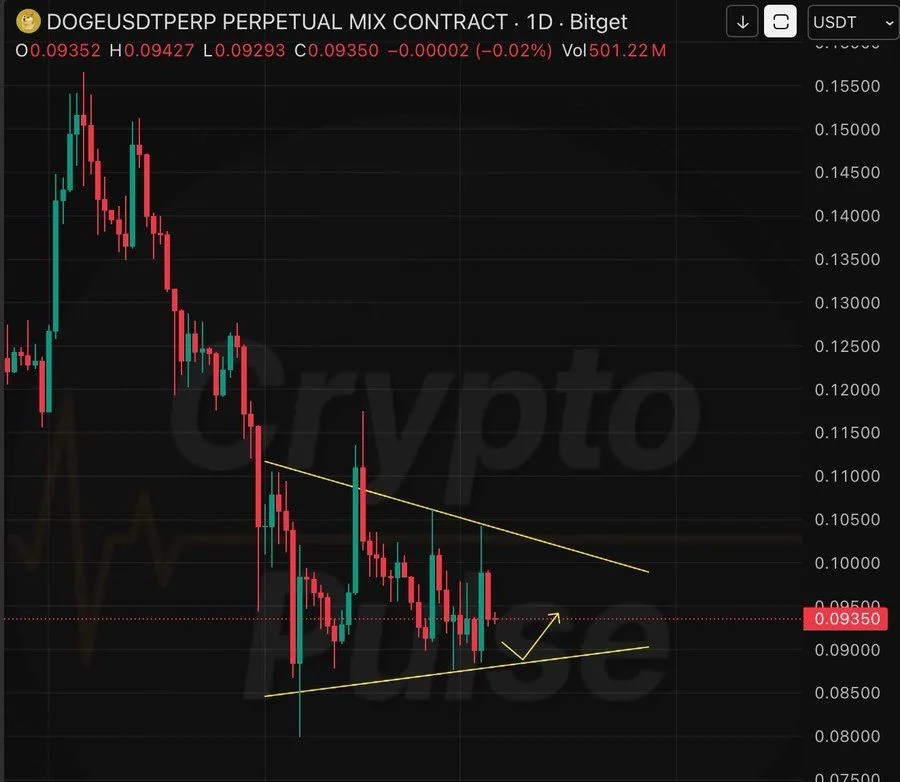
In the short term, the direction depends on a breakout or breakdown from this triangle. If buyers fail to push the price higher, $DOGE could drift lower toward the pennant support near $0.080. This level acts as the key support zone in the current structure. A breakdown below it may extend the bearish trend. However, if the price breaks above the upper trendline, momentum could shift and trigger a short-term recovery. The next move will likely be decided once the price exits the triangle.
Dogecoin Price Holds $0.09 Support as Momentum Stabilizes
The 1-day Dogecoin chart shows a clear bearish trend over the past several days. Price peaked earlier and then began forming lower highs and lower lows, confirming sustained selling pressure. Recently, the market has moved into a tight consolidation near the $0.09 area, where several candles cluster around the same support level. This behavior suggests sellers still dominate the broader trend, while buyers are attempting to defend the current support zone and prevent a deeper decline.
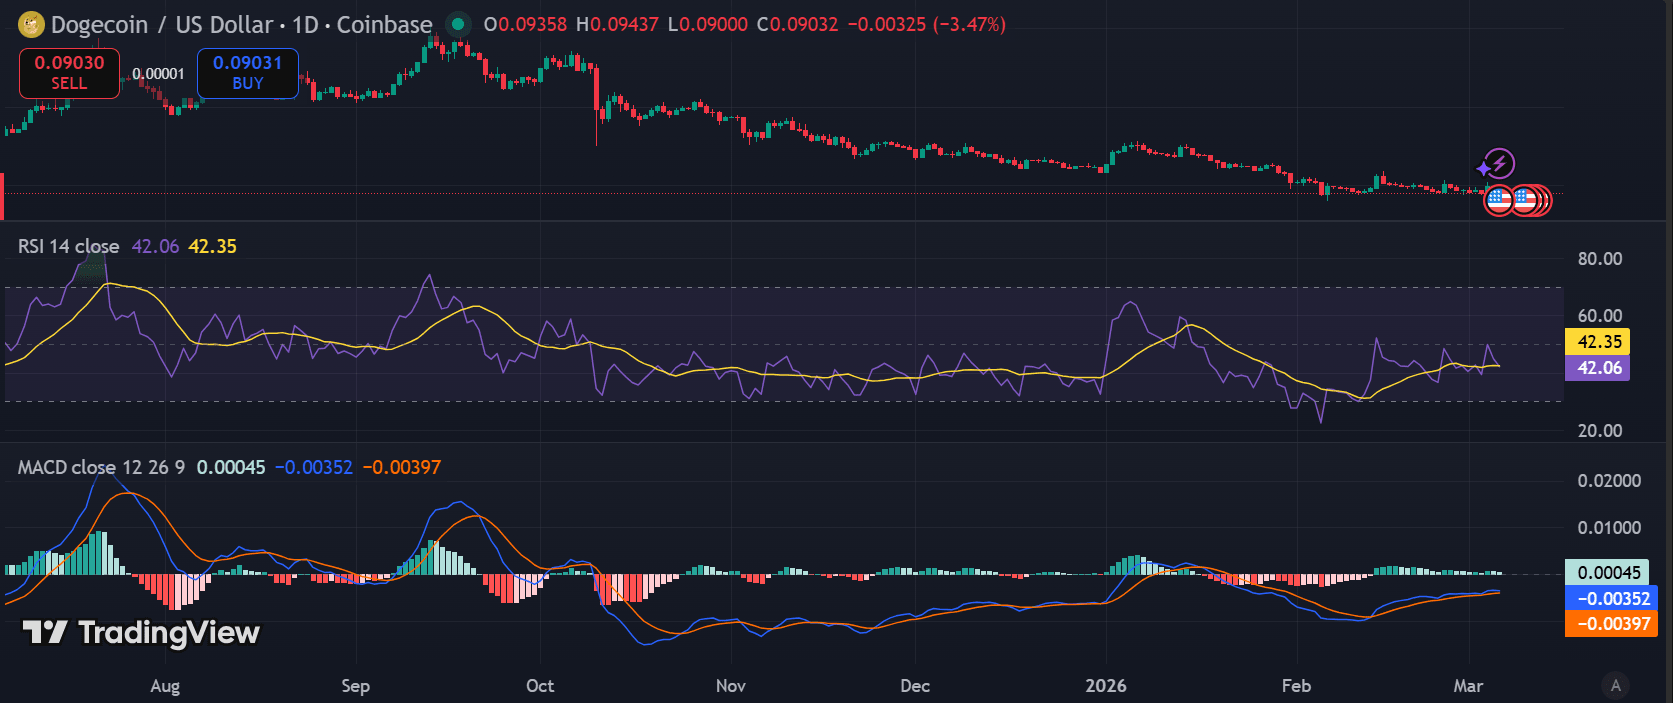
The RSI is currently at 42, indicating that bearish momentum persists, although it is not in oversold territory. Meanwhile, the MACD remains slightly negative, with the MACD line still below the signal line and the histogram close to zero. This indicates fading downside momentum but not yet a confirmed bullish reversal, suggesting the market may continue consolidating unless stronger buying pressure appears.