


Market Overview
Market Summary
This week, the cryptocurrency market exhibited a volatile upward trend, with both BTC and ETH showing fluctuating gains. BTC rose 3.09% this week, ETH increased 1.82%, and TOTAL3 climbed 0.39%. The market sentiment index rose to 12, remaining within the extreme fear range overall.
Stablecoin Market Dynamics
The total market capitalization of stablecoins showed an upward trend, with USDT and USDC both rising:
- USDT: Market cap reached $183.9 billion, up 0.54% week-over-week. This halted the previous outflow trend, with an additional $1 billion added this week. As market prices rose this week, capital primarily from non-US investors began flowing back in.
- USDC: Market cap of $77.2 billion, up 2.93% week-over-week. Continued last week’s capital inflow trend, but this week’s growth accelerated significantly, exceeding $2 billion in scale. This reflects continued capital inflows primarily from U.S. investors.
BTC Market Trading Volume
This week’s BTC market trading activity showed a slight increase compared to last week. Data shows that the combined trading volume of BTC on Binance and Coinbase reached 291,346 BTC this week, up from 267,699 BTC last week. Specifically, Binance’s volume increased from 179,267 BTC to 196,945 BTC, while Coinbase’s volume rose from 88,432 BTC to 94,401 BTC.
BTC ETF Market Trading Volume
This week’s BTC ETF market trading volume increased compared to last week. Taking BlackRock’s IBIT — the largest by market share — as an example, this week’s trading volume reached 406 million shares, a significant rise from last week’s 289 million shares.
Market Driver Analysis
Positioning Dynamics: ETF and Treasury Firm Buying Power Rebounds, Bullish Dominance Emerges
This week witnessed a notable rebound in buying power from BTC and ETH spot ETFs alongside listed treasury companies, serving as the core support for market stabilization. Notably, this week marked the first instance in recent memory where daily purchases consistently exceeded sales, signaling a substantive shift in the balance of power between buyers and sellers. The substantial increase in spot ETF buying power sent a clear signal that market investors are actively bottom-fishing, indicating that institutional confidence is gradually recovering after a prolonged downtrend.
Derivatives-Driven: Massive Long Position Entry in Futures Markets, Short Squeeze Fuels Price Surge
The most direct catalyst for this week’s volatile rally stemmed from structural shifts in the futures market. Massive bullish capital inflows, combined with forced liquidations and voluntary unwinding of short positions, created a classic “short squeeze” scenario. This drove stepwise price increases across the market, effectively stimulating participants’ bullish sentiment and providing the most direct price momentum for this week’s upward trend.
Geopolitical Desensitization: Middle East Tensions’ Impact Marginally Declining, Uncertainty Premium Gradually Digesting
Although conflict persisted in the Middle East this week with no clear signs of de-escalation, market sensitivity to this geopolitical risk is undergoing a structural shift. Investor pricing of Middle East developments has become increasingly rational, significantly reducing its marginal impact on the crypto market. Risk premiums triggered by geopolitical uncertainty are being progressively absorbed by the market, objectively diminishing the interference of external negative factors on market sentiment.
Macro Positive: Nonfarm Payrolls Miss Estimates, Reviving Rate Cut Hopes
Friday’s U.S. February employment data emerged as a key macro variable. The unemployment rate registered 4.4%, exceeding market expectations, while seasonally adjusted nonfarm payrolls fell by 92,000 — significantly below both the prior reading and forecasts. Although some deviations were linked to strikes in the U.S. healthcare sector, the overall cooling signals in the labor market effectively reinforced market expectations for future Fed rate cuts, providing positive sentiment support for risk assets.
Macro Concerns: Weakening PMI and Retail Data, Stagflation Fears Weigh on Markets
However, this week’s macro data was not entirely positive. Both the February ISM Manufacturing PMI and January Retail Sales MoM figures underperformed, indicating a synchronized weakening in U.S. consumer spending power and manufacturing vitality. This combination of data has sparked market concerns about the U.S. economy falling into a “stagflation” trap — a scenario where economic growth stagnates while inflationary pressures persist — which has partially offset upward momentum in the market.
Key Events Forecast for Next Week
Inflation Data: CPI and Core PCE Will Directly Shape Rate Cut Path
The most critical macroeconomic variables next week are the U.S. February seasonally adjusted CPI year-on-year rate and the U.S. January core PCE price index year-on-year rate. Inflation data serves as the primary reference point for the Federal Reserve’s monetary policy decisions, directly determining the timing and pace of rate cuts. Should the data come in stronger than expected, it would significantly compress the scope for rate cuts, exerting a pronounced bearish impact on the market. Conversely, if the data remains moderate, it could further bolster the bullish sentiment that began to take shape this week.
Geopolitical Risks Remain a Concern: Middle East Developments Impact Oil Prices and Risk Sentiment
Although market sensitivity to Middle East tensions has eased, this risk factor remains unresolved and warrants ongoing monitoring. The region’s instability is directly linked to international oil prices. Should conflict intensity exceed current market expectations or escalate unexpectedly, it could inflict severe short-term damage on global risk assets — with the crypto market unlikely to remain unscathed.
Key Observation Indicators: Sustainability of ETF and Treasury Company Purchasing Power
Fund flows in spot ETFs and listed treasury companies will remain the most critical barometer of market sentiment next week. While this week’s rebound in purchasing power is encouraging, its sustainability remains to be seen. This indicator not only directly influences short-term price movements but also serves as a core gauge of institutional investor confidence and overall market sentiment, warranting high-frequency tracking and close attention.
Market Outlook
Bullish and Bearish Forces Intertwined: Positive Signals Emerge, but Underlying Macro Logic Remains Unchanged
This week’s market achieved an oscillating rise amid multiple converging factors, showing positive marginal changes in bullish momentum. However, significant uncertainties persist regarding whether inflation pressures are truly under control and whether the weakening employment data is sustainable. The current rally primarily reflects technical corrections and improving sentiment, while the underlying fundamentals of the market have not fundamentally shifted, leaving the overall situation in a fragile equilibrium.
Strategic Guidance: Caution First, Defense Over Offense
Until next week’s release of CPI and core PCE data, and further clarity on the Middle East situation, the window of market uncertainty remains open. Given the potential for rapid contraction in buying power from Treasury companies and spot ETFs under adverse data or escalating geopolitical risks, the market could experience a swift pullback. Therefore, investors should maintain a defensive operational logic next week, controlling position exposure and adopting a wait-and-see approach until trend signals become clearer before making decisions.
Next Week’s Forecast Targets
Bearish Targets: LINEA, STRK
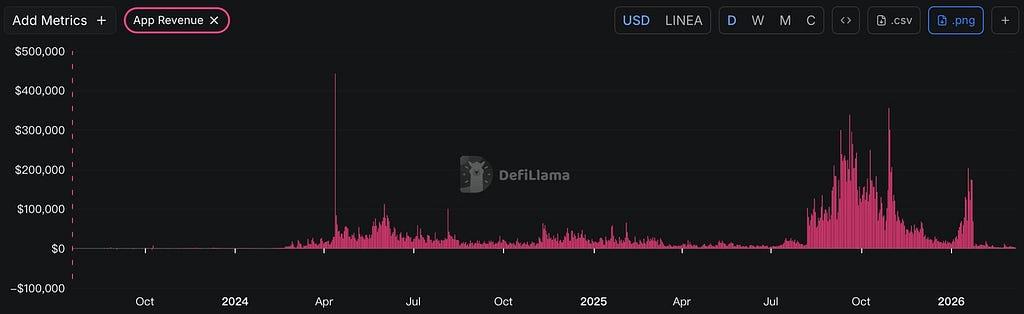
LINEA: Comprehensive collapse of core metrics amid dual pressures from massive token unlocking and liquidity crisis
Project Fundamentals and Positioning
Linea is an Ethereum Layer 2 scaling solution designed to deliver higher transaction throughput and lower fees for the Ethereum ecosystem while maintaining compatibility and security with the Ethereum mainnet.
Fundamental Data Severely Deteriorated
- TVL Plummets: Linea’s TVL has plummeted from its peak of $1.683 billion to $98.3 million, a 94.15% decline, indicating rapid user exodus from its on-chain ecosystem.
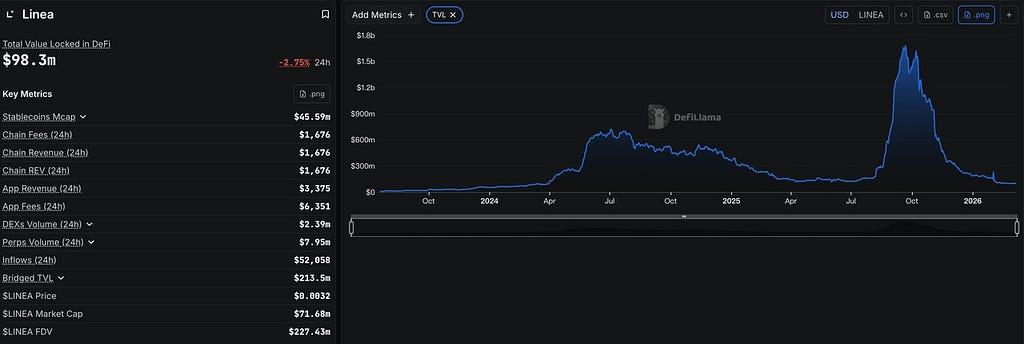
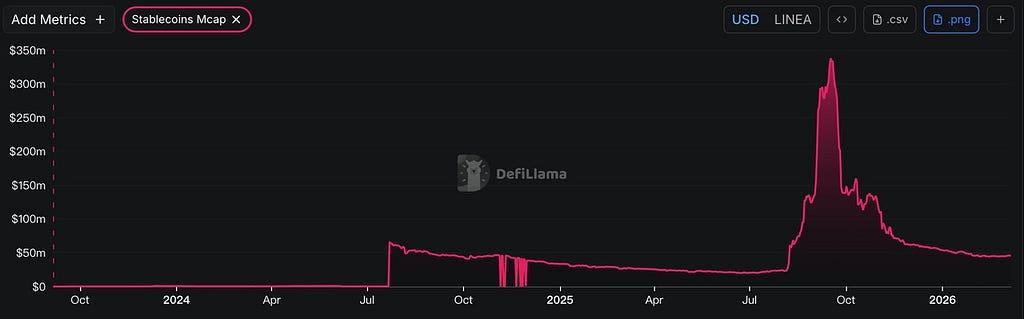
- Stablecoin market cap shrinks dramatically: On-chain stablecoin market value has plummeted from $337 million to $45.62 million over the past month, a 86.46% decline, indicating continuous capital outflow from the Linea ecosystem.
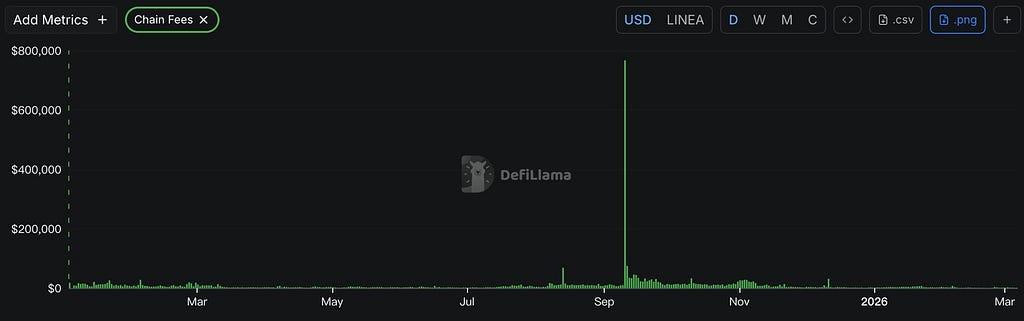
- On-chain activity significantly reduced: Linea’s daily transaction fees have dropped to approximately $1,500, reflecting a sharp decline in active users.
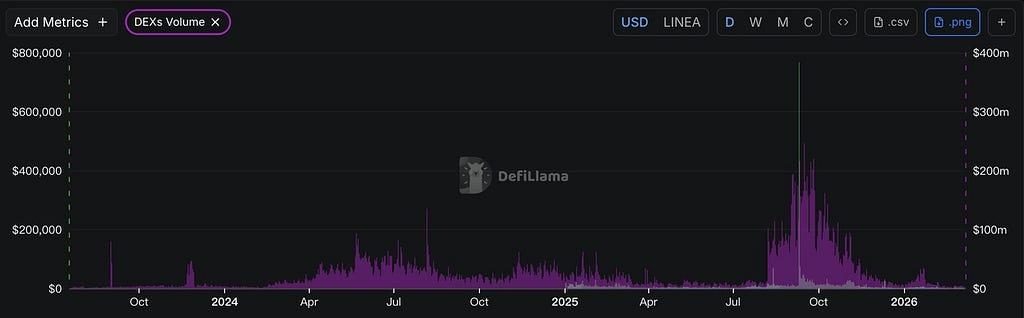
- Persistent decline in DEX trading volume: On-chain DEX trading volume has been trending downward, plummeting from $219 million/day to $2 million/day — a, a 99.08% drop.
- Sluggish ecosystem project revenues: Linea on-chain application revenues show a rapid decline, with total daily project revenues now only around $3,000.
Token Unlock Risk Assessment
- Unlock scale and structure: 1.44 billion LINEA tokens will unlock on March 10, representing 2% of the total locked supply. Given current limited market liquidity, this unlock will significantly disrupt market supply-demand equilibrium.
- Unlock recipient risk: Under the linear unlocking schedule, this release primarily affects institutional investors and the project team. These holders possess strong cash-out incentives and selling pressure amid deteriorating project fundamentals.
- Severely Insufficient Market Absorption Capacity: LINEA tokens have an average daily trading volume of approximately $2.8 million. Relative to the unlock scale, market liquidity is extremely scarce, making it difficult to effectively absorb the selling pressure from the large token supply increase.
Summary
Linea faces multiple overlapping systemic risks: Fundamentally, TVL has declined by 94.15%, stablecoin market cap has shrunk by 86.46%, and all key metrics have deteriorated comprehensively. Liquidity-wise, the March 10th unlock of 1.44 billion tokens will generate massive selling pressure within the limited liquidity of $2.8 million daily average. The convergence of these bearish factors will exert sustained negative pressure on the LINEA token price, posing severe survival challenges for the project.
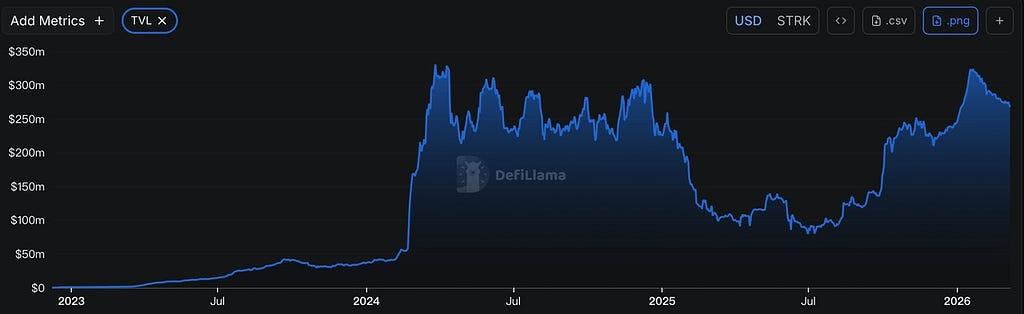
STRK: Five Core Metrics in Critical Condition — How Will Massive Unlocking in Weak Liquidity Define StarkNet’s Fate?
Project Fundamentals and Positioning
StarkNet is an Ethereum-based Layer 2 solution employing zero-knowledge rollup (ZK-Rollup) technology. It aims to achieve unlimited scalability for Ethereum computations while preserving the network’s security and composability. This enables developers to build scalable decentralized applications (dApps) without compromising mainnet security.
Fundamental Metrics Severely Deteriorate
- TVL Plummets: StarkNet’s Total Value Locked (TVL) has recently experienced a sharp decline, dropping from a peak of $321 million to $267 million — a, a 16.82% decrease over 40 days — reflecting a rapid user exodus from the StarkNet ecosystem.
- Near-Stagnant On-Chain Activity: StarkNet’s daily on-chain fees amount to only $2,000, indicating extremely low user engagement and rendering the chain nearly “dead.”
- Persistent Decline in DEX Volume: On-chain DEX daily trading volume currently stands at just $8 million and continues to fall, signaling severely insufficient ecosystem activity.
- Minimal ecosystem project revenue: Daily income from StarkNet on-chain applications is only about $400 and continues to decline, reflecting the entire ecosystem’s extreme downturn.
- User growth has stalled: Daily new users are less than 100, and daily active users are gradually decreasing, indicating users are continuously exiting the StarkNet ecosystem.
Token Unlock Risk Assessment
- Unlock scale and timing are unfavorable: On March 15, 163.03 million STRK tokens will be unlocked, representing 1.63% of the total locked supply. This large-scale unlock occurs at a critical juncture when the project’s fundamentals continue to deteriorate.
- Seriously Insufficient Market Absorption Capacity: STRK tokens have an average daily trading volume of only around $2 million. Compared to the scale of tokens about to be unlocked, market liquidity is clearly insufficient to effectively absorb the selling pressure.
- Strong selling motivation among unlock recipients: Under the linear unlocking schedule, this release primarily involves institutional investors and the project team. Given the project’s current downturn, these holders possess strong cash-out incentives and are highly likely to exit via selling.
- Weak liquidity depth: The relatively low daily trading volume reflects insufficient market depth, unable to effectively cushion price shocks from token unlocking.
Summary
The StarkNet project faces multiple systemic risks: At the market level, the L2 sector as a whole is experiencing a crisis of confidence, facing criticism for exacerbating the fragmentation of the Ethereum ecosystem, and the project has failed to establish a differentiated advantage within this space. At the operational level, TVL has plummeted by 16.82% in a short period, on-chain activity has nearly stalled, and user engagement remains extremely low. On the capital front, the upcoming unlocking of 163.03 million STRK tokens on March 15 will create significant selling pressure in a market with weak liquidity and an average daily trading volume of just $2 million. The unlocking entities are primarily investment institutions and the project team, who have strong incentives to cash out. The convergence of these multiple negative factors exerts sustained downward pressure on the STRK token price, making it difficult to reverse the downward trend in the short term. The project has already exhibited characteristics of a “dead chain.”
Next Week’s Token Unlock Schedule
(Amounts Exceeding $1 Million)
This Week’s Hot Topics
As DeFi Suffers Widespread Losses, How Did Vault Bridge Push Its TVL Past $600 Million in Just Five Days?
Event Background
Amid recent crypto market declines driven by multiple factors, most DeFi projects have experienced significant TVL drops. This reflects users’ current capital flight from crypto markets, with on-chain investments bearing the brunt as funds continuously exit DeFi projects. Amid this challenging landscape, Vault Bridge’s TVL experienced explosive growth over the past week, surging 366% within five days and surpassing $100 million in scale. This phenomenon warrants close attention and analysis within the current persistently bearish market environment.
Vault Bridge is an innovative cross-chain yield generation mechanism launched by Polygon Labs, designed to convert bridged assets (TVL) between Ethereum and EVM chains into sustainable returns. Built upon the Morpho lending protocol and the ERC-4626 standard, it offers Layer 2 and new chains a solution to earn yields and support ecosystem growth without requiring a complete overhaul of core bridging infrastructure.
Data Analysis
TVL
Vault Bridge’s TVL data reveals explosive growth within a week, not only surpassing previous historical highs but also exceeding $600 million in scale.
Fee Revenue
For a DeFi project, fee revenue reflects genuine on-chain usage. Vault Bridge’s fee income demonstrates that this growth is driven by actual user adoption rather than concentrated large-scale capital inflows.
TVL Composition
Vault Bridge’s TVL composition reveals that its total value is primarily comprised of USDT and USDC. This rapid TVL surge is primarily attributable to the injection of these two stablecoins.
Reason of Data Growth
Mechanism Revolution: From “Idle Assets” to “Productive Foundation”
Vault Bridge’s core mechanism disrupts the traditional cross-chain bridge dilemma where assets become “locked and idle.” According to Agglayer’s official documentation, assets deposited into the Ethereum Vault Bridge contract (e.g., USDC, USDT) are automatically routed to curated yield vaults. The protocol distributes returns to holders through periodic issuance of vbTokens (e.g., vbUSDC). These vbTokens can be cross-chained to Layer 2 networks and redeemed 1:1 on Ethereum, ensuring asset liquidity. This mechanism has attracted numerous Layer 2 networks and applications to adopt it as a “yield foundation,” as interest previously lost during cross-chain transfers now flows back to ecosystem participants via Vault Bridge.
CEX Onboarding Channels and Katana Earn’s “One-Click Entry”
The expansion of distribution channels directly fueled this TVL surge. According to Katana’s official disclosure, Katana Earn officially launched on Binance Wallet and OKX On-Chain Earn in early March 2026. This initiative dramatically lowered the barrier for ordinary users to participate in DeFi, enabling “one-click deposits into Morpho yield vaults.” Data indicates this integration channeled over $250 million in capital within 24 hours. Binance provided a 50 million KAT reward pool (representing 0.5% of total supply), while OKX offered a 65 million KAT reward pool. The substantial early participation rewards (≥100 USDC threshold) attracted massive retail users to enter via CEX wallet pathways.
“Leveraged Yield Positive Feedback” Triggered by Negative Borrowing Rates.
With the massive influx of stablecoins, the Vault Bridge and Morpho lending markets presented a rare “negative interest rate” opportunity. According to Steakhouse Financial’s report, on the Katana chain, borrowing vbUSDC and collateralizing vbETH or vbWBTC saw rates drop to approximately -13%. This meant borrowers not only avoided interest payments but received additional subsidies. Concurrently, Steakhouse’s AUSD Turbo strategy offered up to 13.5% APY, while AUSD High Yield Term provided 9% APY. This arbitrage opportunity — “borrowing stablecoins at low/negative cost → reinvesting into high-yield vaults/activity pools” — has driven institutional and whale capital to leverage incentives, resulting in daily stablecoin inflows exceeding $120 million and propelling TVL to new heights.
Investor Participation in Sentora Strategies
Basic Wealth Management — Binance Wallet Activity Pool
The optimal entry point for ordinary users with zero barriers, featuring extremely simple operation logic: Prepare at least 100 USDC, cross-chain to the Katana network, and deposit into the Morpho vbUSDC activity pool to participate in sharing the 50 million KAT reward pool (representing 0.5% of total supply). This strategy incurs minimal gas fees (0.0001–0.00025 ETH), with funds arriving in approximately 5 minutes and no lock-up period for redemption. Featuring virtually zero liquidity risk, it serves as the preferred tool for risk-averse users to participate in KAT ecosystem pre-TGE incentives.
Ecosystem Reinvestment — OKX On-Chain Earn Path
A parallel incentive channel designed exclusively for OKX users. By staking USDT/USDC directly into the Morpho (Katana) Vault via OKX’s On-Chain Earn section, users can participate in a larger 65 million KAT reward pool. Its yield structure combines interest from underlying Vault Bridge assets with pre-TGE point/token incentives. The interface is user-friendly for existing OKX users, though redemption speed depends on CEX node processing efficiency, resulting in slightly lower liquidity flexibility than Strategy 1.
Yield Enhancement — Steakhouse AUSD Portfolio Strategy
Targeted at advanced users seeking excess alpha, deposit into Steakhouse App’s AUSD Turbo Vault (13.5% APY) or AUSD High Yield Term Vault (9% APY) to earn higher base yields. However, this strategy is explicitly labeled as “CC ratings” risk level. The trade-off for enhanced returns is a more complex risk structure: the Turbo strategy amplifies volatility exposure through leverage, while the Term strategy carries term premium and potential liquidity constraints. Suitable for users with DeFi risk management experience to participate cautiously.
Portfolio/Leverage Strategy — Arbitrage Using “Negative Borrowing”
This is an extreme market pricing arbitrage strategy designed for professional users. Its core logic exploits the current market imbalance generating a -13% negative borrowing rate — borrowers can use vbETH or vbWBTC as collateral to borrow vbUSDC without paying interest, instead receiving an interest subsidy. Borrowed vbUSDC can then be directed into activity pools or AUSD Turbo vaults, achieving a “triple yield stack” of Negative Interest Subsidy + Vault APY + KAT Token Rewards.” However, extreme caution is required regarding forced liquidation risks from sharp collateral price volatility and strategy failure risks when negative interest parameters rapidly converge upon market liquidity normalization.
Crypto Events Next Week
- Wednesday (March 11): U.S. February seasonally adjusted CPI annual rate; U.S. February seasonally adjusted CPI monthly rate
- Thursday (March 12): U.S. initial jobless claims for the week ending March 7
- Friday (March 13): U.S. January core PCE price index annual rate
Market Overview
By weekly return, the DeFi sector performed best while the AI sector underperformed.
- DeFi Sector: LINK, HYPE, UNI, AAVE, and SKY dominate the DeFi sector with a combined weight of 82.27%. Weekly price changes: 0.23%, 5.71%, 1.25%, -1.76%, 7.13%. This indicates that the largest projects in the DeFi sector outperformed counterparts in other sectors this week, driving the sector’s overall leadership.
- AI Sector: In the AI sector, TAO, WLD, RENDER, VIRTUAL, and FET hold substantial market shares, collectively accounting for 84.21%. This week’s declines were: -1.86%, -2.09%, -5.66%, -0.98%, and -8.63%. It is evident that projects with a heavier weighting in the AI sector experienced steeper declines this week compared to other sectors, resulting in the AI sector’s worst performance.
Summary
The cryptocurrency market overall showed a volatile upward trend this week. BTC and ETH recorded weekly gains of 3.09% and 1.82%, respectively. The market sentiment index rose slightly to 12 but remains deeply entrenched in the “extreme fear” zone. Funding indicators released positive signals: USDT market cap, primarily driven by non-US investors, increased by 0.54% week-on-week, adding approximately $1 billion and reversing the previous trend of sustained outflows. USDC market cap, dominated by US investors, grew by 2.93%, with weekly inflows exceeding $2 billion, continuing last week’s inflow momentum with significantly enhanced strength. This bullish pattern emerged primarily due to three catalysts: the direct impact of short squeezes in the futures market, the rebound in purchasing power from spot ETFs and treasury companies (achieving positive daily net purchases for the first time this week), and renewed rate cut expectations sparked by the significantly weaker-than-expected U.S. February nonfarm payroll data (seasonally adjusted at -92,000 jobs, with unemployment rising to 4.4%). However, the simultaneous weakening of the U.S. February ISM Manufacturing PMI and January Retail Sales MoM data triggered market concerns about a “stagflation” dilemma, exerting some offsetting pressure on upward momentum.
Despite the overall market remaining in a panic zone, innovative DeFi mechanisms like Vault Bridge bucked the trend this week. Its TVL surged 366% over five days, surpassing $600 million — a striking achievement amid sustained capital outflows from the broader DeFi sector. This explosive growth was no accident, precisely aligning with the market’s core demand for “low-risk yield generation.” Vault Bridge breaks the traditional cross-chain asset dilemma of “locked equals idle” by automatically routing assets locked via cross-chain bridges to Morpho’s yield-generating vaults. Combined with Katana Earn’s simultaneous integration into two major CEX distribution channels — Binance Wallet and OKX On-Chain Earn — it channeled over $250 million in daily inflows. Leveraging the rare market opportunity of -13% negative borrowing rates for arbitrage, it attracted institutional and whale capital to amplify incentive returns through leverage. Its stair-step TVL surge starkly contrasts with DeFi’s broader downturn, reaffirming that projects with clear yield logic and robust distribution channels remain capital magnets even in weak markets.
Looking ahead to next week, the market faces a concentrated test of multiple critical variables. On the macro front, Wednesday’s release of U.S. February CPI data and Friday’s January core PCE price index annual rate will directly shape market expectations for the Fed’s rate cut trajectory, serving as the most pivotal pricing anchor for next week’s movements. Should inflation data exceed expectations, the bullish sentiment tentatively established this week will face a severe test. Geopolitically, while the Middle East situation shows signs of marginal desensitization, the persistent tail risks of escalation cannot be ignored. On the capital front, whether spot ETFs and treasury companies can sustain their purchasing power will be the key barometer for judging whether the broader market can hold critical support levels. Overall, the market currently exists in a fragile equilibrium between bulls and bears. Until key data is released and the situation becomes clearer, investors should adhere to defensive strategies, prioritizing caution over aggression. Strictly manage position exposure, remain patient, and wait for clear trend signals before making decisions.


