Author: Coingecko
Compiled by: Felix, PANews
After a turbulent end to 2025, Bitcoin continued its downward trend in early 2026. Meanwhile, geopolitical and macroeconomic events drove up prices for gold, silver, and recently, crude oil. As cryptocurrencies continue to gain mainstream acceptance as an asset class, many Wall Street investors may be experiencing their first crypto bear market. Coingecko examines the performance of cryptocurrencies relative to other traditional asset classes at the start of 2026.
With the outbreak of war with Iran, crude oil prices are expected to surge faster than any other asset class in 2026.
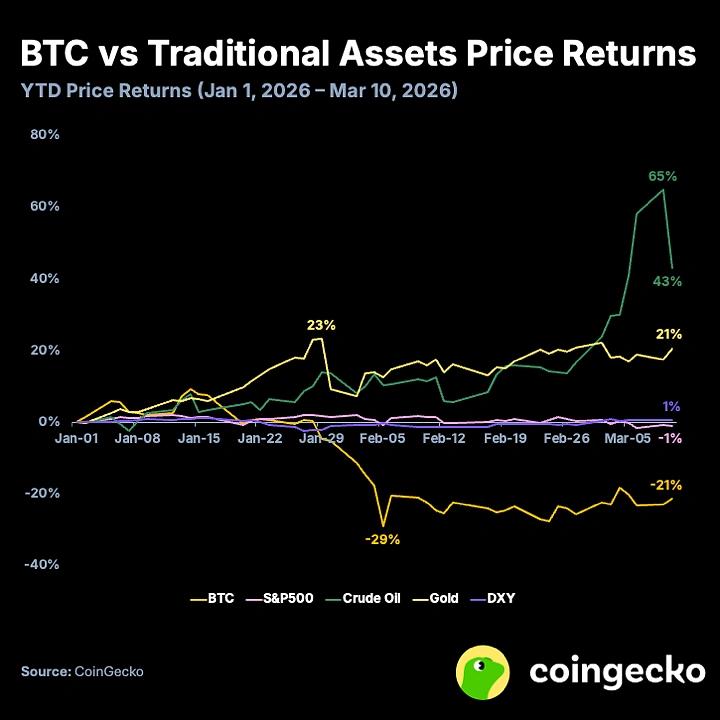
Since the beginning of 2026, crude oil prices had been slowly rising, influenced by escalating tensions in the Middle East and supply shortages in key markets. However, the situation reached its peak with the latest attack on Iran by the United States and Israel on February 28. Crude oil prices reached as high as $119.48 during trading, compared to just $57.41 at the beginning of the year.
Meanwhile, Bitcoin's price continued to decline in 2026, becoming the worst-performing asset class by far. However, since early March, Bitcoin appears to have found support between $65,000 and $75,000, after falling to a low of $62,800 in early February. The US spot Bitcoin ETF has seen strong inflows since the end of February (net inflows of $1.9 billion since February 20, but still outflows of $828.9 million year-to-date), while Strategy continues its consistent buying spree, having invested $5.6 billion since the beginning of the year.
Since 2026, cryptocurrencies have shown only a moderate correlation with the S&P 500 and gold, which may be a signal that asset classes are finally beginning to "decouple".
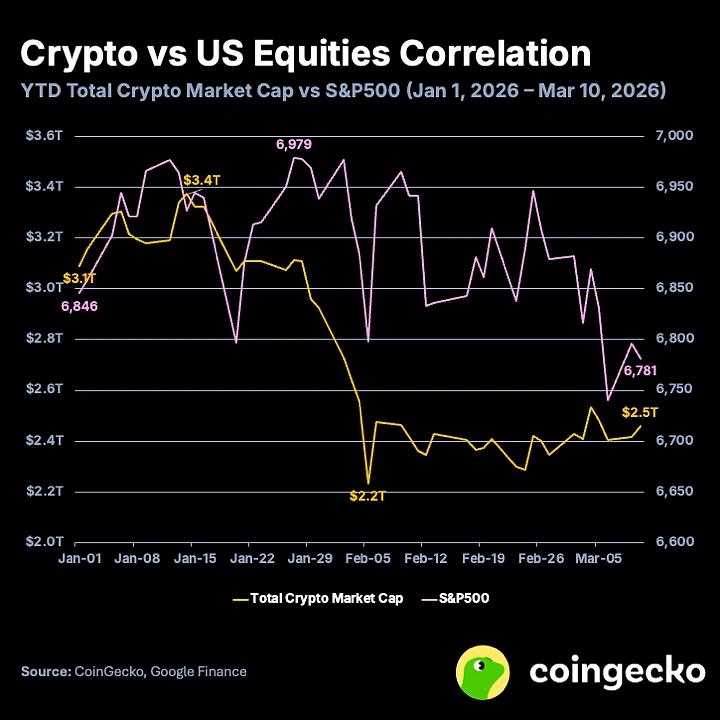

Since the beginning of the year, the correlation between the total market capitalization of cryptocurrencies and the S&P 500 index is 0.49, indicating a moderately positive correlation, similar to the situation in 2025 (when the annual correlation was 0.46). On the other hand, the correlation between cryptocurrencies and gold has turned to -0.69 year-to-date, indicating a moderately negative correlation. In 2025, the correlation between cryptocurrencies and gold was only 0.19, showing a weak or no correlation. Overall, cryptocurrencies, as an asset class, are shedding the long-held perception of being purely risky assets as they are decoupling from US stocks.
US stocks, represented by the S&P 500, also face significant headwinds in 2026. Despite increasing investment in AI and generally strong economic and financial data, the index has actually declined since the beginning of the year. Geopolitical tensions have undoubtedly played a role, but the ongoing uncertainty surrounding the impact of AI on the future economy and workforce has also triggered a “SaaS doomsday.” Since the beginning of the year, the market capitalization of listed software and SaaS companies has evaporated by $1.3 trillion to $1.5 trillion, accompanied by a sharp decline in forward price-to-earnings ratios and revenue multiples.
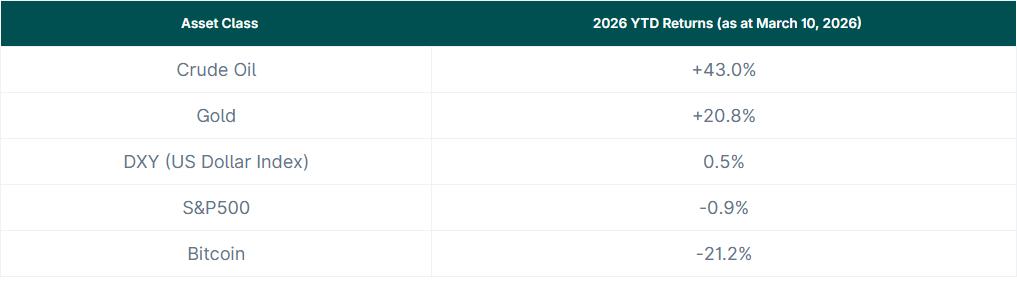
Furthermore, gold has continued its strong momentum since 2024, with a year-to-date gain of over 20%. Gold is generally considered a sound store of value and a safe-haven asset, but due to soaring prices, it is currently exhibiting higher volatility. Ongoing geopolitical and macroeconomic pressures continue to drive its upward trend, with both retail traders and sovereign nations buying in droves.
Related reading:BTC Options Insights: Why is March 20th a key turning point for volatility?
The performance in 2026 will be very different from that in 2024. For reference, the following is the performance of Bitcoin and other asset classes in 2024 (published in December 2024).
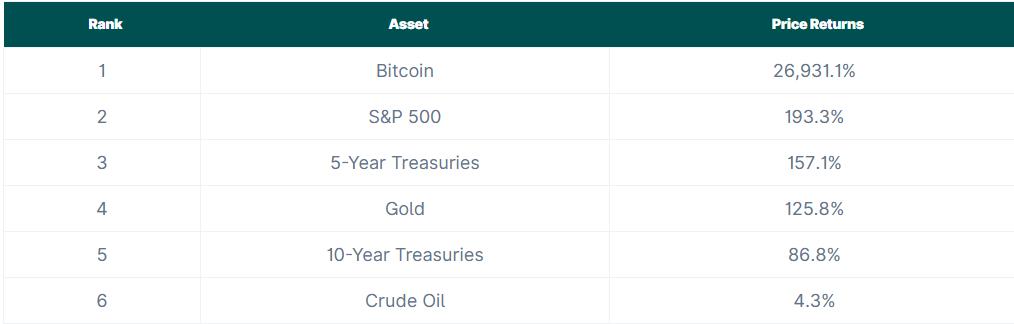
Bitcoin, hailed as the "magical internet currency," may have become a legitimate investment asset alongside traditional assets such as stocks, commodities, and bonds. Its 10-year return of 26,931.1% is truly astonishing. Imagine, a $100 investment in 2014 would be worth $26,931.1 today. While these figures are impressive, examining its performance relative to other assets in both the short and long term is equally important.
Which asset class has performed best over year-to-date, 1-year, 3-year, 5-year, and 10-year time spans?
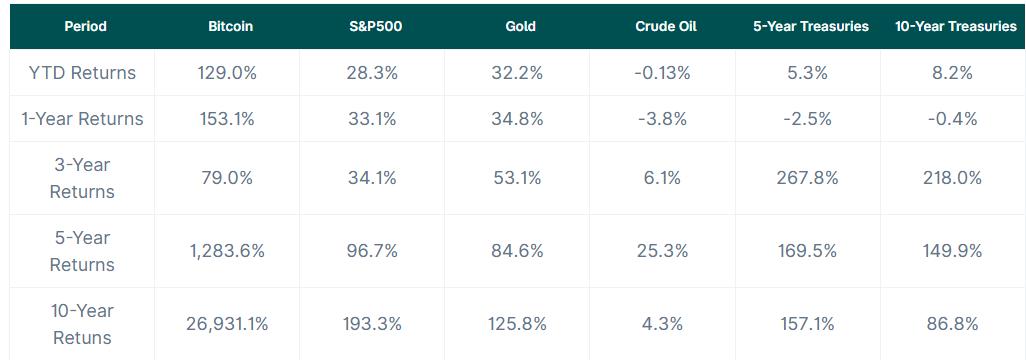
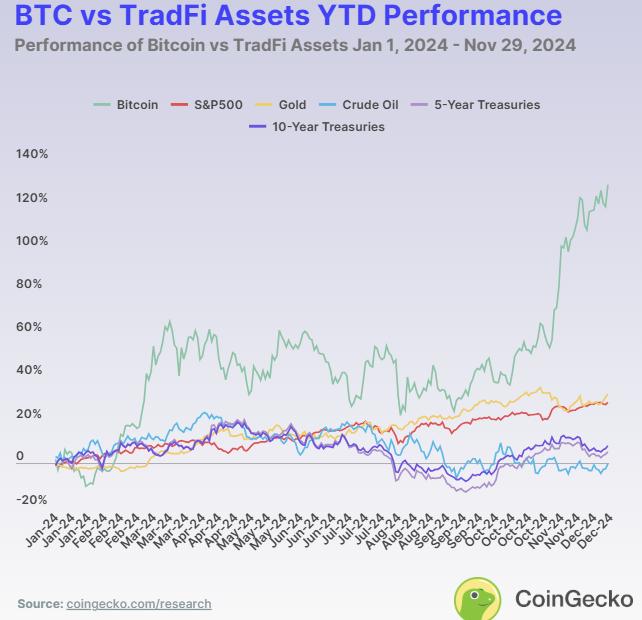
Performance over different time spans reveals the strengths and weaknesses of each asset. In 2024, Bitcoin was the best-performing asset with a return of 129.0%. Gold followed closely behind, with a year-to-date return of 32.2%, demonstrating its reliability as a traditional store of value. The S&P 500 remained strong, with a return of 28.3%. However, crude oil prices fell, resulting in a return of -0.13%, while US Treasuries offered modest returns, with the 5-year Treasury yielding 5.3% and the 10-year Treasury yielding slightly higher at 8.2%.
Over the 1-year period, Bitcoin continued to outperform other assets, with a return of 153.1%. Gold returned 34.8%, followed by the S&P 500 at 33.1%. The strong performance of these three asset classes demonstrates market stability over the past year. However, government bonds are more sensitive to economic changes, with returns of -4.3% for 5-year bonds and -2.6% for 10-year bonds. These figures reveal how bonds fluctuate with interest rates and fiscal policy.

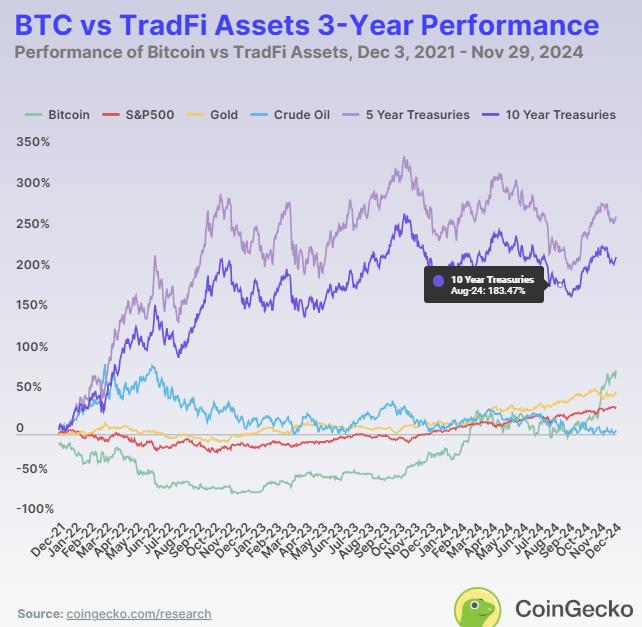
Over the three-year period, market performance shifted, with bonds gaining favor as economic stability became more crucial. US Treasury bonds led the pack, with the 5-year yield reaching 267.8%, followed closely by the 10-year yield at 218%. Bitcoin also performed well, yielding 79%, while gold came in second with a solid 53.1%, offering some safety amidst market uncertainty. Crude oil was the only asset class to underperform during this period, yielding only 6.1%.
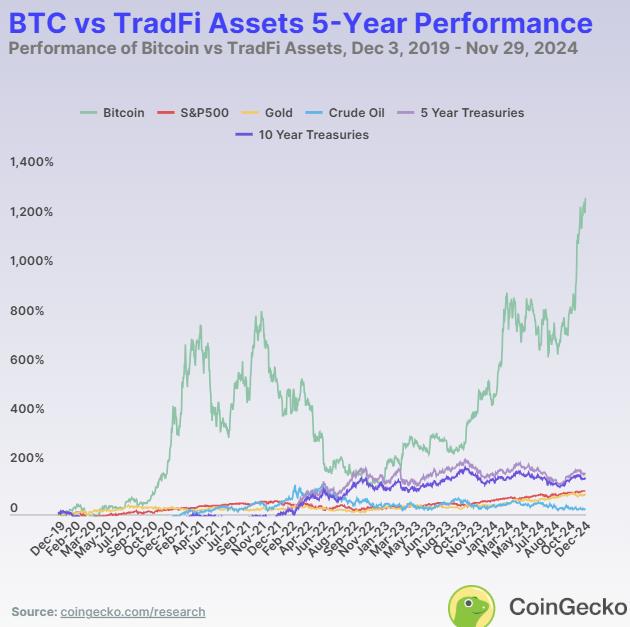
Five-year data shows that Bitcoin performed the strongest, with a return of 1283.6%. The S&P 500 and gold remained stable, with returns of 96.7% and 84.6%, respectively. US Treasury bonds also performed well, with the five-year Treasury yield at 157.1% and the ten-year Treasury yield at 149.9%. Crude oil prices rose by only 25.3%, making it relatively less attractive for long-term investment. This data suggests that Bitcoin has significant potential returns for medium-term investment, balanced by the steady growth of stocks and gold.
Over a decade, Bitcoin's growth rate of 26,931.1% is unparalleled, demonstrating its immense investment potential for early investors. While other assets have yielded far lower returns than Bitcoin, they still offer stable returns; for example, the S&P 500 has returned 193.3%, and gold 125.8%. US Treasury bonds have also maintained their value, with five-year bonds yielding 157.1% and ten-year bonds 86.8%. However, crude oil's return of only 4.3% significantly underperforms other assets.
Observations over the past decade have shown that Bitcoin is the ultimate high-growth asset, while gold, bonds, and stocks offer safer, lower-return alternatives for risk-averse investors. However, Bitcoin was still a relatively new asset at the time, with a market capitalization far smaller than other assets. It was precisely this smaller base that enabled it to grow at a faster pace.

Has Bitcoin been highly volatile over the past decade?
Bitcoin's massive price increases over the past decade have been accompanied by significant volatility. The price of Bitcoin has ranged from a low of $172.15 to a high of $103,679. The chart below clearly illustrates Bitcoin's cycles, coincidentally occurring every four years after a halving. During this decade, Bitcoin experienced two bull market cycles, in 2017-2018 and 2020-2021, and is currently in one of them. Towards the end of these cycles, the price of Bitcoin often plummets to below 70% of its peak, contributing to its high volatility. This extreme volatility highlights the high-risk, high-reward nature of Bitcoin, making it highly attractive to growth-seeking investors but challenging for those seeking stability.
Does Bitcoin's performance correlate with other assets?
Beyond volatility, Bitcoin's relationship with other major assets such as the S&P 500 and gold can further reveal its unique behavior. Correlation analysis reveals how Bitcoin may synchronize with or decouple from traditional markets:
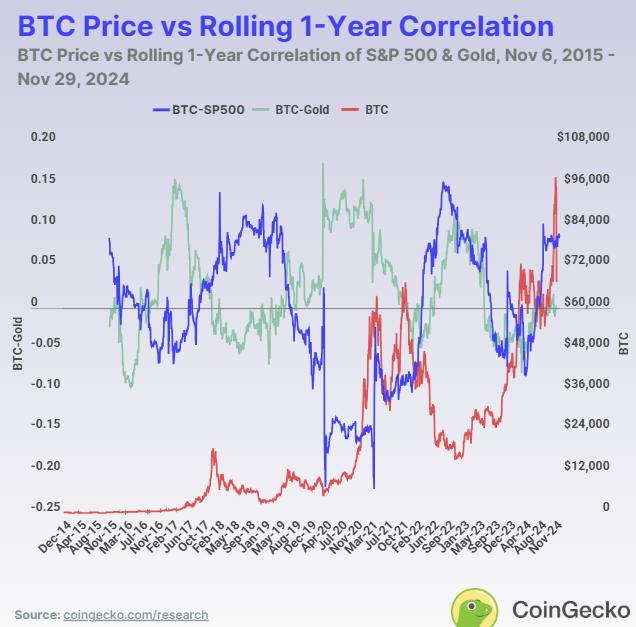
Bitcoin and the S&P 500 Index
For many years, the correlation between Bitcoin and the S&P 500 (shown by the blue line) has been inconsistent, typically approaching zero before 2018. This low correlation suggests that Bitcoin's behavior during this period was largely independent of the stock market. However, since 2020, this correlation has strengthened, with Bitcoin and stocks moving more in tandem during major economic events such as the COVID-19 pandemic. This price correlation also coincides with Bitcoin's rallies in 2018, 2020, and 2024.
Bitcoin and Gold
Regarding gold, Bitcoin's correlation with the S&P 500 is inversely related. This suggests that although both are considered alternative investments, Bitcoin and gold (shown by the green line) typically move independently of each other. Furthermore, the correlation moves inversely with Bitcoin price. When prices rise, the correlation falls, and vice versa. This indicates that when Bitcoin underperforms, investors tend to turn to gold. However, during macroeconomic events, the correlation often experiences brief spikes, reflecting the two assets' reactions to similar market conditions. Nevertheless, Bitcoin has not yet fully established itself as "digital gold."
The following is a comparison of the ten-year price returns of Bitcoin and traditional assets: