

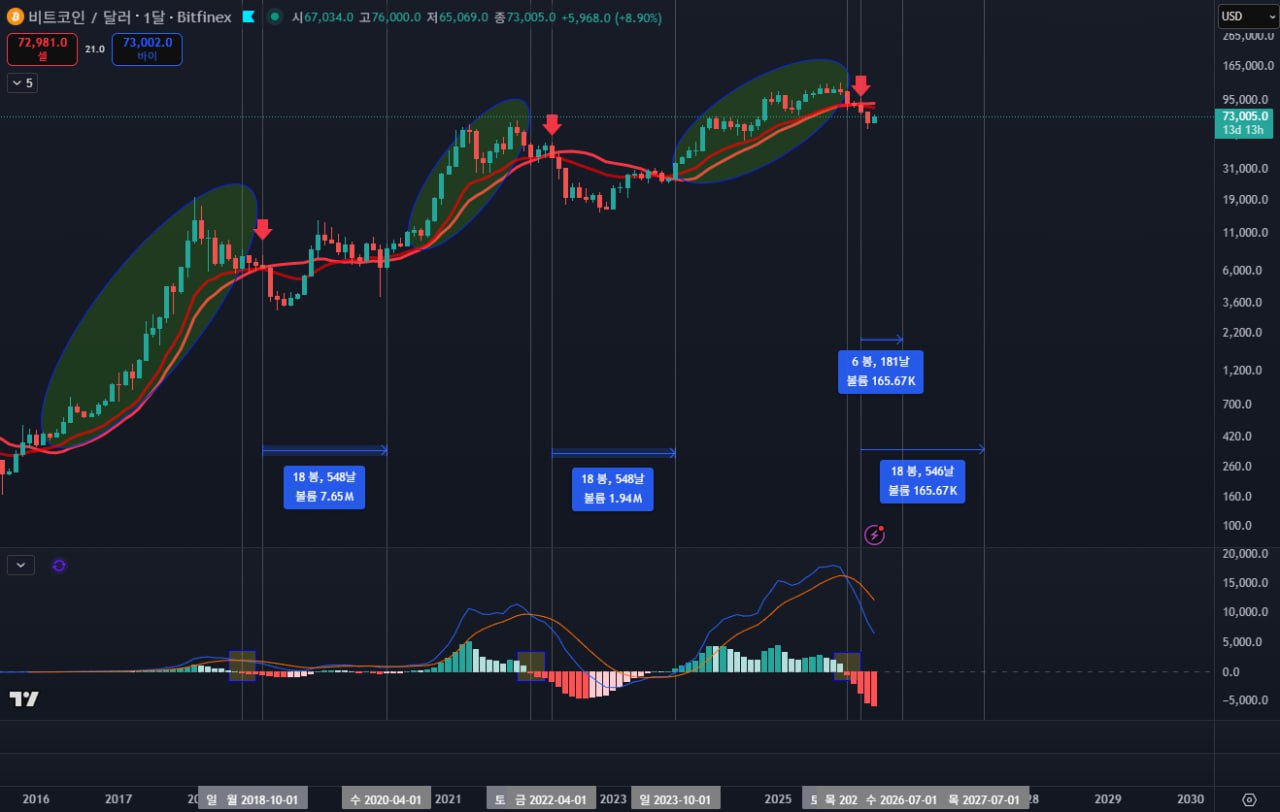
🏄♂️BTC(Beyond The Candle) - Technical Analyze (3/18) (1) Previous Outlook 1/ Dec 11 Analysis: The break of the RSI 44 level and the primary uptrend line signaled a total breakdown of the weekly trend. I forecasted a move down to the $58.7k – $60.2k zone. 2/ Jan 13 Analysis: I warned of a weekly 20/50 EMA death cross, indicating further downside potential. 1. BTC Monthly Chart : Downtrend Confirmation & Accumulation Phase BTC enters a monthly accumulation phase within a broader downtrend. While consolidation is required, shifting fundamentals suggest an accelerated recovery timeline, targeting July 2026 at the earliest 2. BTC Weekly Chart : Relief Rally within Downtrend & $80K–$83K Key Resistance Pivot The weekly downtrend persists despite the ongoing short-term rally. The $80k–$83k range is a critical pivot point, and the current short-term rebound is unlikely to break above this level. BTC(Beyond The Candle) content will be regularly uploaded whenever key indicators are released ✖️ See details @Layergg #BTC #CHART #FOMC
Sector:

Telegram
Disclaimer: The content above is only the author's opinion which does not represent any position of Followin, and is not intended as, and shall not be understood or construed as, investment advice from Followin.
Like
Add to Favorites
Comments
Share
Relevant content


