Authors: Aleksei Adadurov, Sergey Barseghyan, Anton Chtepine, Antero Eloranta, Andrei Sebyakin, Arsenii Valitov (email: team@nuconstruct.xyz)
We study optimal auction design for Maximum Extractable Value (MEV) auction markets on Ethereum. Using a dataset of 2.2 million transactions across three major orderflow providers, we establish three empirical regularities: extracted values follow a log-normal distribution with extreme right-tail concentration, competition intensity varies substantially across MEV types, and the standard Revenue Equivalence Theorem breaks down due to affiliation among searchers’ valuations. We model this affiliation through a Gaussian common factor, deriving equilibrium bidding strategies and expected revenues for five auction formats: first-price sealed-bid, second-price sealed-bid, English, Dutch, and all-pay, across a fine grid of bidder counts nn and affiliation parameters \rhoρ.
TLDR
- The top 1% of transactions generate 68% of all revenue: mechanism choice for high-value transactions dominates overall revenue performance.
- English and SPSB auctions strictly dominate Dutch and FPSB formats by 14–28% at moderate affiliation (\rho = 0.5ρ=0.5), and up to 30% for small bidder counts.
- Applied to observed bribe totals, the linkage gap corresponds to $10–18 million in foregone revenue over the sample period.
- A novel non-monotonicity: at large nn and high \rhoρ, revenue peaks in the interior of the affiliation parameter space and declines thereafter, as near-perfect correlation collapses the order-statistic spread that drives competitive payments.
- All-pay auctions consistently underperform all standard formats once affiliation is accounted for, with FPSB revenue exceeding all-pay by 40–120%. Avoid in MEV contexts.
- Results are robust across MEV types, with the linkage principle holding for all 110 (n, \rho)(n,ρ) grid cells.
1. Why does auction format matter in MEV markets?
Block builders auction tens of millions of dollars worth of Maximum Extractable Value opportunities to competing searchers each year in the Ethereum ecosystem. These auctions determine how the surplus from transaction ordering is divided between searchers, who identify and execute profitable strategies, and orderflow providers, who control access to transaction flow. Despite the economic magnitude of these markets, relatively little attention has been paid to the question of mechanism optimality: which auction format should a block builder use to maximize their own revenue?
This question is non-trivial for several reasons.
- Value concentration. Our empirical analysis shows that MEV valuations follow a log-normal distribution where the top 1% of transactions generate 68% of all revenue. The Gini coefficient of the value distribution is 0.933. When value is this concentrated in the right tail, mechanism choice for high-value transactions dominates overall revenue performance, and formats that differ only in their handling of typical transactions may diverge sharply on the rare events that matter most.
- Heterogeneous competition. Sandwich attacks, which exploit publicly observable mempool information, attract intense competition and exhibit average bribe percentages above 95%, indicating that searchers bid away nearly all of their surplus. By contrast, naked arbitrage and liquidations attract fewer searchers, with correspondingly lower bribe ratios of 67–68%. A single auction format optimized for one competitive regime will generally be suboptimal in another, suggesting that mechanism design for MEV markets should be segmented rather than uniform.
- Affiliation. Standard revenue equivalence arguments break down in this environment. The Revenue Equivalence Theorem establishes that all standard auction formats yield identical expected revenue when bidders hold independent private values, are symmetric and risk-neutral, and the object is allocated to the highest-value bidder. But MEV valuations are plausibly affiliated: if market conditions make a cross-DEX arbitrage opportunity valuable to one searcher, they tend to make it valuable to others, since all searchers observe the same on-chain state and off-chain price signals. Under affiliation, the linkage principle predicts a strict revenue ranking: formats with truthful bidding (English and second-price sealed-bid) outperform formats with strategic bid shading (first-price sealed-bid and Dutch).
2. Data
We use the libmev dataset of MEV bundle transactions on Ethereum, covering the period from September 2024 to August 2025. The raw data contains 2.2 million transactions with a total extracted value of approximately $168.5M across three major auctioneers: Blink, Merkle, and MEV Blocker. Each record includes the transaction hash, block number, MEV type, the tip paid to the block proposer (called a bribe), and the searcher’s retained profit. We define the extracted value of a transaction as the sum of the tip and the profit, representing the total surplus available to the searcher before any payment to the builder. The bribe percentage is the share of extracted value paid to the builder, i.e. higher bribe percentages indicate fiercer competition, as searchers bid away their surplus.
MEV types and market structure
The dataset classifies transactions into four MEV types: sandwich attacks, naked arbitrage (untargeted top-of-block DEX-DEX arbitrage), backruns, and liquidations.
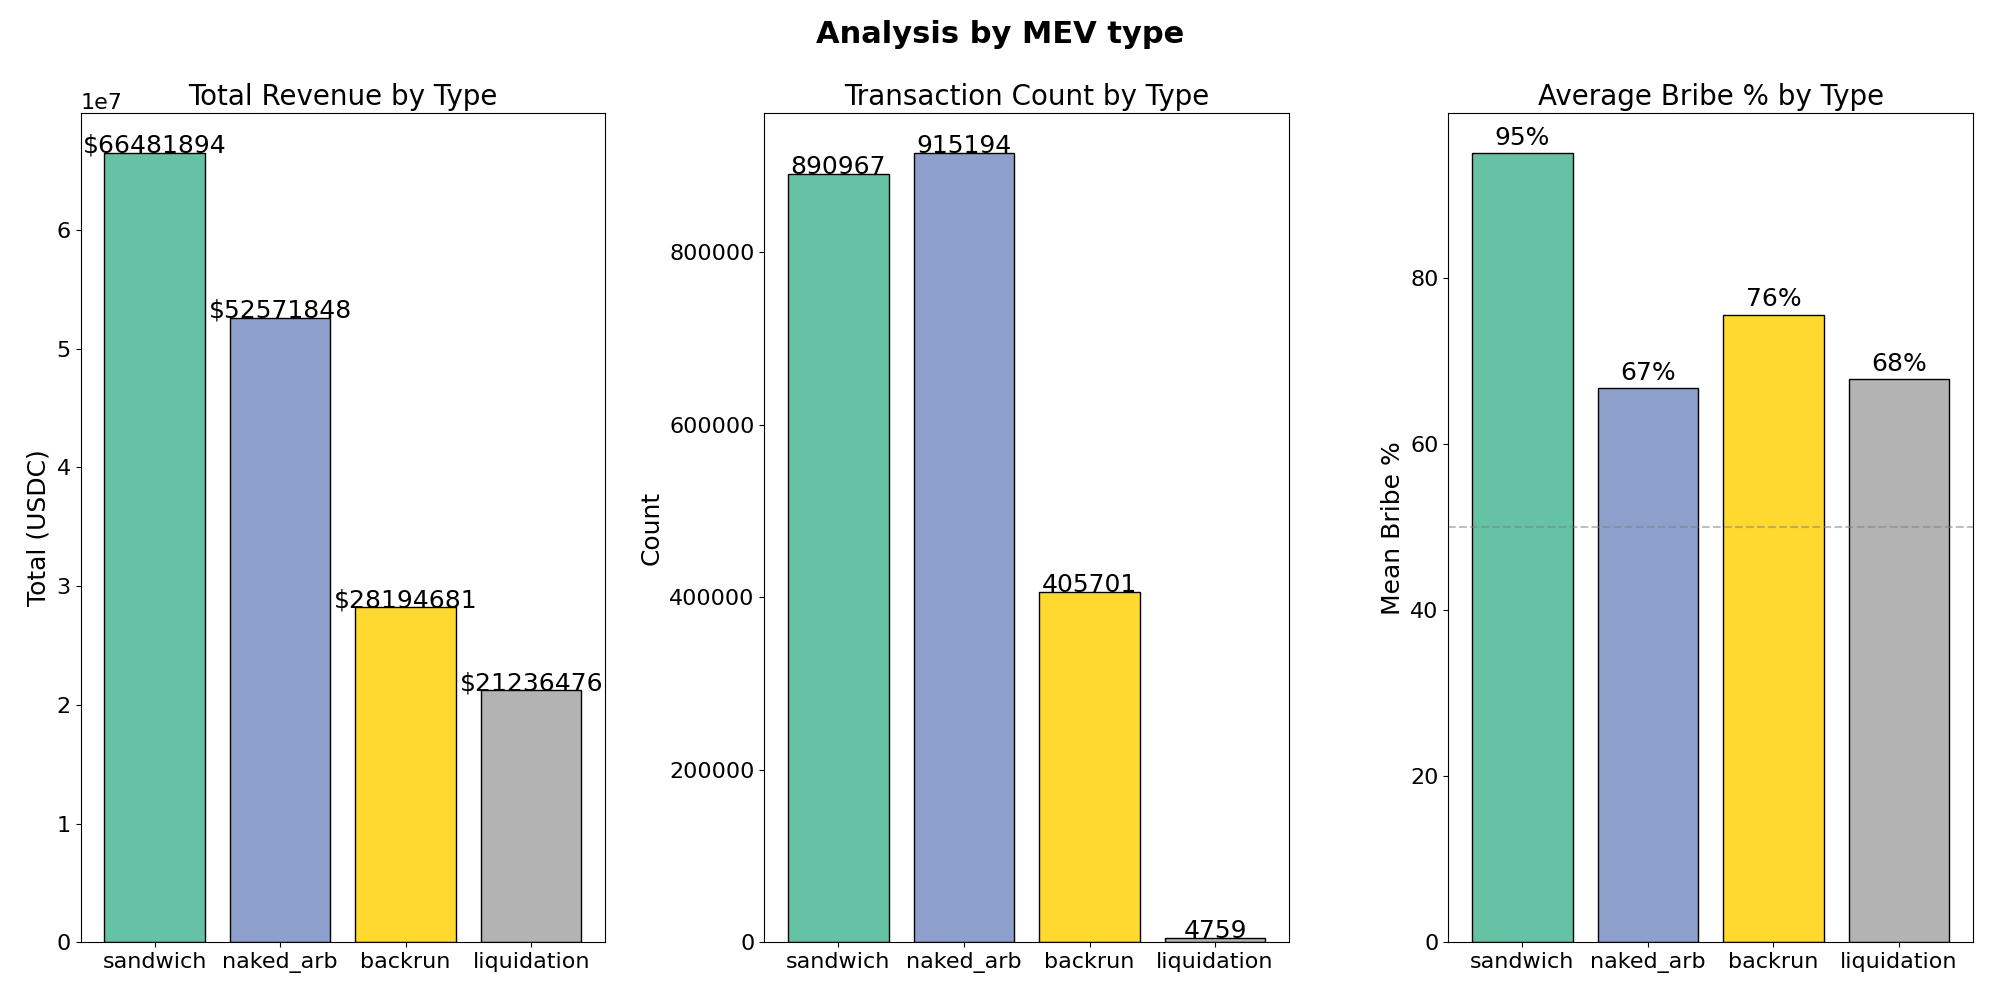
Figure 1: Analysis by MEV type. Left: total revenue. Middle: transaction count. Right: average bribe percentage.
Sandwich attacks and naked arbitrage dominate both in volume and in value. Sandwiches account for approximately $66.5M in total extracted value across 891K transactions, while naked arbitrage generates $52.6M across 915K transactions. Backruns contribute $28.2M over 406K transactions, and liquidations, though the highest-value individual events, are comparatively rare, totaling $21.2M across fewer than 5K transactions.
The right panel reveals substantial heterogeneity in competition intensity across MEV types. Sandwich attacks exhibit the highest average bribe percentage at 95%, consistent with the nature of the opportunity: visible in the public mempool, detectable by many searchers simultaneously, with execution largely commoditized. Naked arbitrage and liquidation searchers retain more surplus (67% and 68% respectively), suggesting more specialized infrastructure or faster execution that limits the effective number of competitors. Backruns fall in between at 76%.
These cross-type differences have direct implications for the auction-theoretic analysis. The effective number of bidders nn varies across MEV types: sandwich attacks likely correspond to large nn, while liquidations and naked arbitrage correspond to small nn. As we show below, the linkage gap and affiliation premium are both largest for small nn, making the choice of auction format most consequential precisely for those MEV categories where searchers retain the most surplus.
Value distribution
We fit a log-normal distribution to the pooled extracted values by maximum likelihood estimation, obtaining parameter estimates \hat{\mu} = 1.102^μ=1.102 and \hat{\sigma} = 2.524^σ=2.524. The large value of \hat{\sigma}^σ reflects the extreme dispersion of MEV opportunities: the standard deviation of log-values is 2.5, implying that a one-standard-deviation upward shift in the latent signal multiplies the extracted value by a factor of e^{2.524} \approx 12.5e2.524≈12.5.
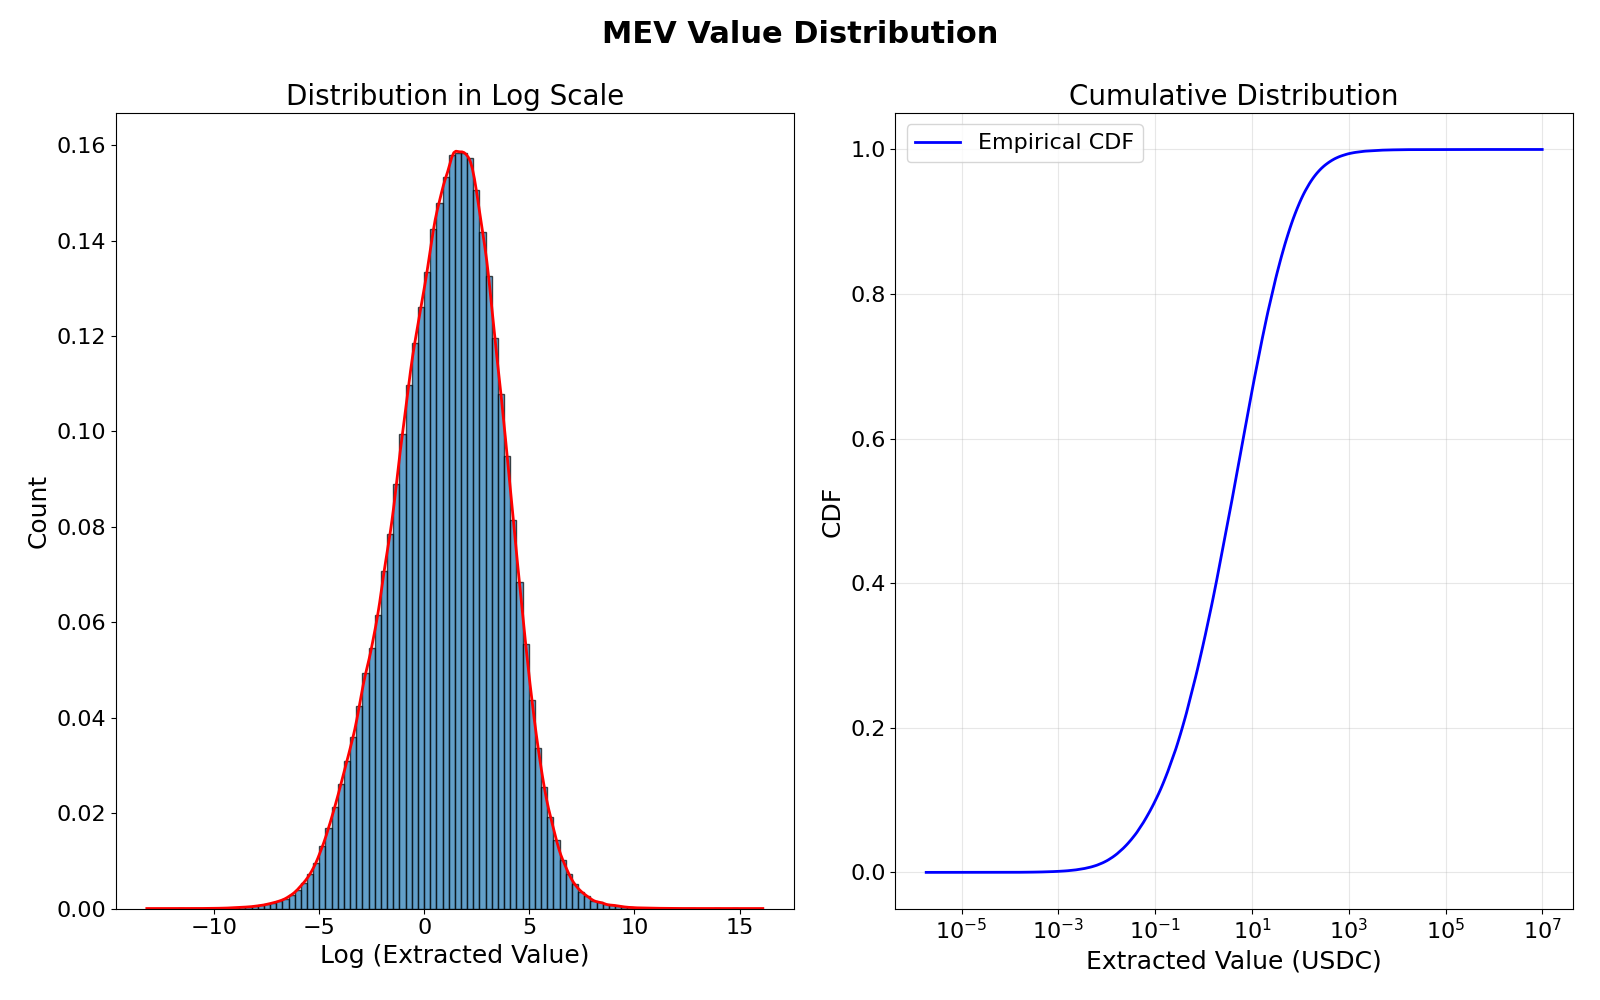
Figure 2: MEV value distribution. Left: histogram of log-transformed extracted values with fitted normal density (red curve), supporting the log-normal specification. Right: empirical CDF on logarithmic scale.
Revenue concentration
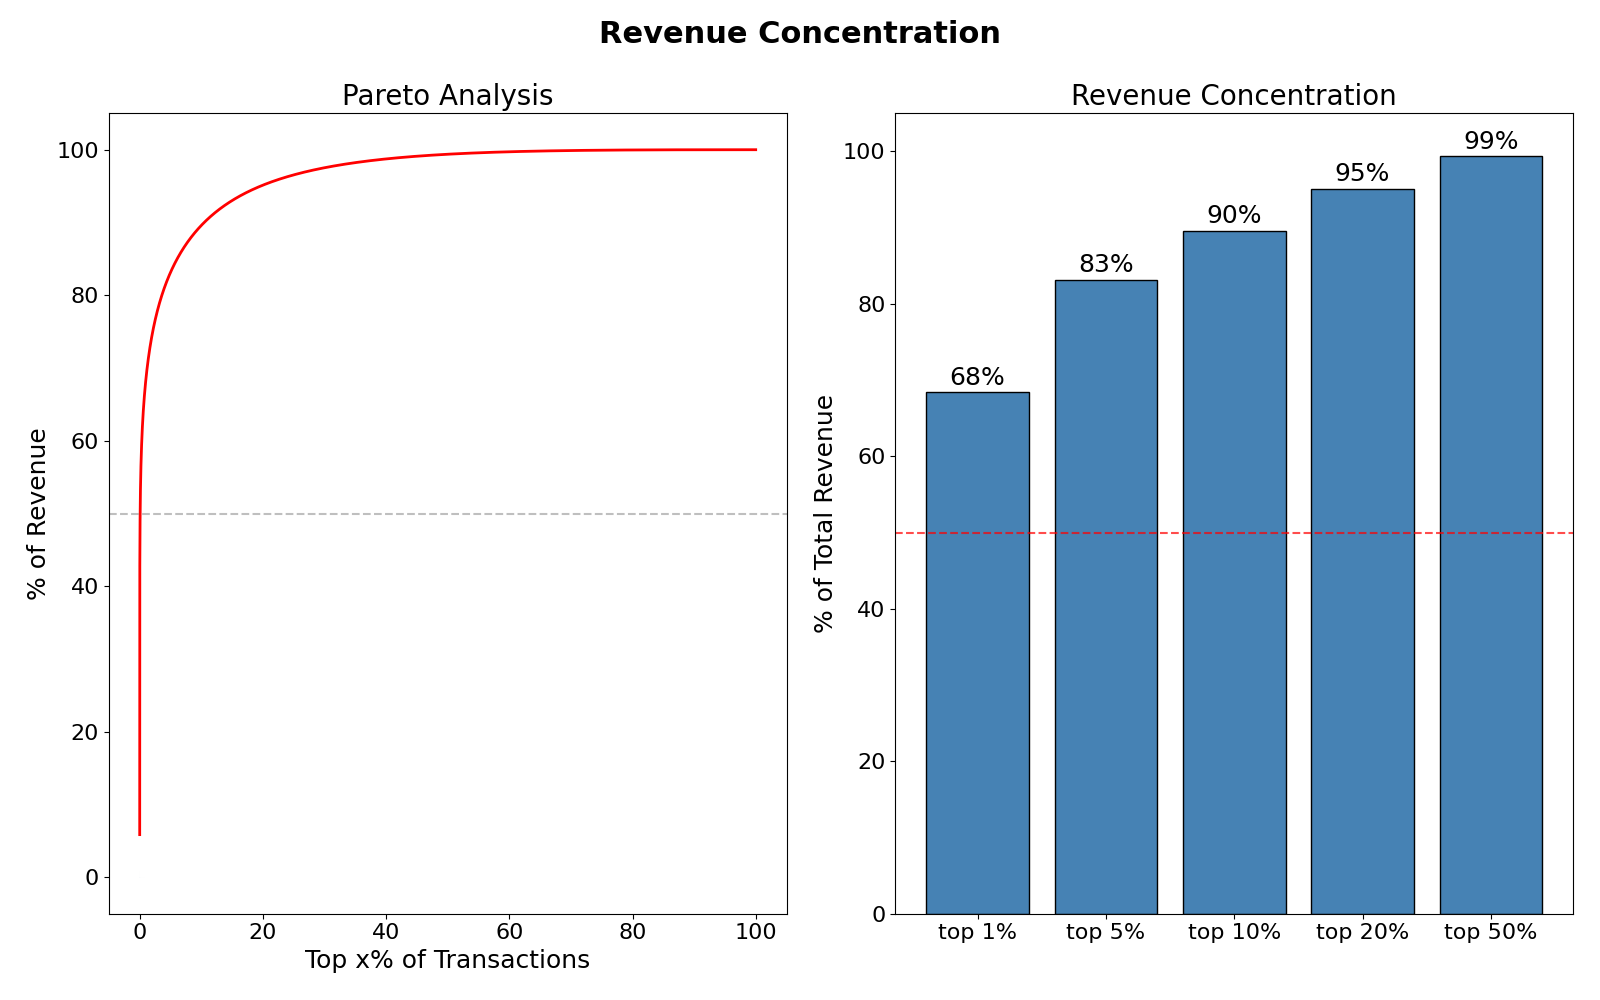
Figure 3: Revenue concentration. Left: Pareto curve showing cumulative revenue share as a function of the top x% of transactions. Right: revenue share of the top 1%, 5%, 10%, 20%, and 50% of transactions. The dashed red line marks the 50% threshold.
The top 1% of transactions by value account for 68% of total revenue, and the top 10% account for 90%. This concentration has a practical implication for auction design: the revenue impact of mechanism choice is dominated by a small number of high-value transactions.
Summary statistics
Summary statistics of extracted values in USDC are as follows:
| MEV Type | Count | Total Value | Mean | Median | Std Dev | Bribe % |
|---|---|---|---|---|---|---|
| Sandwich | 890,967 | $66.5M | $74.6 | $3.01 | $1,842 | 95% |
| Naked Arb | 915,194 | $52.6M | $57.4 | $3.15 | $1,529 | 67% |
| Backrun | 405,701 | $28.2M | $69.5 | $2.28 | $2,104 | 76% |
| Liquidation | 4,759 | $21.2M | $4,462 | $157.3 | $38,716 | 68% |
| All | 2,216,621 | $168.5M | $76.0 | $3.01 | $1,925 | 79% |
Several features stand out. The mean-to-median ratio is enormous: the mean ($76.0) exceeds the median ($3.01) by a factor of 25, which is a hallmark of heavy-tailed distributions. Liquidations are qualitatively different from the other types: rare but individually much larger (median $157 vs. 3 for the pooled sample). This confirms that liquidations occupy a distinct region of the 3forthepooledsample).Thisconfirmsthatliquidationsoccupyadistinctregionofthe(n, \rho)$ parameter space: low nn, potentially high \rhoρ, where the format choice matters most. The bribe percentage column reinforces the competition narrative: sandwiches are a near-perfectly competitive market (95%), while naked arbs and liquidations leave substantial surplus with the winning searcher (67–68%). From the builders’ perspective, the MEV categories with the lowest bribe percentages represent the largest potential revenue gains from improved auction design, since there is more surplus left on the table to be captured through a better mechanism.
3. Model
We consider a single builder who wants to sell an MEV extraction opportunity to nn competing searchers. Each searcher ii has a private valuation v_ivi drawn from a common log-normal distribution. We compare five auction formats: first-price sealed-bid (highest bid wins, winner pays own bid, and equilibrium involves bid shading), second-price sealed-bid (highest bid wins, winner pays second-highest bid, and truthful bidding is weakly dominant), English (price rises until one bidder remains, and truthful dropout is dominant under private values), Dutch (price falls until a bidder accepts, strategically equivalent to FPSB under any correlation structure), and all-pay (all bidders pay regardless of outcome).
Under independent private values (IPV), the Revenue Equivalence Theorem holds: all standard formats yield expected revenue E[v_{(2)}]E[v(2)]. We relax the independence assumption by introducing affiliated valuations through a Gaussian common factor model. Each searcher ii receives a latent signal:
The valuation is v_i = \exp(\mu + \sigma z_i)vi=exp(μ+σzi). Since z_i \sim \mathcal{N}(0,1)zi∼N(0,1) marginally, the marginal distribution v_i \sim \text{Lognormal}(\mu, \sigma^2)vi∼Lognormal(μ,σ2) is preserved for all \rhoρ, ensuring that comparisons across affiliation levels isolate the effect of correlation. The parameter \rho \in [0,1)ρ∈[0,1) controls the degree of affiliation: \rho = 0ρ=0 recovers the IPV case, while \rho \to 1ρ→1 implies near-common values.
In MEV markets, the common factor ZZ captures shared information: the size of a victim transaction (sandwiches), the cross-DEX price discrepancy (arbitrage), or the collateral shortfall (liquidations), while \varepsilon_iεi reflects differences in execution efficiency and infrastructure.
Under affiliation, truthful bidding remains weakly dominant in English and SPSB auctions in the private values setting, i.e. both yield the affiliated E[v_{(2)}]E[v(2)]. In FPSB/Dutch, no information is transmitted before the bidding decision, and the equilibrium bid function changes: a searcher who observes a high private value infers through the common factor that rivals also likely have high values, which makes competition tougher than under IPV. In response, the searcher shades less: \beta_{\text{aff}}(v) > \beta_{\text{IPV}}(v)βaff(v)>βIPV(v). The linkage principle then implies a strict revenue ranking: English and SPSB auctions dominate Dutch and FPSB auctions, which in turn dominate the all-pay format. The three levels coincide if and only if \rho = 0ρ=0, recovering revenue equivalence under independence.
4. Numerical results
We simulate expected revenues for all five auction formats across a grid spanning n \in \{2, 3, ..., 8, 10, 12, 15, 20\}n∈{2,3,...,8,10,12,15,20} and \rho \in \{0.0, 0.1, ..., 0.9\}ρ∈{0.0,0.1,...,0.9} with 10^6106 auction draws per cell. The choice of grid covers the full range of empirically relevant scenarios: $n = 2$–$5$ corresponds to specialized MEV types such as liquidations or naked arbitrage, where a handful of sophisticated searchers dominate, while $n = 10$–$20$ captures more competitive categories like sandwich attacks.
Revenue equivalence verification
Under IPV (\rho = 0ρ=0), the Revenue Equivalence Theorem requires all standard formats to yield the same expected revenue. The following table confirms agreement within 0.2% across all tested values of nn. The residual differences are consistent with Monte Carlo sampling noise at N = 10^6N=106 draws.
| nn | English/SPSB | Dutch/FPSB | All-pay | Rel. diff |
|---|---|---|---|---|
| 2 | $5.41 | $5.41 | $5.42 | 0.1% |
| 5 | $30.02 | $30.06 | $29.85 | 0.1% |
| 10 | $79.72 | $79.89 | $79.57 | 0.2% |
The absolute revenue levels grow rapidly with nn: from $5.41 at n = 2n=2 to $79.72 at n = 10n=10. Again, this reflects the heavy tail of the empirical MEV distribution: with 10 independent log-normal draws, the second-order statistic already reaches the far right tail of the distribution, generating large expected payments.
Linkage principle verification
At \rho = 0.5ρ=0.5, our simulation confirms the strict ranking predicted by the linkage principle. The fifth column of the following table stands for the Linkage gap = (Eng − FPSB) / FPSB, while the last column stands for (FPSB − AP) / AP.
| nn | English/SPSB | Dutch/FPSB | All-pay (IPV) | Linkage gap | FPSB vs AP |
|---|---|---|---|---|---|
| 2 | $15.24 | $11.93 | $5.37 | 27.7% | +122.2% |
| 5 | $59.87 | $51.10 | $30.04 | 17.2% | +70.1% |
| 10 | $128.21 | $112.48 | $79.93 | 14.0% | +40.7% |
The gap between English and FPSB decreases with nn (from 27.7% at n = 2n=2 to 14.0% at n = 10n=10), consistent with the theoretical intuition that the linkage advantage dilutes with competition. When many bidders compete, each individual’s information is less pivotal, and the sealed-bid format’s revenue loss from not aggregating information diminishes.
Mechanism comparison at n = 5n=5
Further, we suggest to compare expected revenues per auction for n = 5n=5 bidders across affiliation levels:
| Format | \rho=0ρ=0 | \rho=0.2ρ=0.2 | \rho=0.4ρ=0.4 | \rho=0.5ρ=0.5 | \rho=0.8ρ=0.8 |
|---|---|---|---|---|---|
| English/SPSB | $30.02 | $40.05 | $53.49 | $59.87 | $83.15 |
| FPSB/Dutch | $30.06 | $37.02 | $46.10 | $51.10 | $70.75 |
| All-pay (IPV) | $29.85 | $30.33 | $30.05 | $30.04 | $29.96 |
At \rho = 0ρ=0, revenue equivalence holds: all formats yield approximately $30. As affiliation increases, the three revenue levels fan out. At \rho = 0.5ρ=0.5, English/SPSB generates $59.87, which is 99% above the IPV benchmark, while FPSB/Dutch generates $51.10, 70% above baseline. The English/SPSB advantage over Dutch/FPSB is 17% at \rho = 0.5ρ=0.5 and grows to 18% at \rho = 0.8ρ=0.8. The all-pay baseline remains flat at approximately $30.
The economic magnitude is striking: moving from \rho = 0ρ=0 to \rho = 0.5ρ=0.5 nearly doubles revenue for both format groups. This effect arises because the common factor ZZ in the Gaussian copula model compresses the gap between v_{(1)}v(1) and v_{(2)}v(2): when searchers’ values are positively correlated, the second-highest bidder’s value is drawn closer to the winner’s value, increasing the payment. At \rho = 0.8ρ=0.8, English/SPSB reaches $83.15, which is nearly three times the IPV baseline, indicating that the affiliation premium dominates the competitive effect for this bidder count.
Revenue and affiliation
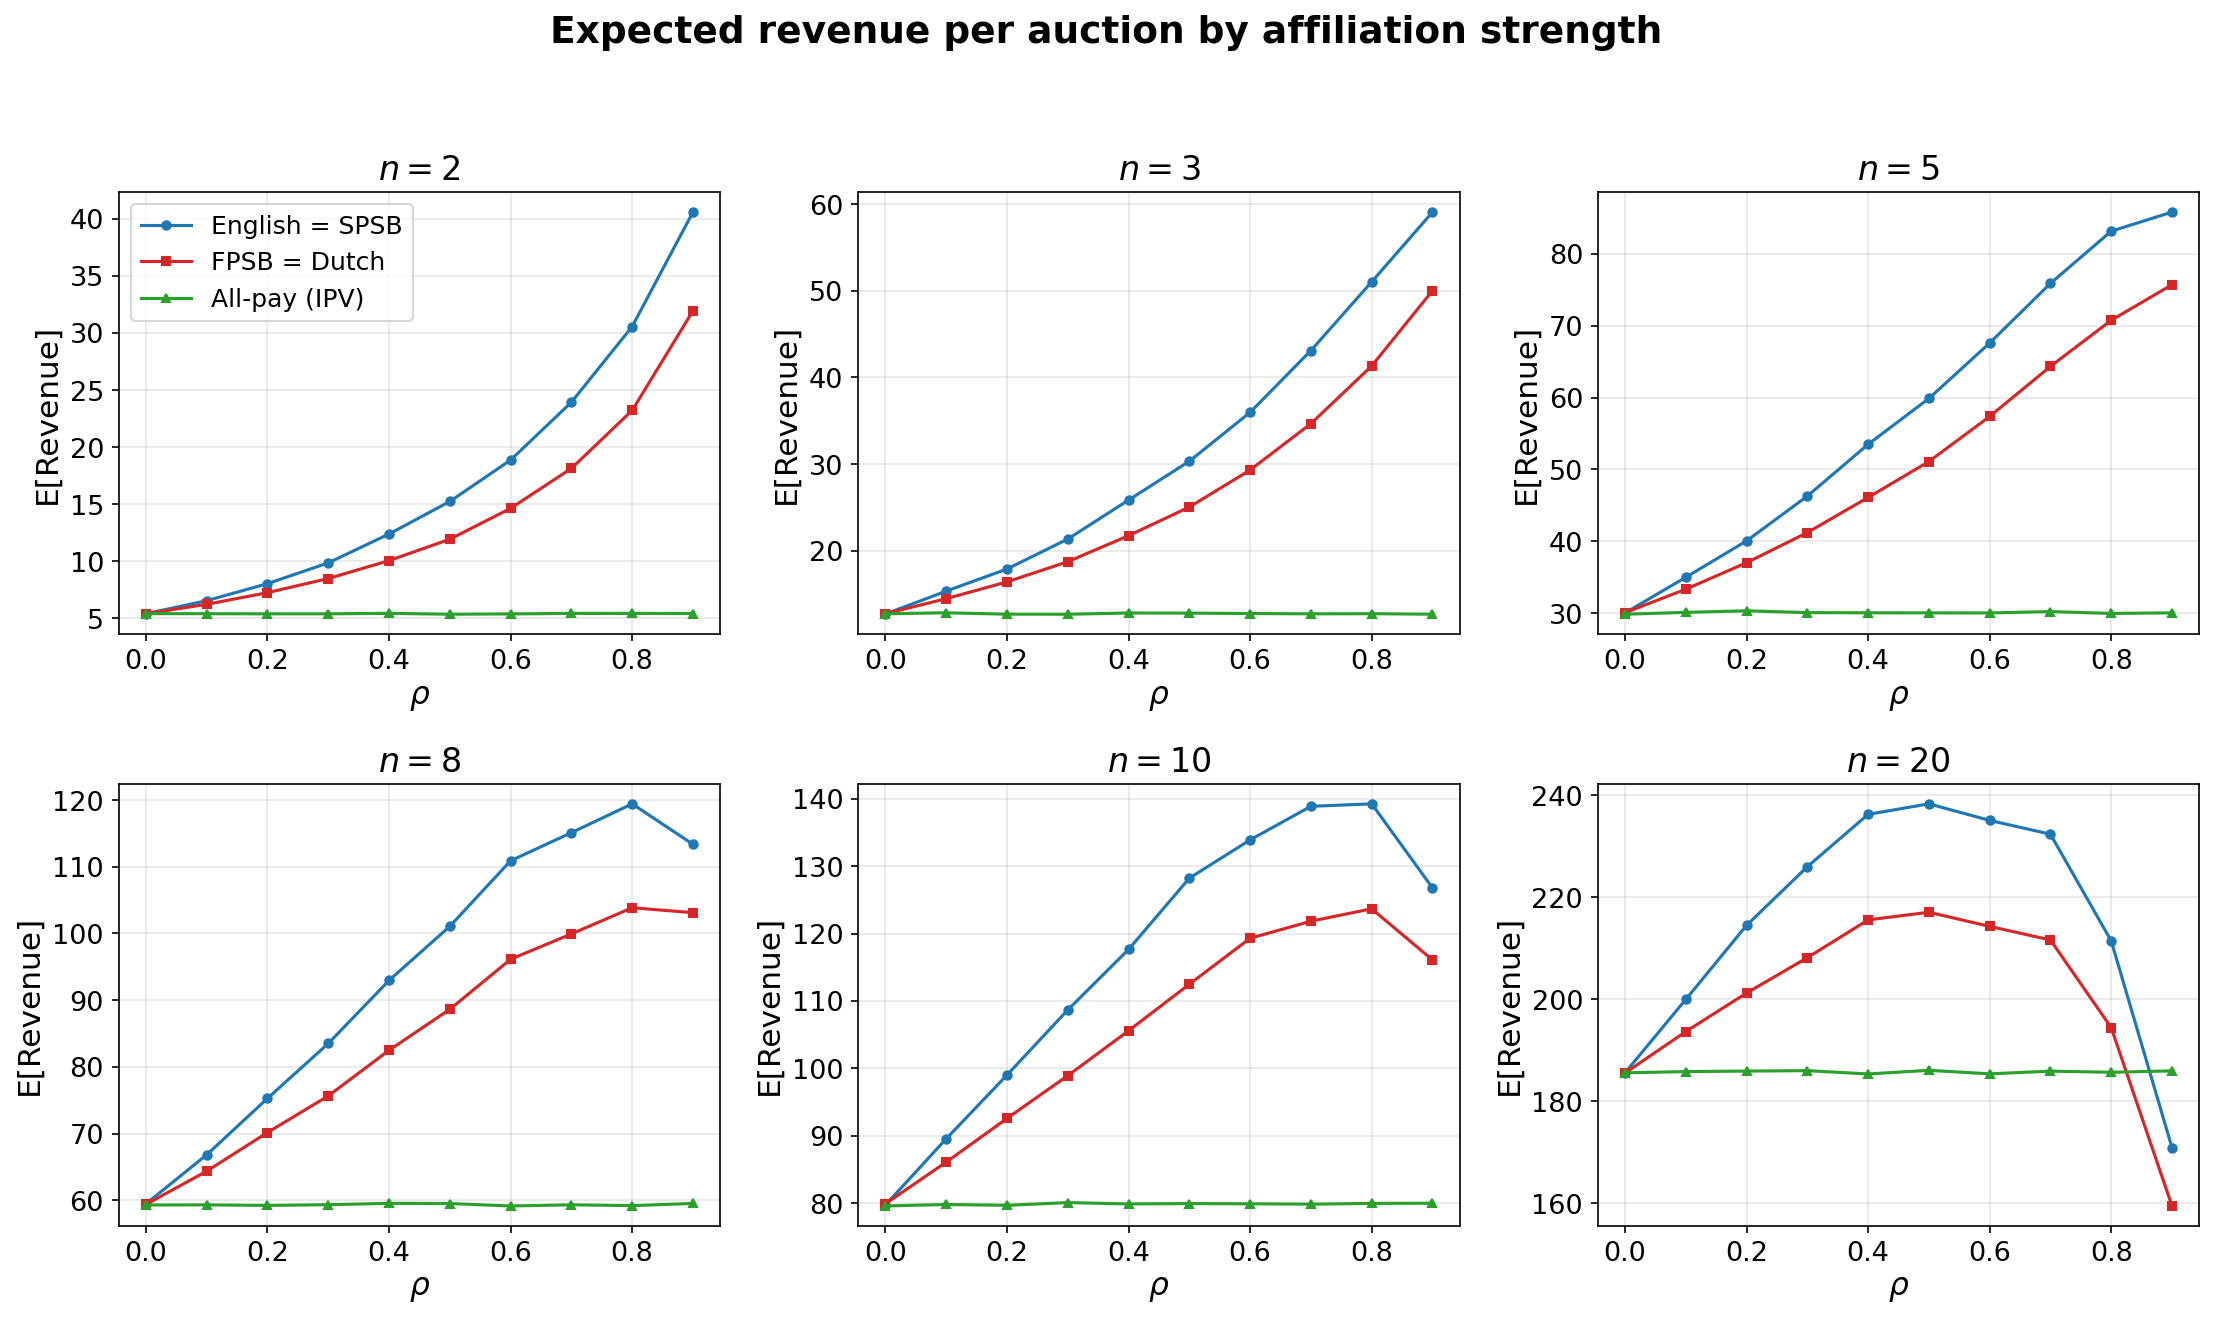
Figure 4: Expected revenue vs ρ for different values of competition level n. Blue: English and SPSB auctions. Red: Dutch and FPSB auctions. Green: All-pay auction (IPV benchmark, does not change with \rhoρ).
Two major patterns emerge. For n \leq 8n≤8, revenue increases monotonically in \rhoρ for both English/SPSB and Dutch/FPSB, with a widening gap between them. For n = 2n=2, English/SPSB revenue grows from $5.41 at \rho = 0ρ=0 to $40.59 at \rho = 0.9ρ=0.9; a 650% increase driven entirely by the compression of the v_{(1)} - v_{(2)}v(1)−v(2) gap.
For n \geq 10n≥10, revenue peaks around \rho = 0.6–0.7ρ=0.6–0.7 and then declines. At n = 20n=20, English/SPSB peaks at $238 at \rho = 0.5ρ=0.5 and falls to $171 at \rho = 0.9ρ=0.9, even below the IPV benchmark of $186. This reversal occurs because near-perfect correlation collapses the spread between order statistics: when all bidders observe approximately the same value, the competitive pressure that drives v_{(2)}v(2) close to v_{(1)}v(1) disappears. More precisely, v_{(2)}v(2) under affiliation can be decomposed as \exp(\mu + \sigma(\sqrt{\rho}\,Z + \sqrt{1-\rho}\,\varepsilon_{(2)}))exp(μ+σ(√ρZ+√1−ρε(2))), where \varepsilon_{(2)}ε(2) is the second-largest idiosyncratic shock. As \rho \to 1ρ→1, the idiosyncratic variance \sigma^2(1-\rho) \to 0σ2(1−ρ)→0 and the order-statistic spread that generates high v_{(2)}v(2) when nn is large under IPV collapses. The net effect on E[v_{(2)}]E[v(2)] is non-monotone: initially, correlation helps by compressing v_{(1)} - v_{(2)}v(1)−v(2), but eventually it hurts by eliminating the right-tail amplification from multiple independent draws.
Revenue and competition
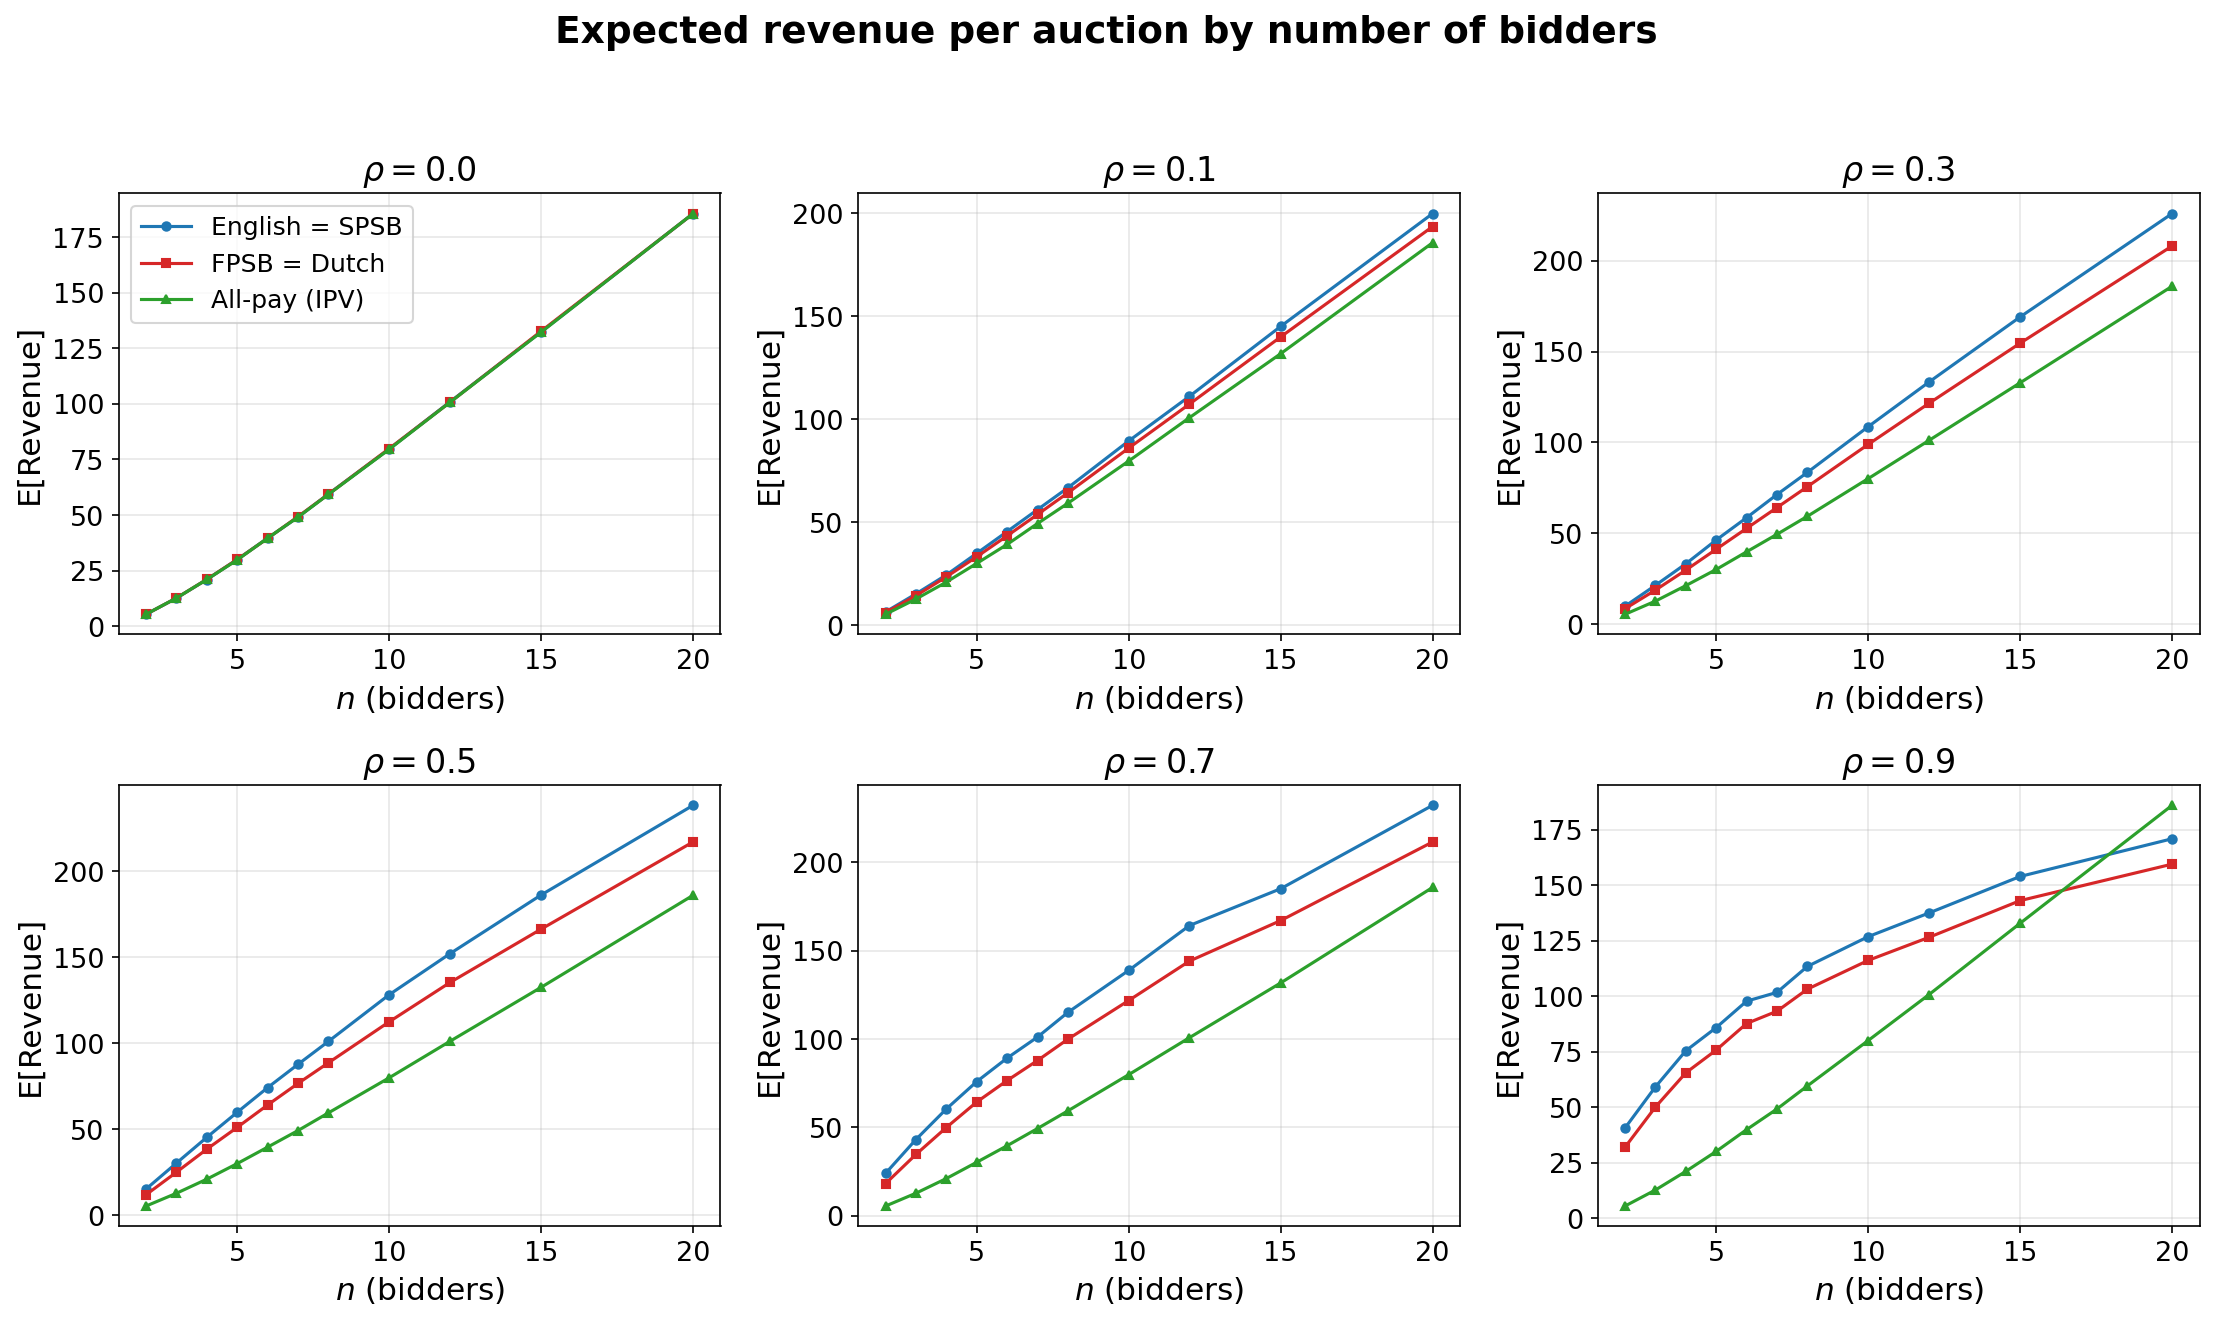
Figure 5: Expected revenue vs n for different values of affiliation ρ. Blue: English and SPSB auctions. Red: Dutch and FPSB auctions. Green: All-pay auction (IPV benchmark, does not change with \rhoρ).
At \rho = 0ρ=0 (top-left panel), all three lines coincide, providing a visual confirmation of revenue equivalence. As \rhoρ increases, the three lines separate progressively. At \rho = 0.9ρ=0.9 (bottom-right panel), a dramatic crossover occurs: the IPV benchmark overtakes the affiliated formats for n \geq 15n≥15, confirming that the revenue reversal at extreme affiliation is not an artifact of a particular nn but a systematic phenomenon. This has practical implications for MEV markets: in highly competitive categories like sandwich attacks, where many searchers observe similar opportunities, the correlation structure may actually suppress revenue relative to what a naive IPV model would predict.
Linkage gap
The linkage gap, which is the percentage by which English/SPSB expected revenue exceeds Dutch/FPSB expected revenue, is directly actionable for mechanism designers: it measures the revenue a builder leaves on the table by choosing a sealed-bid format over an ascending one, holding all other design parameters fixed.
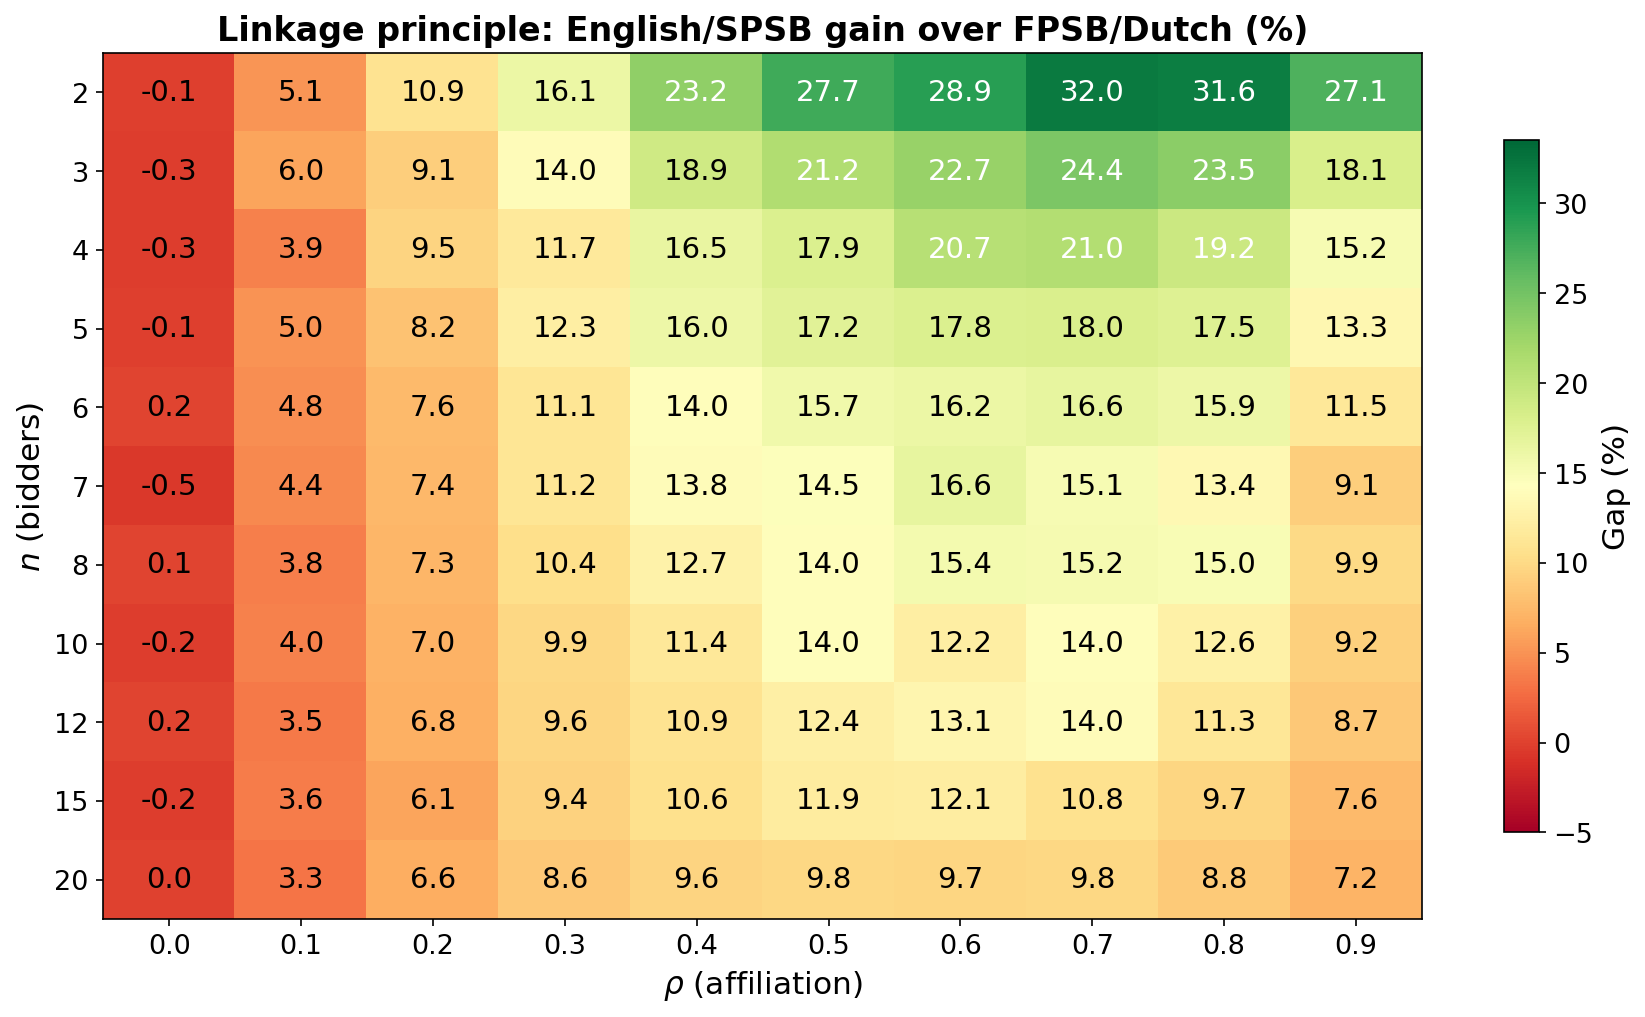
Figure 6: Linkage gap in % across (n, \rho)(n,ρ) pairs. The color scale ranges from dark-red (near-zero gap at \rho = 0ρ=0) through orange and yellow (3–15% for moderate parameters) to dark-green at the peak (32% at (n, \rho)(n,ρ) = (2, 0.7)). The gap is non-negative for virtually all cells, with the only exceptions being entries at \rho = 0ρ=0 that fluctuate within \pm0.5\%±0.5% of zero due to Monte Carlo noise.
What follows, four regularities emerge from the heatmap:
(1) Non-negativity. The gap is non-negative across all 110 cells in the grid. At \rho = 0ρ=0, the entries fluctuate within \pm 0.5\%±0.5% of zero, consistent with Monte Carlo noise and the Revenue Equivalence prediction. For any \rho > 0ρ>0, the gap is strictly positive. No cell violates the theoretical bound by more than the Monte Carlo noise floor, providing a clean confirmation of the linkage principle across the entire parameter space.
(2) Hump-shape in \rhoρ. For fixed nn, the gap first increases with \rhoρ, peaks around \rho = 0.7–0.8ρ=0.7–0.8 for small nn and \rho = 0.5–0.6ρ=0.5–0.6 for large nn, and then declines at \rho = 0.9ρ=0.9. The decline at extreme affiliation reflects the convergence of all valuations to a common value: when \rho \approx 1ρ≈1, both v_{(2)}^{\text{aff}}vaff(2) and \beta_{\text{aff}}(v_{(1)}^{\text{aff}})βaff(vaff(1)) are driven by the same common factor ZZ, and the informational advantage of the open format vanishes.
(3) Monotone decrease in nn. For fixed \rho > 0ρ>0, the gap decreases with nn: at \rho = 0.5ρ=0.5, it declines from 27.7% (n = 2n=2) to 17.2% (n = 5n=5), 14.0% (n = 10n=10), and 9.8% (n = 20n=20). With more bidders, competition already drives v_{(2)}v(2) close to v_{(1)}v(1), so the additional revenue from an open format is proportionally smaller.
(4) Stable range for realistic parameters. For the parameter range most relevant to MEV markets (n \in [5, 10]n∈[5,10], \rho \in [0.3, 0.7]ρ∈[0.3,0.7]), the gap stabilizes at 10–18%. This stability is practically important: it means that the builder does not need to precisely estimate nn or \rhoρ to conclude that the format choice matters.
Dollar interpretation. To translate the percentage gaps into dollar figures, we apply them to the observed bribe totals. With n = 5n=5 and \rho = 0.5ρ=0.5, the 17.2% gap applied to observed bribes of $101.3M implies approximately $17.4M in foregone revenue from using sealed-bid rather than ascending auctions. Even at the conservative end (n = 10n=10, \rho = 0.3ρ=0.3), the 9.9% gap corresponds to $10.0M. These estimates should be interpreted as upper bounds: they assume symmetric bidders and costless implementation. Nonetheless, a gap of $10–18M over the sample period represents a substantial incentive for builders to consider format redesign.
5. Practical recipe for auction hosts
The theoretical and empirical results suggest a concrete approach for builders seeking to maximize revenue from their auctions.
- Use English or SPSB if \rho > 0.2ρ>0.2 and trust in the auctioneer is high. This is the main recommendation. For any positive affiliation, the linkage principle guarantees that English and SPSB formats strictly dominate FPSB and Dutch. The gain is 14–28% at \rho = 0.5ρ=0.5. SPSB is preferable over English when latency is a binding constraint: it requires only a single sealed bid rather than a live ascending clock. However, SPSB is vulnerable to shill bidding, so it should only be deployed when the mechanism is implemented transparently, for instance via a verifiable on-chain contract. English auctions mitigate this risk through public price revelation but introduce collusion vulnerabilities.
- Use FPSB or Dutch if \rho \approx 0ρ≈0, collusion risk is high, or latency is critical. Under near-independence, revenue equivalence holds, and the format choice does not materially affect expected payments. FPSB eliminates real-time strategic interaction, reducing the risk of tacit collusion among repeat players, a realistic concern in MEV markets where the same small set of sophisticated searchers compete repeatedly. Dutch auctions are strategically equivalent to FPSB and offer speed advantages.
- Avoid all-pay formats in MEV contexts. Despite the theoretical revenue equivalence under symmetric IPV, our simulations show that FPSB revenue exceeds all-pay by 40–120% once affiliation is accounted for. The mechanism requires every participant to pay their bid regardless of outcome, which causes searchers to shade bids dramatically downward, and the aggregate shortfall more than offsets the contribution from losing bidders.
- Apply different mechanisms to different MEV types. The competition parameters (n, \rho)(n,ρ) differ markedly across MEV categories. Sandwich attacks exhibit n \approx 10–20n≈10–20 and \rhoρ close to 1, placing them near the non-monotone region of the revenue surface where high affiliation actually suppresses revenue; FPSB/Dutch may be preferred, and collusion risk from repeat play is highest. Liquidations and naked arbitrage exhibit n \approx 2–5n≈2–5 and moderate \rhoρ, the parameter region where the linkage principle predicts the largest gains from open formats. A segmented approach, routing different MEV types to different mechanisms, can outperform any single uniform format.
6. Limitations
The paper assumes symmetric bidders, which may overstate effective competition. The effective bidder count nn and affiliation parameter \rhoρ are treated as exogenous; in equilibrium, format changes might attract more participants and shift these parameters. The model pools across MEV types for tractability; a natural extension would be to estimate type-specific parameters and run the revenue simulations separately for each MEV category. The log-normal specification is a deliberate simplification: the empirical distribution exhibits slight excess kurtosis in the left tail, and the four MEV types likely have distinct distributional parameters. The dollar estimates assume that the builder can costlessly implement the ascending format, ignoring the latency and communication overhead that may favor the simplicity of sealed-bid mechanisms.