

Table of Contents
ToggleThe Anthropic Economic Index uses our privacy-preserving data analytics system to track Claude's usage across the overall economy. This is part of our effort to understand the economic impact of AI early on, giving researchers and policymakers ample time to prepare.
This latest report examines Claude usage in February 2026, extending the basic economic framework established in our previous report (using data from November 2025). Our sample covers February 5 to February 12, three months after the release of Claude Opus 4.5 and overlapping with the release of Claude Opus 4.6.
We first documented the changes in usage compared to the previous report: the proportion of augmented interactions (i.e., collaborative interactions that leverage AI-assisted user capabilities) has slightly increased in both Claude.ai and API traffic. On Claude.ai, use cases are becoming more diverse, with the top 10 tasks accounting for a lower percentage of overall usage than in November 2025. Due to this diversification, the average salary per task for a conversation on Claude.ai is slightly lower than in the previous report.
Next, we focus on a key factor influencing Claude's impact on the labor market and the wider economy: the learning curve in Claude adoption. We provide evidence that highly experienced users have developed usage habits and strategies that allow them to utilize Claude's capabilities more effectively. Indeed, our data shows that more experienced users not only attempt higher-value tasks but are also more likely to achieve successful responses in conversations.
Changes since the previous report
In Chapter 1, we re-examine the findings of the previous economic index report, released in January 2026. We draw the following conclusions:
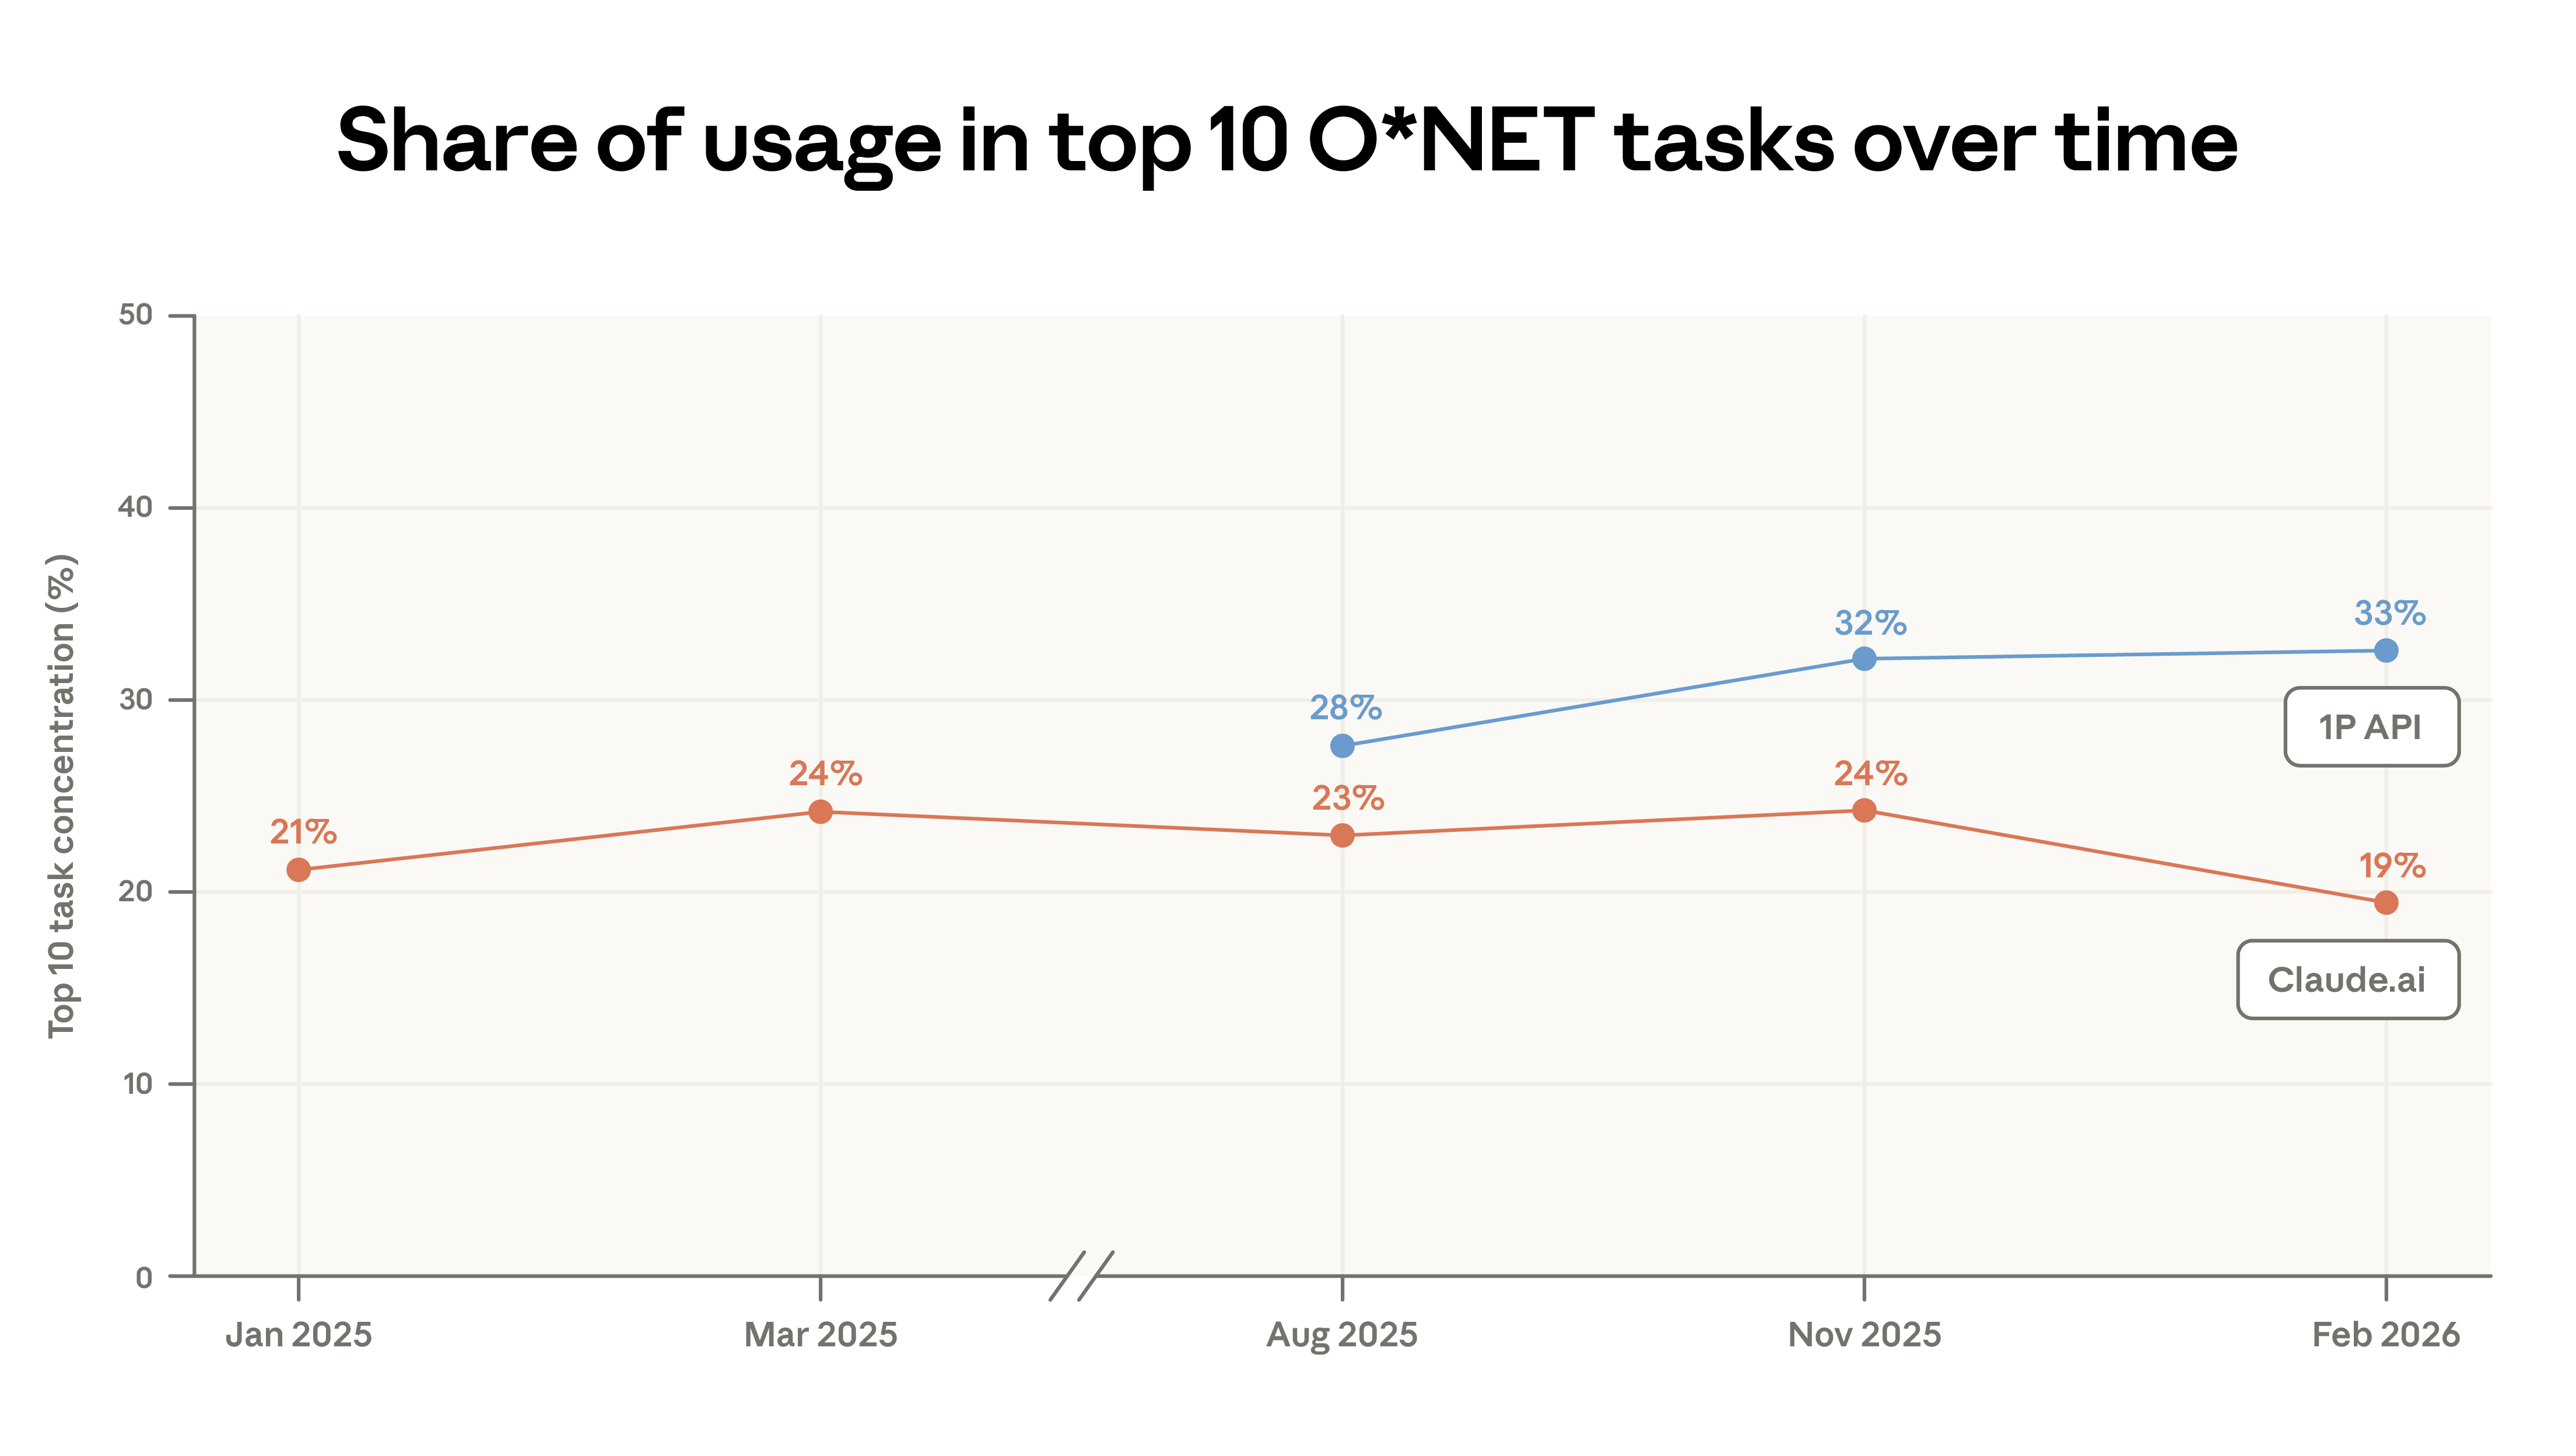
- Claude.ai's use cases are becoming increasingly diverse. Code writing tasks continue to migrate from the expanded use of Claude.ai to more automated workflows within our first-party API traffic. In this report, the concentration of Claude.ai usage has decreased: the top 10 tasks accounted for 19% of total traffic in February, down from 24% in November. Nevertheless, almost all the tasks in this sample appeared in our previous sample. Approximately 49% of professions now complete at least a quarter of their tasks using Claude.
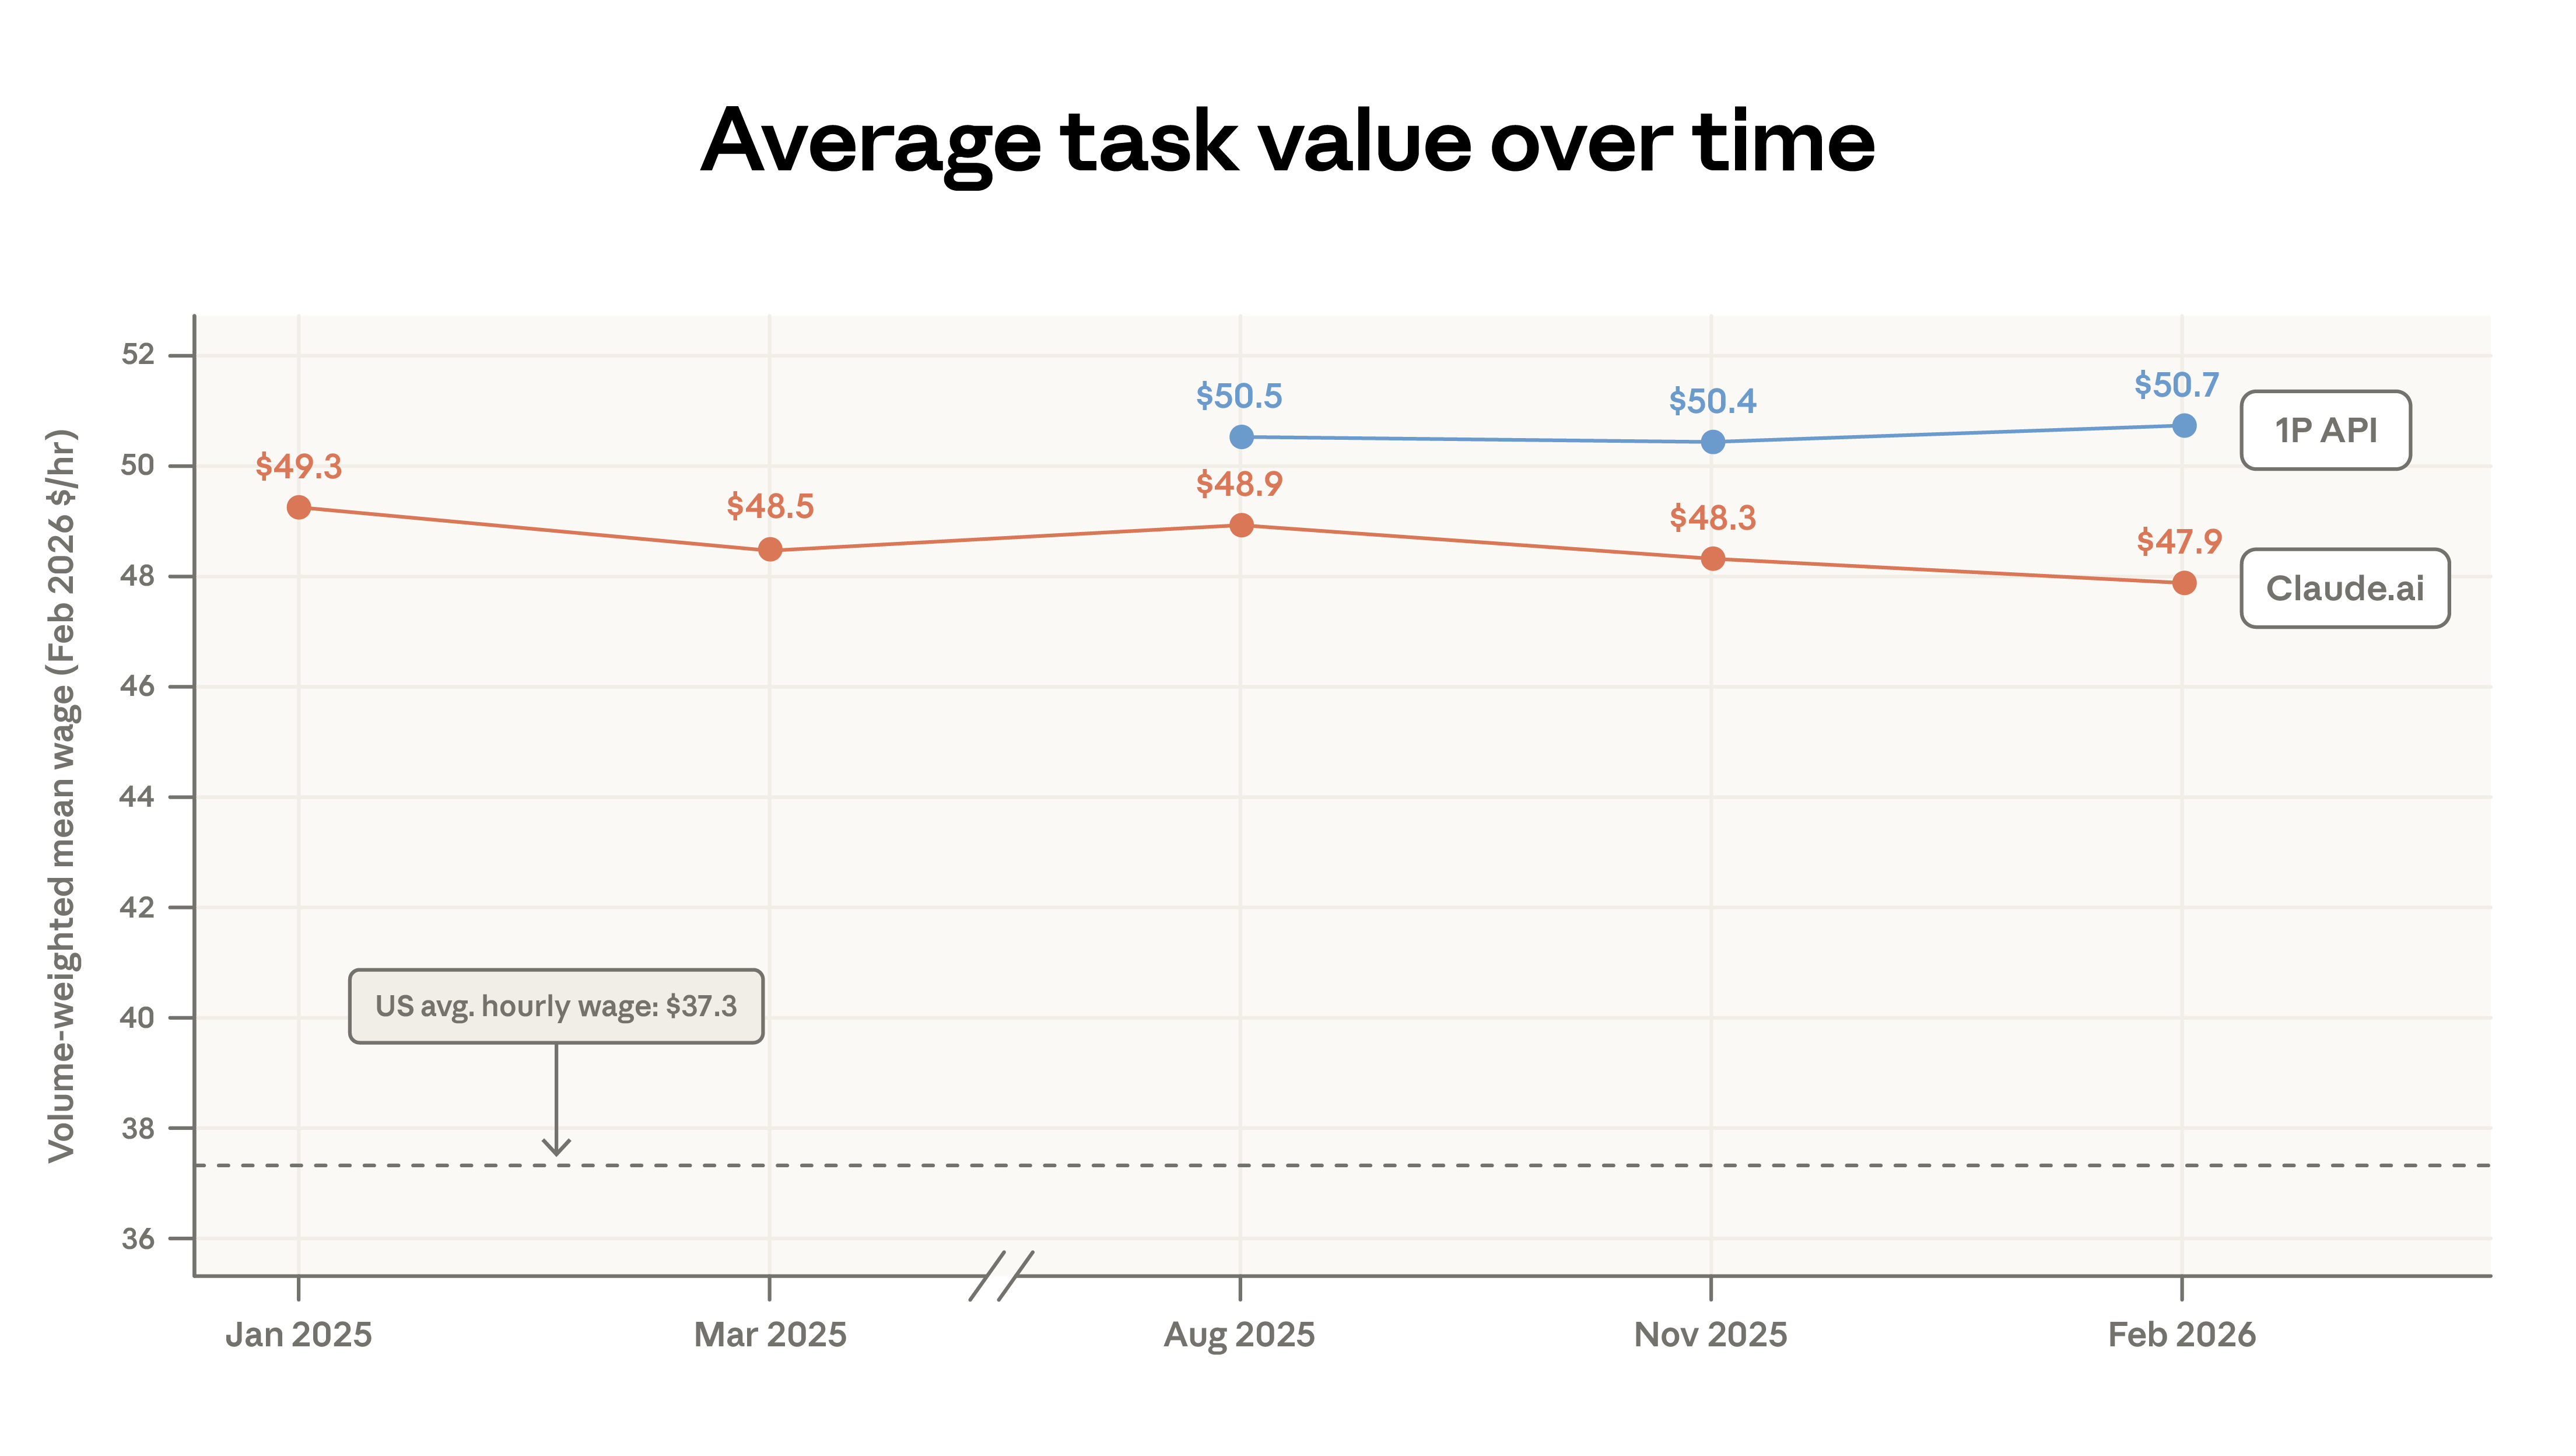
- Claude's adoption has expanded to include lower-paying tasks. As use cases have diversified, the average economic value of Claude work, as measured by the wages of U.S. workers in related occupations, has slightly decreased. This phenomenon is mechanistically driven by an increase in personalized queries related to sports, product comparison, and home repair. This pattern aligns with the standard "adoption curve" narrative—early adopters focus on specific high-value uses such as coding, while later adopters cover a broader range of task types.
- Global adoption inequality persists. Usage remains highly concentrated: the top 20 countries account for 48% of all per capita usage, up from 45% in the previous report, highlighting the continued global adoption gap. However, Claude's per capita usage continues to converge within the United States: since the previous report, the top 10 states' share of usage has decreased from 40% to 38%.
Learning curve
A key finding of the economic index is that Claude’s early adoption was highly uneven—more intensive in high-income countries and concentrated in areas with a large number of knowledge workers within the United States, and only for a relatively small number of specialized tasks and occupations.
An important question is how adoption inequalities might determine where and to whom the benefits of AI go. For example, if the effective use of AI requires complementary skills and expertise (an argument we made in our previous report), and such skills can be learned through use and experimentation, then the benefits of early adoption could create a self-reinforcing cycle.
In Chapter Two, we explore how users shape the value they derive from Claude: how they match model capabilities with current tasks, and how usage patterns and effectiveness change as they accumulate experience using the platform.
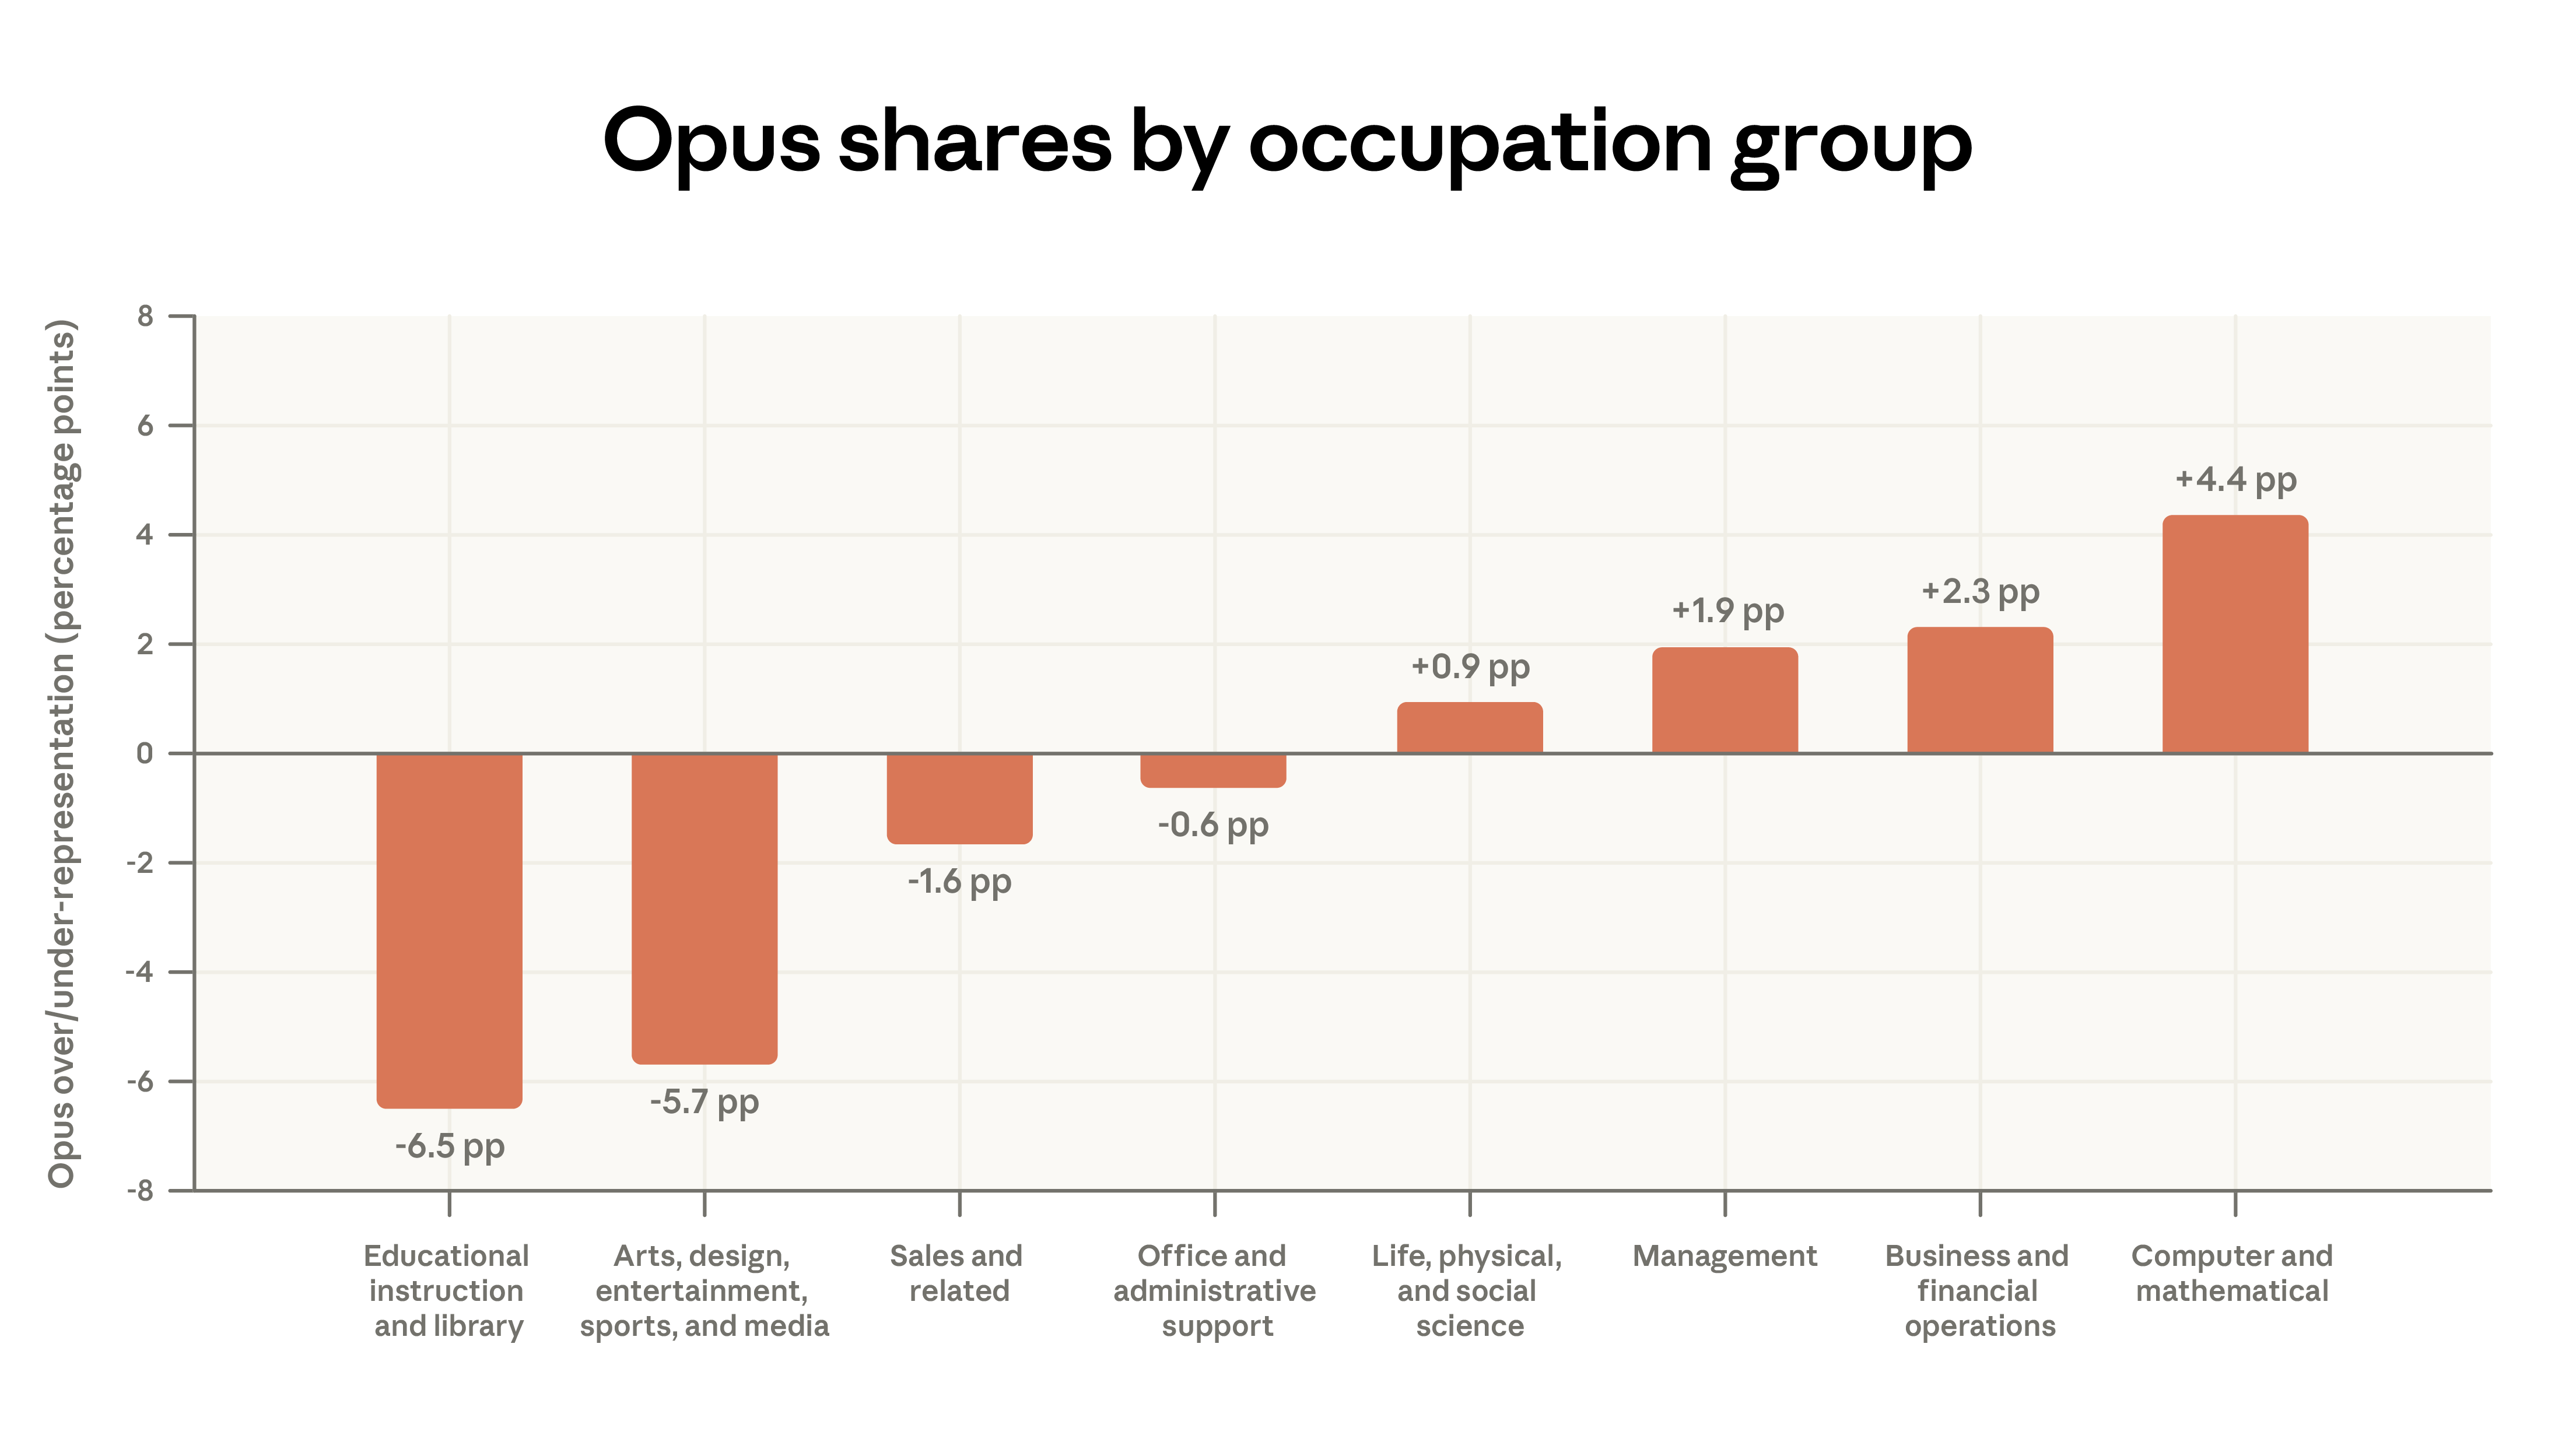
- Model selection is task-appropriate. We found that users tend to choose our smartest model family—Opus—for tasks that typically offer higher wages in the labor market. For example, among paid Claude.ai users, Opus usage was 4 percentage points higher than average for coding tasks and 7 percentage points lower than average for tutoring-related tasks. This model selection pattern is even more pronounced in APIs.
- Long-term users are shifting their focus to work tasks. Users who have used Claude.ai for a longer period are more likely to use Claude for work. Highly experienced Claude.ai users (those who have used the platform for more than 6 months) are 7 percentage points more likely to use Claude for work, and the tasks they handle with Claude also require a higher level of education.
- Learn by doing. Highly experienced users are more successful in conversations with Claude. Specifically, even after controlling for task type or geographical factors, they are still 3 to 4 percentage points more likely to successfully complete the conversation.
Chapter 1: Changes Since the Previous Report
Claude.ai's diverse use cases
We studied the types of tasks performed by Claude by mapping each conversation to a task in the Occupational Information Network (O*NET) of the U.S. Bureau of Labor Statistics. This mapping employed a privacy-preserving methodology, allowing us to describe the overall behavior without exposing individual conversation records.
We sampled one million conversations from each of two platforms: Claude.ai (our consumer interface) and a first-party API (our developer platform).
Code writing remains the most common use case on our platform, with computer and mathematics-related tasks accounting for 35% of Claude.ai conversations.
Between November 2025 and February 2026, Claude.ai's task concentration decreased: the top 10 O*NET tasks accounted for 19% of conversations in February, down from 24% in November. This decline is partly due to the migration of code writing tasks to first-party APIs; Claude Code's proxy design breaks down code writing work into many independent API calls. Although the proportion of code writing in APIs has increased, the overall distribution across task categories remains relatively stable.
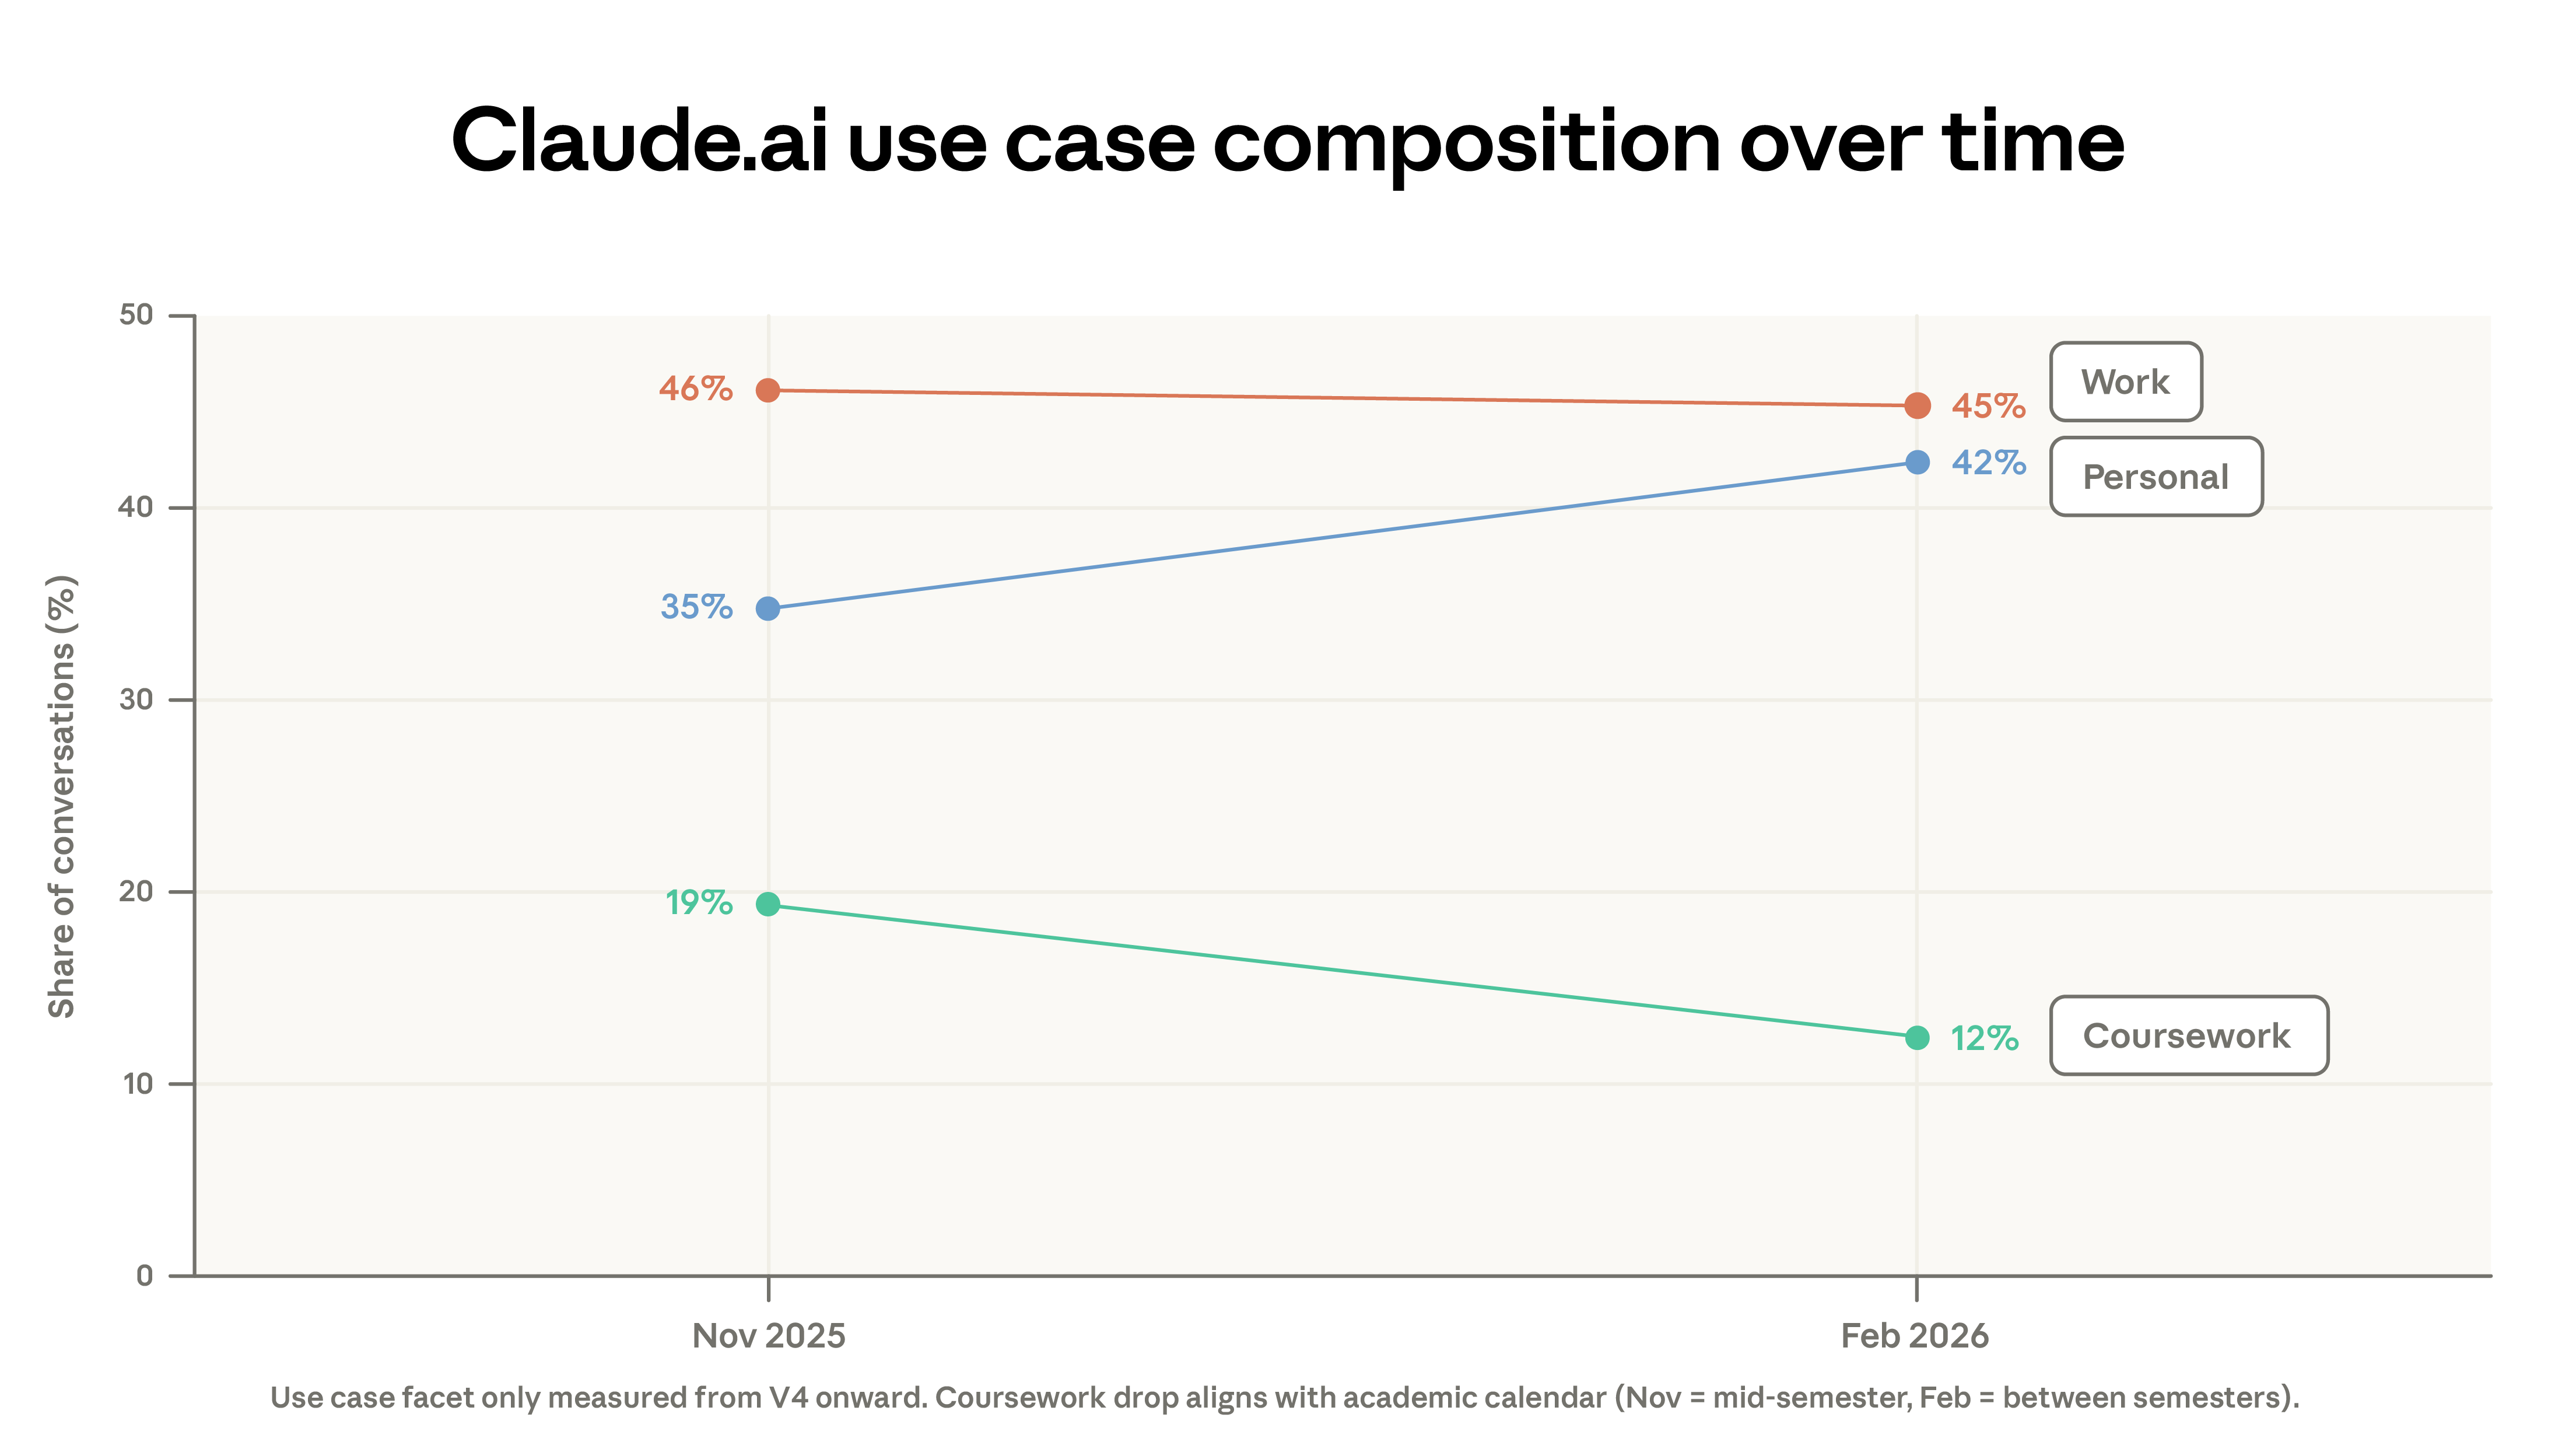
This migration only explains part of the decline in concentration. The composition of usage scenarios also changed: the proportion of academic-related conversations decreased from 19% to 12%, while personal use climbed from 35% to 42%. Part of the decline in academic-related conversations can be attributed to winter academic holidays in some regions. Additionally, there was an acceleration in new user registrations in February , bringing in more casual users.
The diversification of Claude workplace tasks builds upon existing patterns. Our earlier report indicated that 49% of professions already use Claude in at least a quarter of their tasks; this figure has remained virtually unchanged since the previous report. The rate at which new O*NET tasks are emerging has also slowed significantly compared to earlier reports.
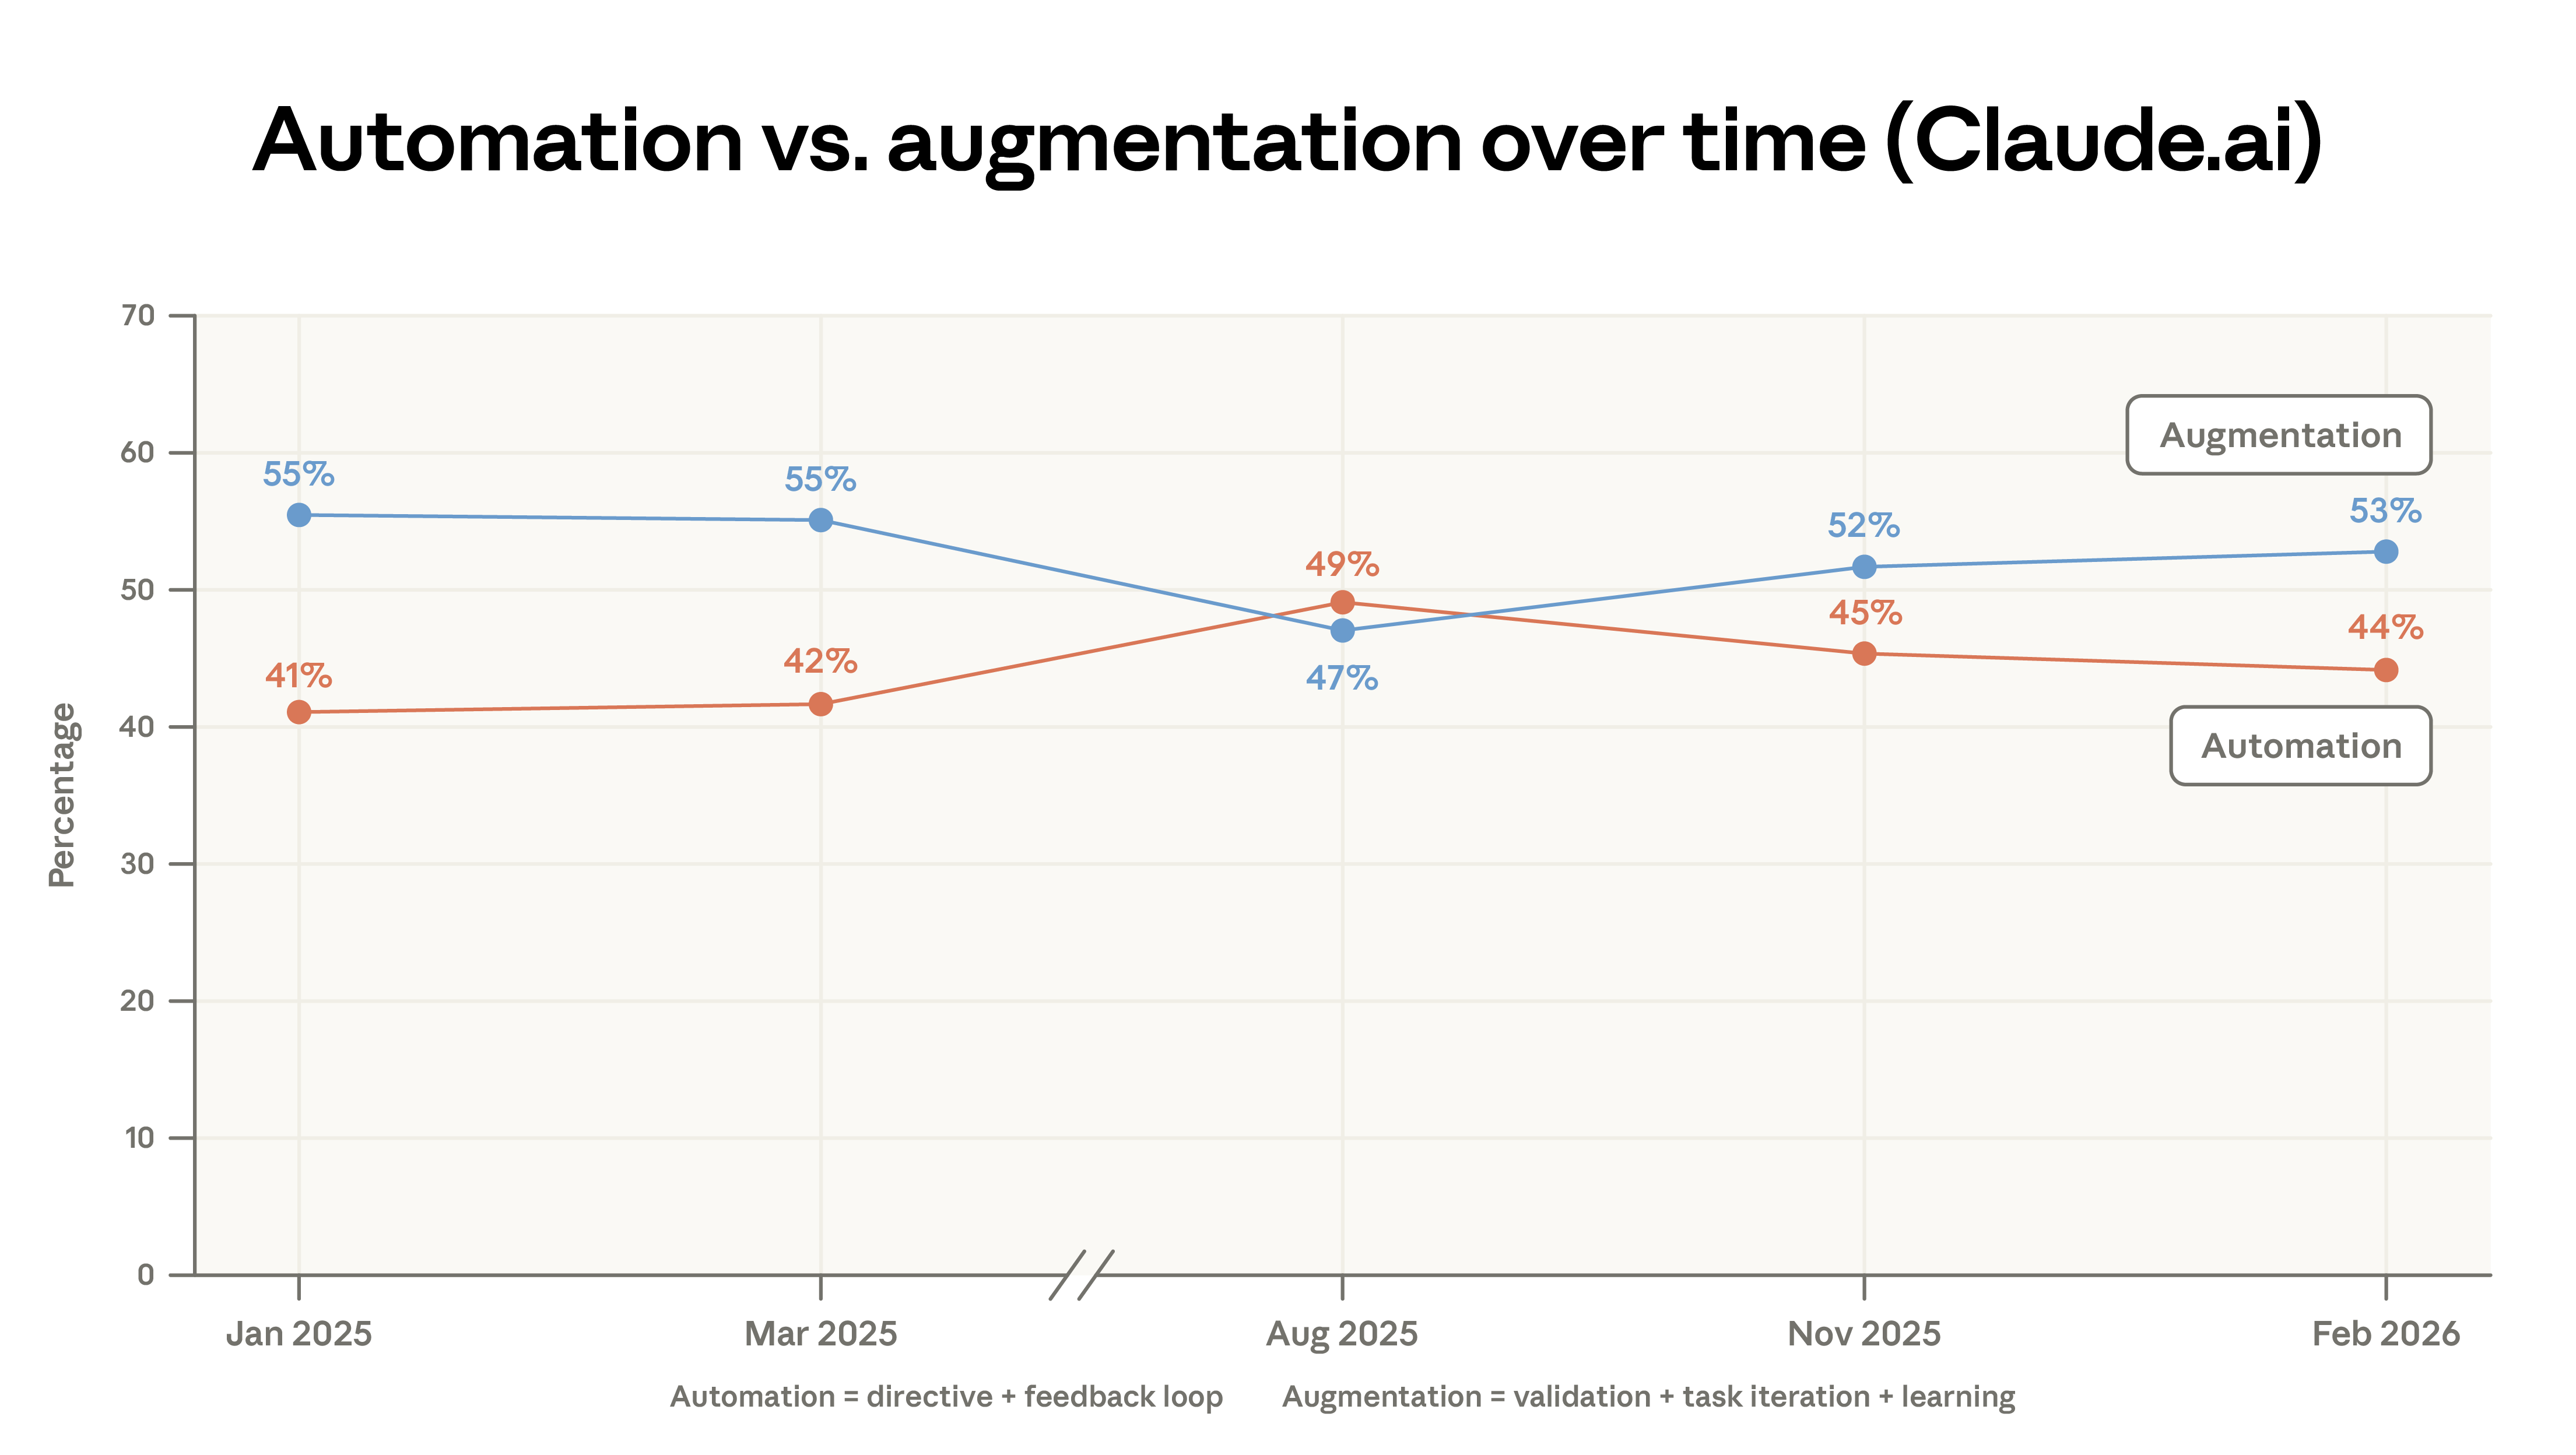
Since our first report, we've categorized dialogues into five interaction types—instructional, feedback loop, task iteration, verification, and learning—and further subdivided these into two main categories: automation and augmentation. Augmentation usage on Claude.ai has increased slightly, primarily driven by a small increase in verification and learning patterns. Automation usage, however, has decreased significantly in first-party API documentation.
The concentration of computer and mathematical tasks on the API platform has increased. Since August 2025, this category has increased by 14% on the API, while decreasing by 18% on Claude.ai. Our parallel labor market analysis suggests that this shift in the API may foreshadow a more direct occupational impact. The proportion of management-related tasks on Claude.ai has risen from 3% to 5%, encompassing analytical tasks (such as preparing investment memos) and customer response tasks.
We measure the value of tasks by the average hourly wage of U.S. workers in the relevant occupations. The average task value on Claude.ai has decreased slightly, from $49.30 to $47.90 per hour, primarily due to an increase in simple factual queries (sports, weather) and a shift in coding tasks. Our earlier analysis indicated that tasks on Claude typically require above-average education levels, and these tasks correspond to above-average wages.
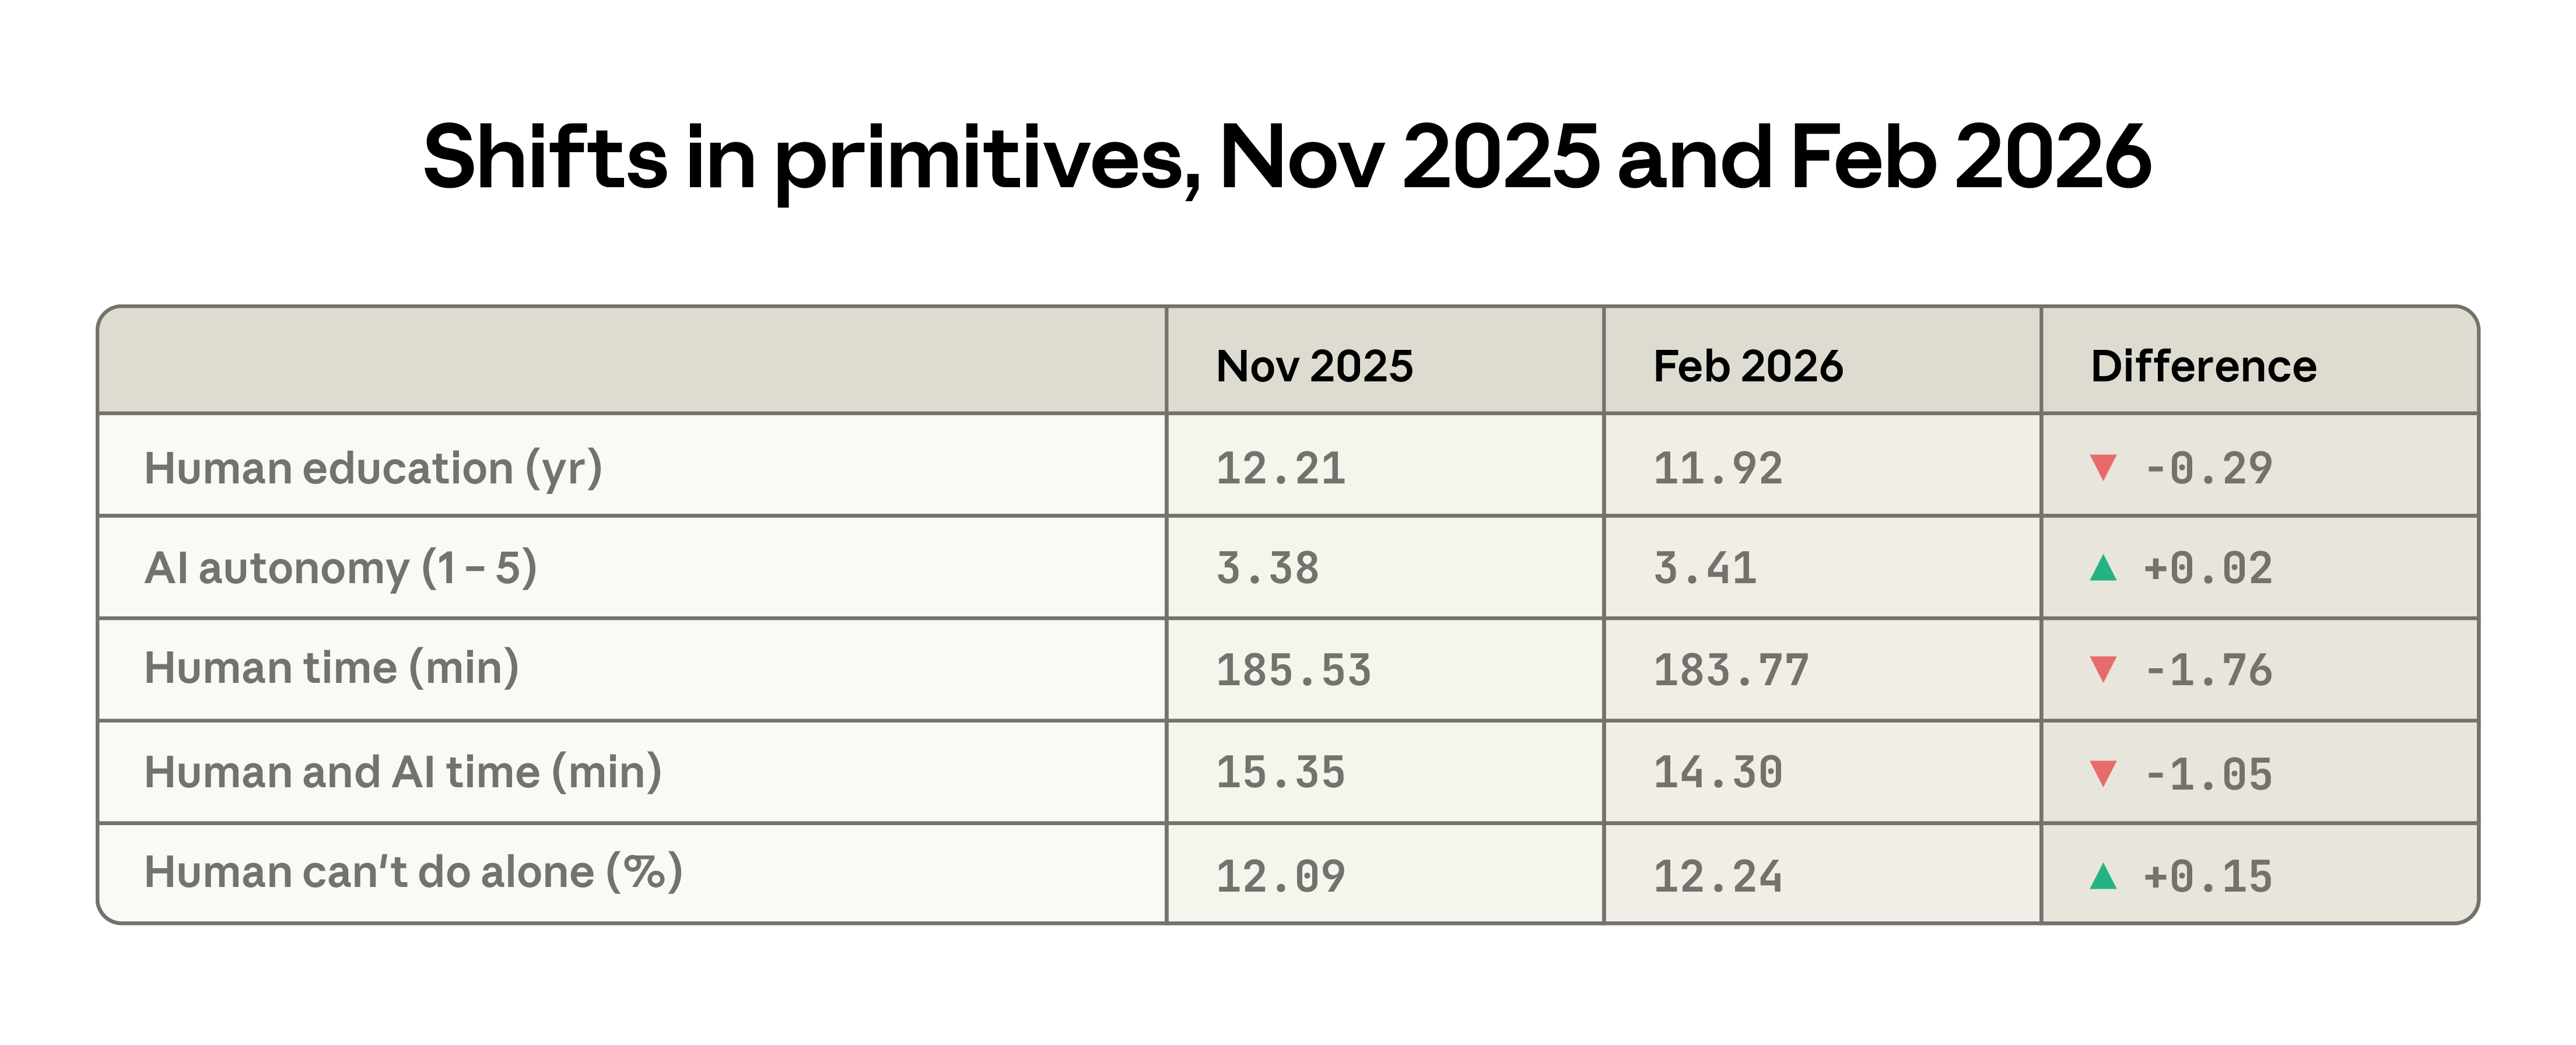
Between the two reports, changes in several key metrics reflect a decrease in the average task complexity of Claude.ai. The average level of education required for typical human input decreased from 12.2 years to 11.9 years; users also gave Claude more autonomy; and the estimated time to complete tasks independently shortened by approximately 2 minutes. Meanwhile, the difficulty of completing tasks without AI assistance increased slightly.
Emerging Automation Models
As more and more tasks migrate to APIs, the level of exposure to automation also increases. API workflows are primarily instruction-based, with minimal human intervention. We have previously highlighted the prevalence of customer service applications—including automated payments and billing support—showing that customer service representatives face a high level of exposure, potentially accelerating career change.
The frequency of the two API workflows approximately doubled between sample periods:
- Business Sales and Outreach: Automating sales support content, researching B2B leads, enriching customer information, and crafting cold emails.
- Automated trading and market operations: monitoring markets and positions, providing investment advice, and informing traders of market conditions.
Geographic convergence re-examination
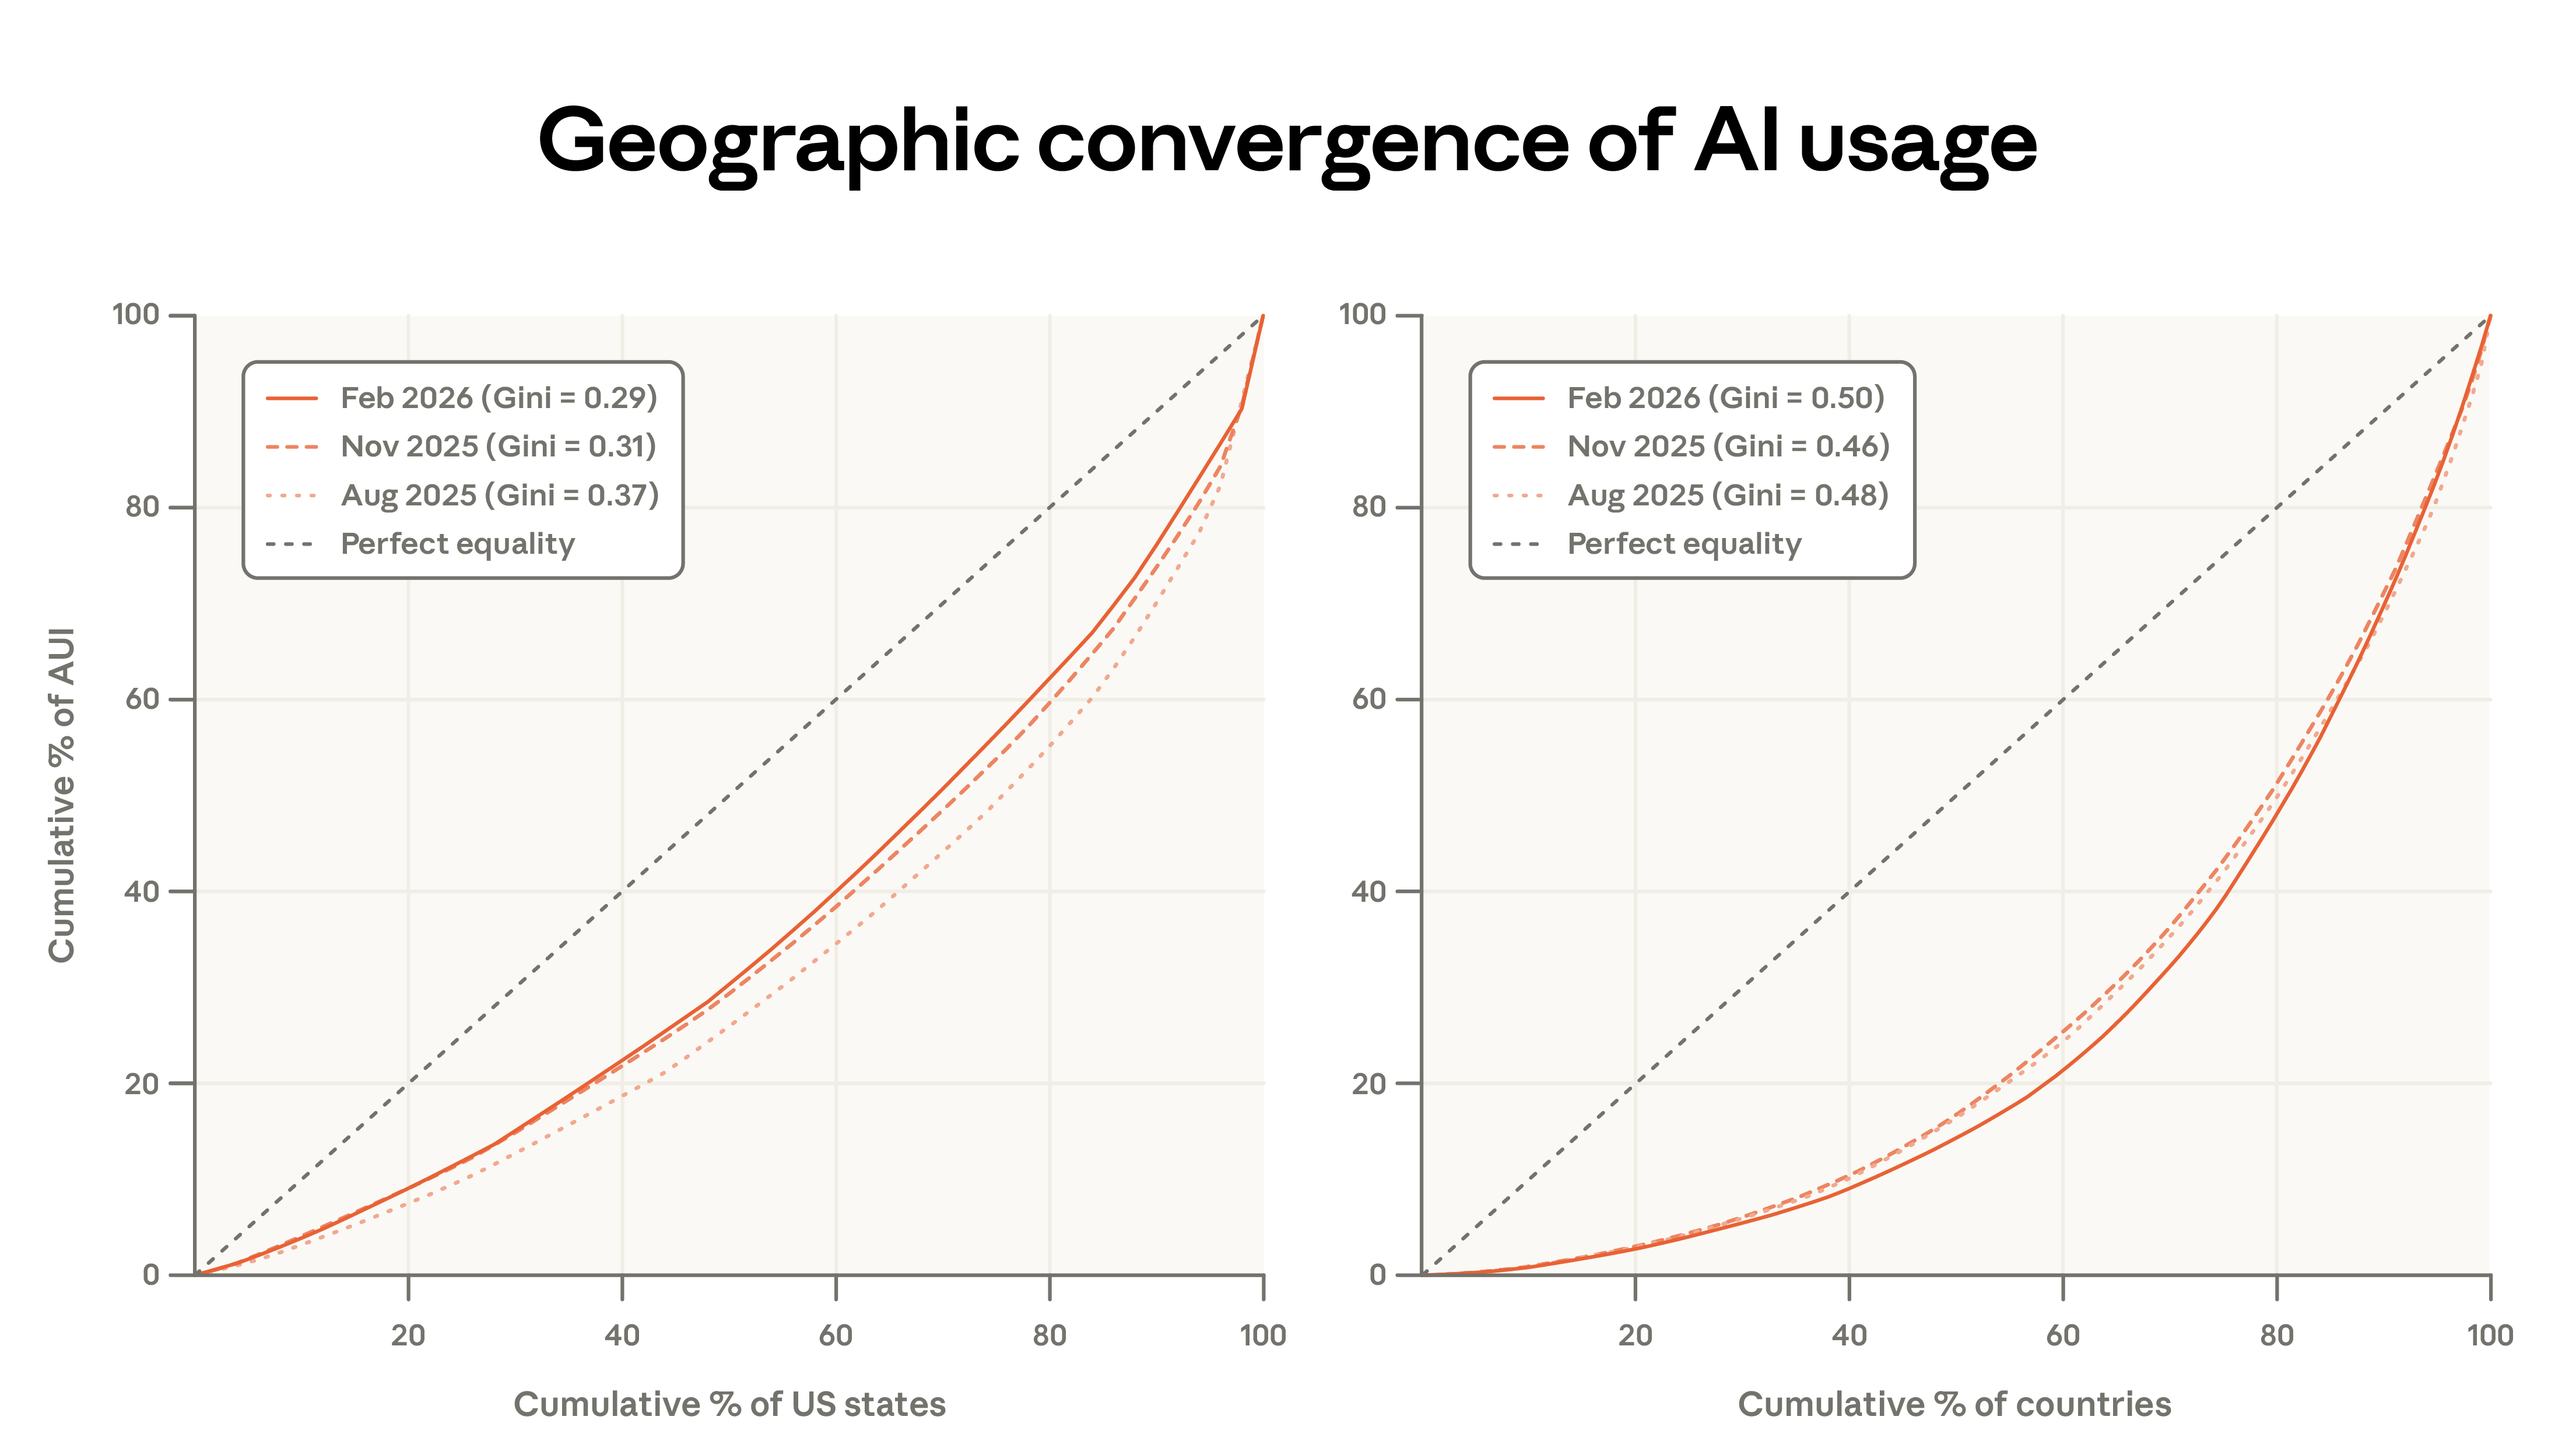
In our earlier report, we noted that the Anthropic AI usage index (adjusted for population) is rapidly converging across US states, with states that initially had lower adoption rates now catching up quickly.
Current data confirms the converging trend continues, but at a slower pace than previously observed. From August 2025 to February 2026, the top five states' share of per capita usage decreased from 30% to 24%. While the Gini coefficient has declined since August 2025, the rate of convergence has slowed. Our updated projections now estimate that it will take approximately 5 to 9 years for all states to reach equivalent per capita usage, compared to an earlier estimate of 2 to 5 years. 6
At the international level, the situation is quite the opposite: concentration has increased, and the Gini coefficient has risen accordingly. The countries with the highest per capita usage now account for a larger share of total usage, with the per capita adjusted usage of the top 20 countries rising from 45% to 48%.
Chapter Two: Learning to Use AI
This chapter explores two usage characteristics that reflect how users deploy and learn AI: model selection, and usage patterns of more experienced users.
The first aspect, model selection, reveals insights into the need for intelligence. Currently, there is almost no existing research on user behavior in multi-model environments, where users can make trade-offs between speed, efficiency, and cost. Opus's focused selection on appropriate tasks should reflect the behavior of assigning more challenging, higher-value tasks to this model.
The second survey examined usage by seniority, exploring differences related to how long users had been using Claude.ai, aiming to reveal the learning curve. Do users become more proficient with Claude? How do usage patterns change? We found evidence consistent with "learning by doing": more experienced users were more productive in conversations, collaborated more deeply with Claude, attempted more challenging tasks, and applied Claude more broadly to diverse work scenarios.
Model selection
Claude's model family—Haiku, Sonnet, and Opus—each makes trade-offs between cost, speed, and performance. Opus has the highest context constraints, excelling in complex tasks, but also has the highest cost per token in the API. A cost-conscious user nearing their usage limit would prefer to use Opus for difficult, high-value tasks and choose alternatives for simpler tasks. This largely aligns with what we've observed in our documentation. 3
Among paid Claude.ai users across all model families, 55% of computer and math tasks (such as software coding) use Opus, compared to only 45% for educational tasks.
Technology-savvy users may recognize the performance advantages and proactively switch from the default Sonnet. Efficiency-conscious users, on the other hand, may use Sonnet for routine tasks to avoid exhausting their usage quota. These differences may also reflect relatively simple educational tasks or a student population with higher cost sensitivity.
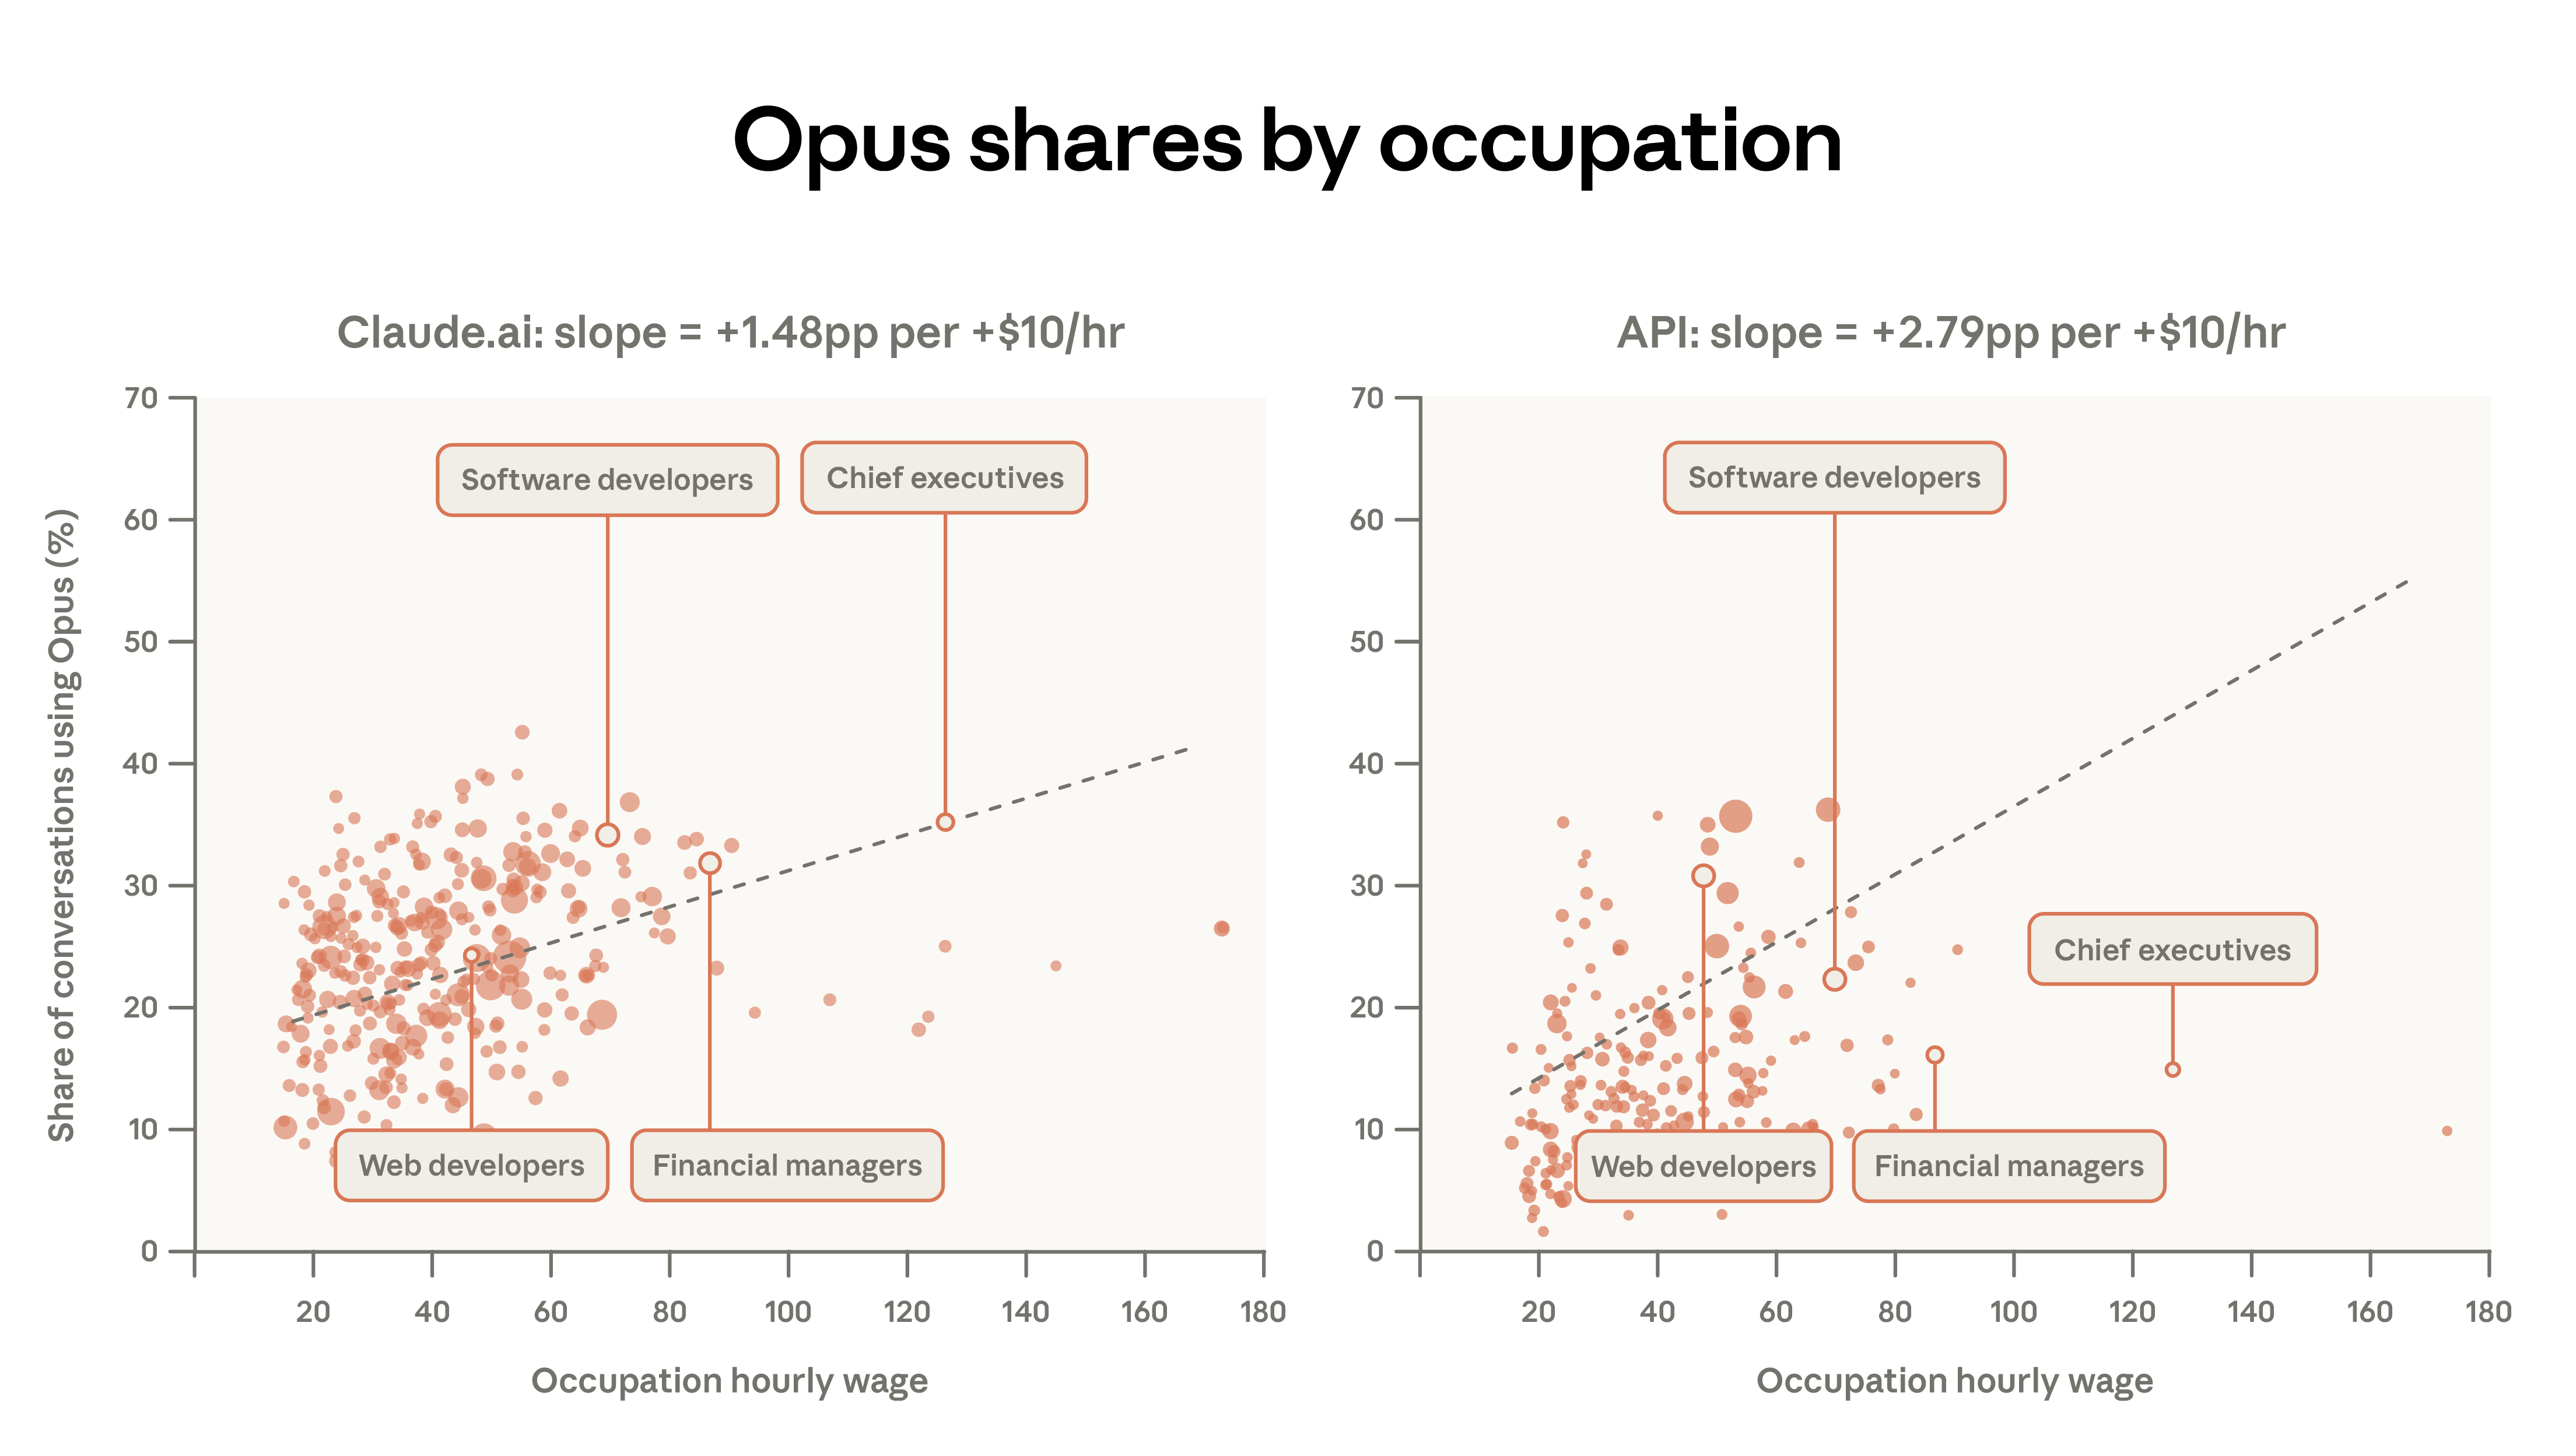
A more detailed analysis reveals a correlation between higher-paying job tasks and more Opus options. For example, on Claude.ai, software developer tasks had a 34% Opus usage rate, compared to only 12% for tutoring tasks. After controlling for other factors, for every $10 increase in average hourly wage, the percentage of Opus in Claude.ai conversations increased by 1.5 percentage points. First-party API traffic is approximately twice as sensitive to task complexity; for every $10 increase in task value, the Opus percentage increases by 2.8 percentage points. Users implementing procedural workflows may have more reasons to switch models compared to web interface users.
Learning curve
Claude's first model was released in March 2023. Its rapid growth since then has resulted in a diverse user profile—ranging from users who have been using the model since its initial release to those who recently registered during the measurement period. How Claude's user profile influences user experience is a topic worthy of in-depth exploration.
Highly experienced users (those who joined at least 6 months prior to the sample period) exhibited a more iterative approach to Claude, while delegating use decreased significantly. They used Claude for work at a rate approximately 7 percentage points higher, preferred tasks requiring higher levels of education, and had a less concentrated task distribution. The top 10 O*NET tasks accounted for 20.7% of their conversations, compared to 22.2% in the control group.
The task distribution of highly experienced users corresponds to approximately one more year of education required for each additional year of usage experience. Furthermore, they use Claude less for personal purposes: 38% of conversations among users with one year of platform experience are personal, compared to 44% for newer users.
These patterns can be interpreted in multiple ways. Highly qualified users represent a self-selected group, potentially reflecting inherent traits—such as programmers who were early adopters, which could be a potential confounding factor. Furthermore, there is survivor bias: users who registered a year ago are more likely to find Claude useful, while those who did not continue using it are not observed.
Early analyses documented that countries with lower incomes and lower levels of education tended to have higher usage complexity. This is likely explained by early adoption patterns: the first users of Claude in any country or user group are likely to be early adopters using Claude in high-value technology applications; as adoption grows, more and more people join, and the user base expands to include more casual use cases.
Request cluster analysis revealed the highest-paid tasks among the most experienced users: AI research, Git operations, manuscript revision, and startup funding. Among the least experienced users, the highest-paid tasks were: haiku composition, sports score lookup, and party food recommendations.
Experience effect
To further explore these relationships while controlling for variables, we used log-level data with dialogue-specific characteristics for analysis. A simple bivariate regression, with dialogue success rate as the outcome variable and seniority index as the predictor variable, showed that senior users were approximately 5 percentage points more likely to successfully complete a dialogue.
Success may simply reflect good prompting techniques, which can be imitated. However, if highly skilled users are engaged in fundamentally different tasks with a higher baseline success rate, then task allocation may be the real explanation for these findings.
The specification incorporates fixed effects for O*NET task and request clusters, comparing highly experienced and less experienced users performing the same type of task—for example, comparing highly experienced and less experienced users in the "Performing Enterprise Financial Analysis, Valuation, and Modeling" cluster. The fixed effects incorporate the average advantage of highly experienced users within the cluster, resulting in a 3 percentage point effect size.
The final specifications further incorporated model, use case, and geographic fixed effects to explore whether highly qualified users selected different models, communicated in different languages, maintained different applications, or registered from different regions. The results showed a slight improvement in the effect of highly qualified users, indicating a 4 percentage point increase in success rate after controlling for all these factors.
These results show that highly experienced users are more successful in Claude conversations, and this phenomenon is not due to simple factors such as language or the task being performed.
The greater success of highly experienced users' interactions with Claude cannot be explained by simple factors such as the language they use or the tasks they perform. A compelling explanation involves the increased ability to learn on the platform—potentially a key success factor in expanding the suite as experience grows.
discuss
This report re-examines key metrics for Claude usage and, for the first time, analyzes model selection and dialogue success rate. First-party API usage has become increasingly concentrated since August 2025: the top 10 O*NET tasks have increased from 28% to 33% of traffic. Claude.ai's tasks have become more diversified since data from November 2025. Geographic convergence in the US continues, but at a slower pace than previously reported. Countries with lower adoption rates face a relatively slight disadvantage.
The basic economic framework allows us to track longitudinal changes in Claude usage. The proportion of academic-related use has decreased, while personal conversations have increased. The average complexity of Claude.ai input has slightly decreased, with conversations showing less complex input and lower estimates of independent completion time.
Claude primarily handles complex, high-value tasks that are not representative of overall US economic activity. As the user base expands, the proportion of traffic for lower-paying task categories has increased slightly. Task value estimates, measured by occupational salary as a proxy, have declined on Claude.ai since our first report, but have increased on the API. Both platforms are focusing on complex tasks using the most powerful Opus model family, a shift more pronounced on the API.
Experienced users employ Claude more collaboratively, using it more for work, attempting more challenging tasks, and achieving better results. This contradicts the expectation that automated use would dominate among the most advanced and experienced users; instead, experienced users demonstrate a preference for iterative use. These results align with the "learning by doing" argument: greater exposure to AI leads to stronger skill extraction.
Another explanation is that group effects or survivor bias may be contributing factors to these results. Early adopters may have above-average technical skills; continued Claude users may represent those who believe the task is best suited to Claude. Well-controlled regression analysis explained simple confounding factors (highly qualified users bringing different types of tasks); over time, we expect to be able to better distinguish between group effects and survivor bias and "learning by doing."
The disparity in success rates may exacerbate labor market inequality. Economists have long recognized the potential impact of skill-biased technological change: such innovations raise wages for highly skilled workers while suppressing wage levels for others. This analysis identifies a channel through which this phenomenon may be occurring: early adopters, who tend to be highly skilled workers, are more successful in their interactions with Claude compared to later adopters with lower skill levels. While both groups face the impact of AI-driven innovation, early adopters are the biggest beneficiaries during the expansion phase.
footnote
- Automated code writing tasks in Claude Code are aggregated and counted as Claude.ai traffic because they originate from Claude.ai subscriptions.
- We define the following O*NET task categories as "Personal" use (or personal purpose): 1) Food preparation and related services (35-0000); 2) Personal care and services (39-0000); 3) Arts, design, recreation, sports, and media (27-0000), primarily for recreation/sports tasks; 4) Agriculture, fisheries, and forestry (45-0000); 5) Building and site cleaning and maintenance (37-0000); 6) Community and social services (21-0000), primarily for personal health/family tasks. We do not include educational tasks in personal use.
- In this analysis, we excluded Claude.ai's free plan users from the sample.
- To aggregate O*NET salaries associated with multiple occupations performing the same task, we calculate a weighted average of salaries, weighted by the number of people employed and the proportion of time spent on the task.
- To identify emerging patterns, we selected the following O*NET tasks: (i) appearing at least 300 times in the current data; (ii) increasing at least twice compared to the previous report.
- The ranges given reflect the different estimates in the previous report that were performed with (5 years) or without (9 years) weights.
- In this analysis, we use log-level data with the same privacy threshold estimation model. See the appendix for detailed methodology.
- Regardless of how seniority is defined, these results are similar.
- Our sampling period overlapped with the release of the Super Bowl ad, bringing in many first-time users.


