

Crypto Expert: Ethereum's northbound counterattack on March 31st was short-lived; the southbound dominance remains unchanged. Profits are in the air on the 2060 southbound move! Latest market analysis and strategy reference.
Ethereum is currently priced at 2030. Don't let market noise sway you anymore! Every rebound in Ethereum right now is essentially creating opportunities for southbound trading. While everyone is still debating whether it can recover, true players have already positioned themselves at key levels. My decision to go south at 2060 wasn't based on courage, but on a precise grasp of the structure, resistance levels, and fund flows. The more chaotic the market, the more professional you appear; the greater the volatility, the more strategic your approach. You see risk, I see rhythm; you fear pullbacks, I adhere to my system. The upcoming market movement will completely differentiate traders; those who understand the structure will profit, while those who don't will only be repeatedly fleeced.
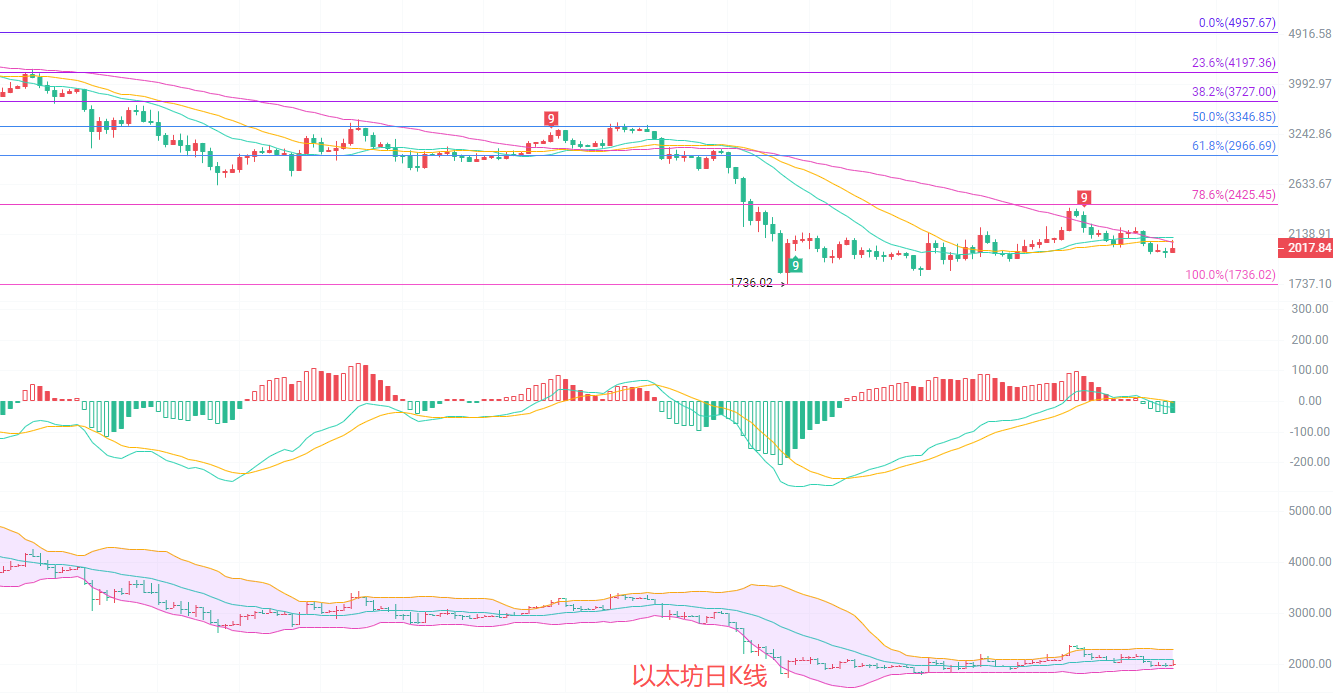
The daily candlestick chart shows the current price at 2029, a 2.32% increase from the previous day, successfully recovering some of the losses, but still below the 20-day moving average (2115), with short-term moving averages providing resistance. The MACD histogram continues to expand, and the DIF line has crossed above the DEA line, forming a golden cross, indicating a clear short-term upward trend. However, insufficient volume suggests a rebound rather than a reversal. The 0.786 Fibonacci retracement level at 2425 is the medium-term target, while strong support lies at 1736. Overall, the price is showing a bottoming-out and rebound pattern, but the southward trend still holds the upper hand.
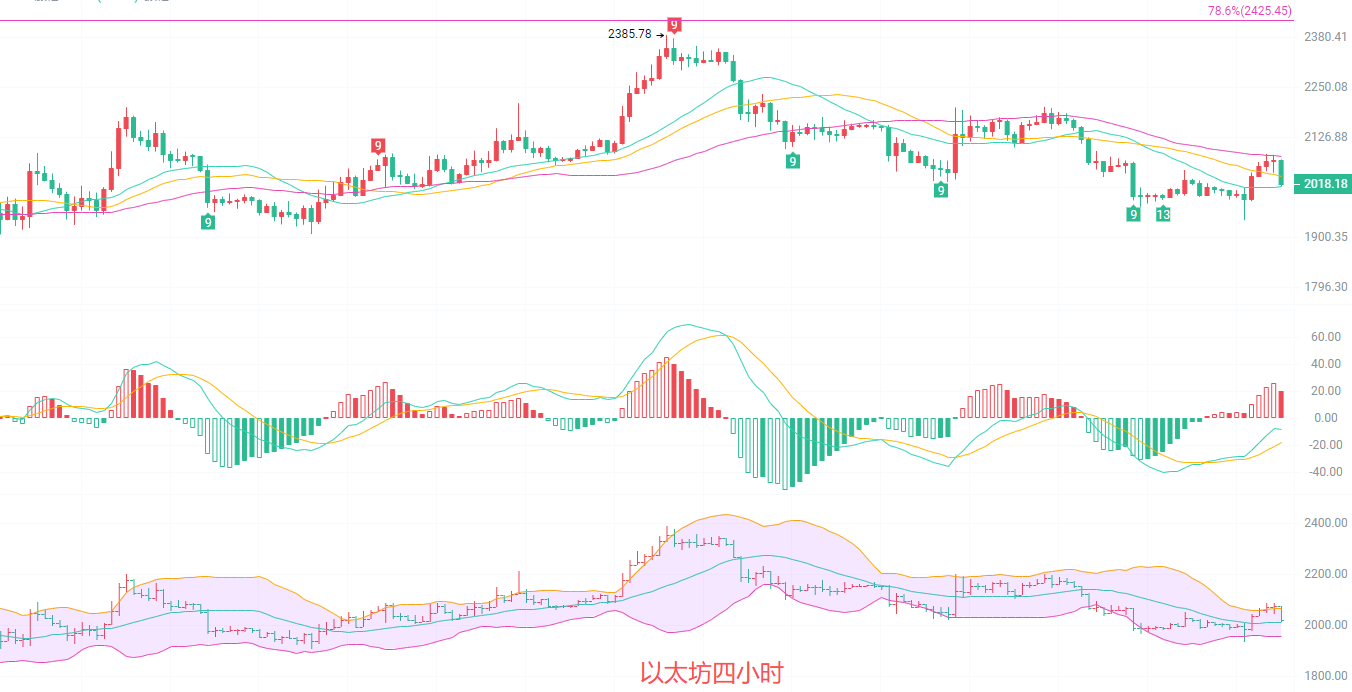
The 4-hour candlestick chart shows a slight pullback, currently oscillating between the MA20 and MA30. While the MACD indicator's DIF is trending upwards, the DEA remains below the zero line, and the volume is weak after the red bars turned green, indicating insufficient upward momentum. The Bollinger Band's middle band at 2012 provides support, while the upper band at 2066 forms resistance. The price is in a narrow trading range, and the short-term direction is unclear, requiring a breakout signal. Those who, like me, entered the market above 2060 can hold and observe for now. After all, the short-term trend remains one of oscillating with a slight downward bias.
Short-term reference: (Real-world data has been updated; please contact the author for details)
The upside target is 2060-2080, with a stop loss at 2100. The target is 2000-1960, and if it breaks through, the next target is 1740.
A northbound move from 1950 to 1980 is recommended, with a stop-loss at 1930 and a target of 2030 to 2050. A break above this level could lead to 2085.
For specific operations, please refer to real-time market data. For more information and details, please contact the author. There may be a delay in article publication; this advice is for reference only, and you assume all risk.

