

Crypto Expert: Bitcoin's Oversold Rebound Enters a New Phase on April 1st! Key Levels for Early Positioning! Latest Market Analysis and Strategy Reference
Bitcoin is currently priced at 68,000, and the market has finally seen a decent rebound. Today, the price stabilized above 67,800, rebounding from a low of 64,918 and successfully breaking through the key 67,000 level. The northbound movement has finally gained momentum. Although the moving averages on the daily chart haven't fully turned downwards, the price has broken out of the downtrend and shows signs of stabilization and reversal. On the 4-hour chart, the Bollinger Bands are widening upwards, the MACD golden cross cross is full of red bars, and northbound momentum is strong, indicating a clear short-term rebound trend. However, there is still resistance from trapped investors between 68,500 and 69,000. Don't blindly chase the highs; pullbacks are opportunities. Shorting at higher levels is only suitable for small-scale trial; buying at lower levels is the current main strategy.
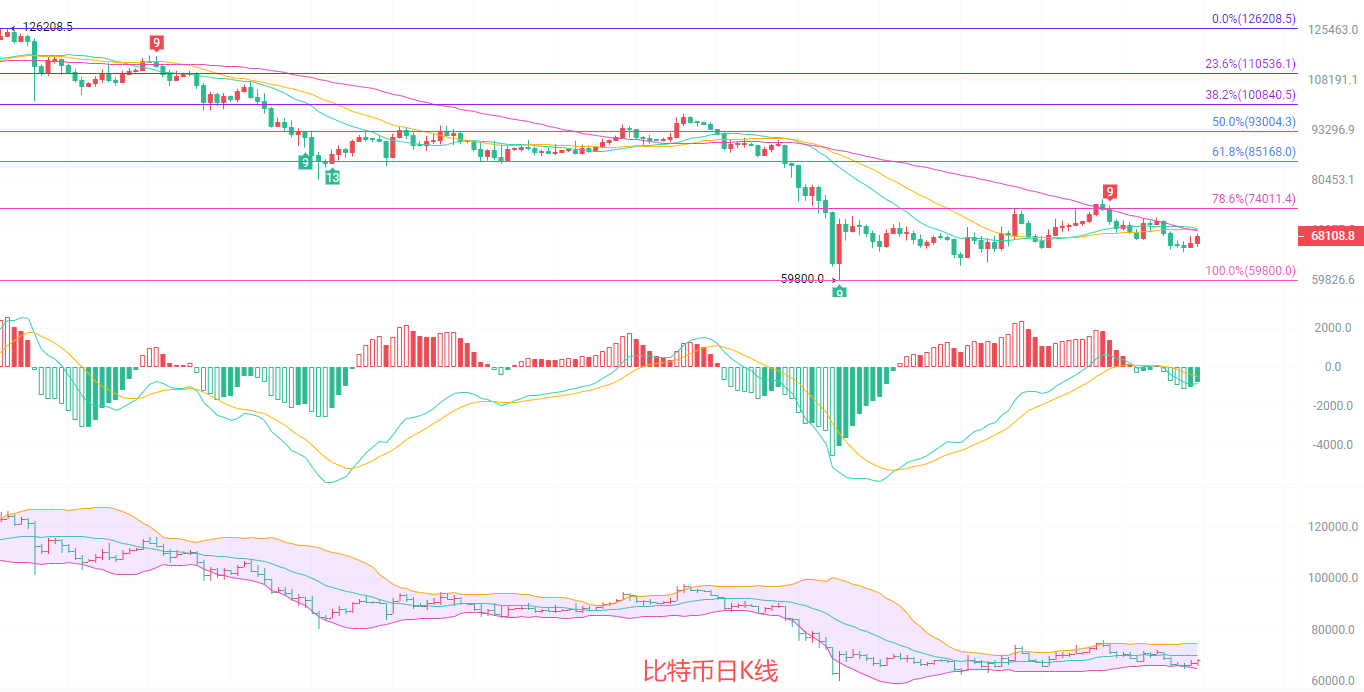
From the daily candlestick chart, the current price is around 68000, with an intraday high of 68600 and a low of 65938, forming an oversold rebound with a green candle. The moving average system is still trending southward, with the 20-day moving average (MA20) at 69853, the 30-day moving average (MA30) at 69578, and the 60-day moving average (MA60) at 69316 providing layered downward pressure. However, the price has successfully stabilized below the MA20 support zone, breaking out of the weak range of the lower Bollinger Band. The MACD indicator shows a death cross cross with the green bars continuing to shrink, indicating a significant weakening of southward momentum. The Bollinger Bands indicate that the middle band at 69853 is strong resistance, and the lower band at 64994 is strong support. A break above the middle band would open up upward potential, with 66000 as the lower support level.
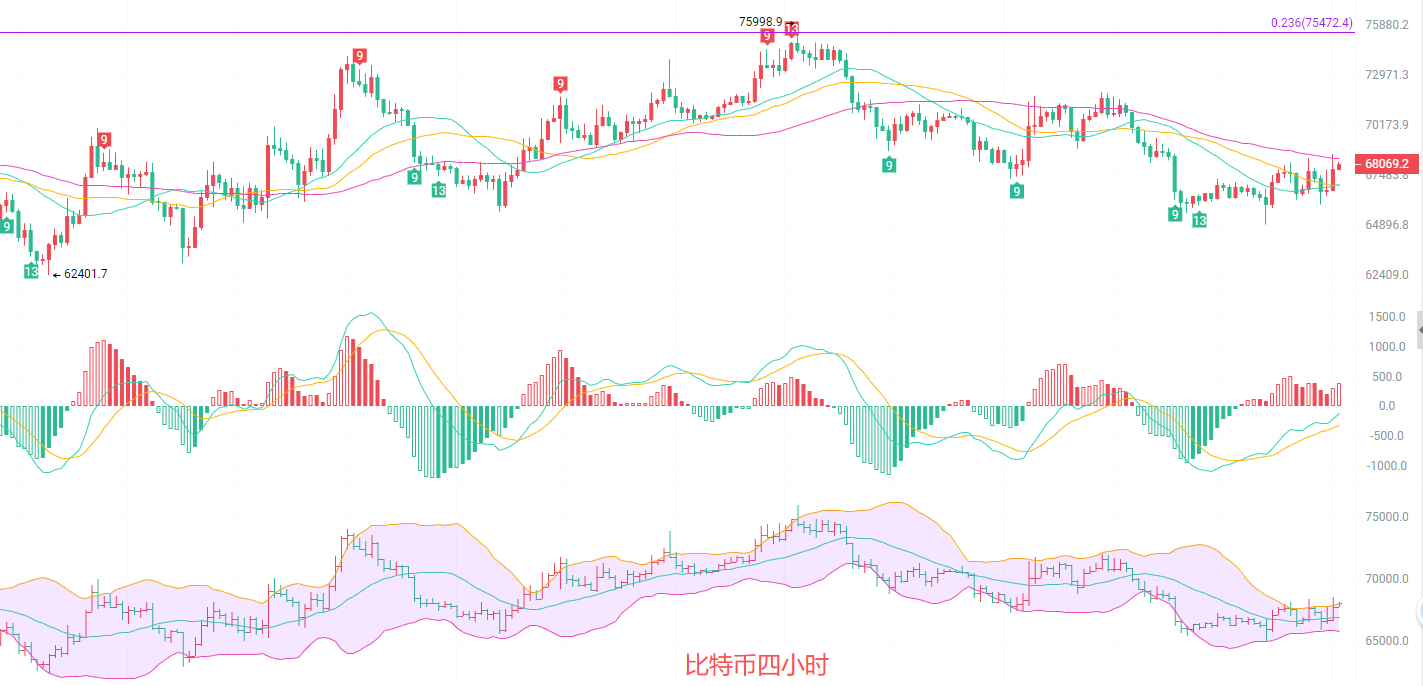
The 4-hour candlestick chart shows an upward trend oscillating around 67800, with more bullish candles than bearish ones, indicating a strong rebound. It successfully broke through the previous resistance level of 67000 and stabilized above the 20-day and 30-day moving averages (MA20 and MA30). The MA20 line at 66976 and the MA30 line at 66928 are turning upwards, while the MA60 line at 68373 still provides resistance. Short-term moving averages are providing support. The MACD indicator shows a golden cross between the DIF and DEA lines below the zero line with continuously increasing red bars, indicating strong upward momentum and a clear rebound trend. The Bollinger Bands show the upper band at 68063 as short-term resistance and the lower band at 65889 as strong support. The price is trading within an upward channel; a break above the upper band would likely lead to a further test of the 69000 level.
Short-term trading strategy: Follow the long-term trend, use small stop-loss orders, and trade quickly.
The support level is 67200-67500, with a stop loss at 66500. The target is 68500-69000, and a break above that level could lead to 70000.
The upside target is 68800-69000, with a stop loss at 69300 and a target of 67800-67500.
In the crypto, those who are prescient reap the rewards, those who are slow to react get the scraps, and those who are oblivious are left holding the bag.
For specific operations, please refer to real-time market data. For more information and details, please contact the author. There may be a delay in article publication; this advice is for reference only, and you assume all risk.

