

Crypto Expert: Bitcoin Completely Reversed on April 2nd! From the crash to the rebound, the bulls have taken control. Don't chase the highs. Latest market analysis and strategy reference.
Bitcoin is currently priced at $68,200. The biggest mistake in trading is thinking you should always follow the market. This Bitcoin rebound isn't driven by emotion, but by real capital inflows. The daily trend is clear, so don't easily short against it and short. Many people try to buy the dips at the bottom and sell at the top, but end up losing on both sides. It's better to follow the trend, hold your core position, and use small positions to trade in waves, slowly accumulating profits. Remember, the crypto is a marathon, not a sprint; only by surviving can you make money.
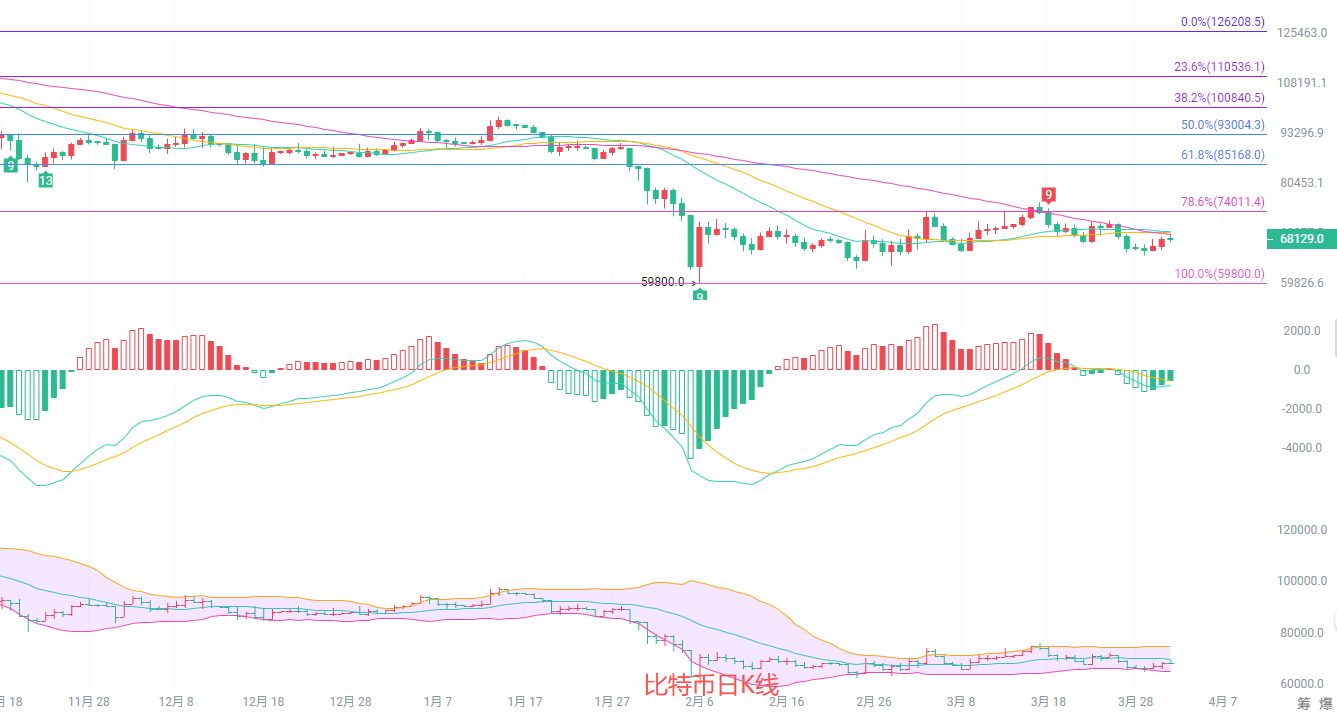
The daily candlestick chart shows a high of 69288 and a low of 67534. The moving average system is trending upwards, with the price supported by the 20-day moving average (MA20), confirming a medium-term rebound trend. The MACD indicator shows a narrowing green histogram, with the DIF and DEA lines converging, indicating an imminent golden cross and continued upward momentum. The Bollinger Bands are widening upwards, with the price trading between the upper and middle bands, demonstrating a strong upward trend. Therefore, the daily chart shows a complete rebound structure, and the medium-term bullish outlook remains unchanged.
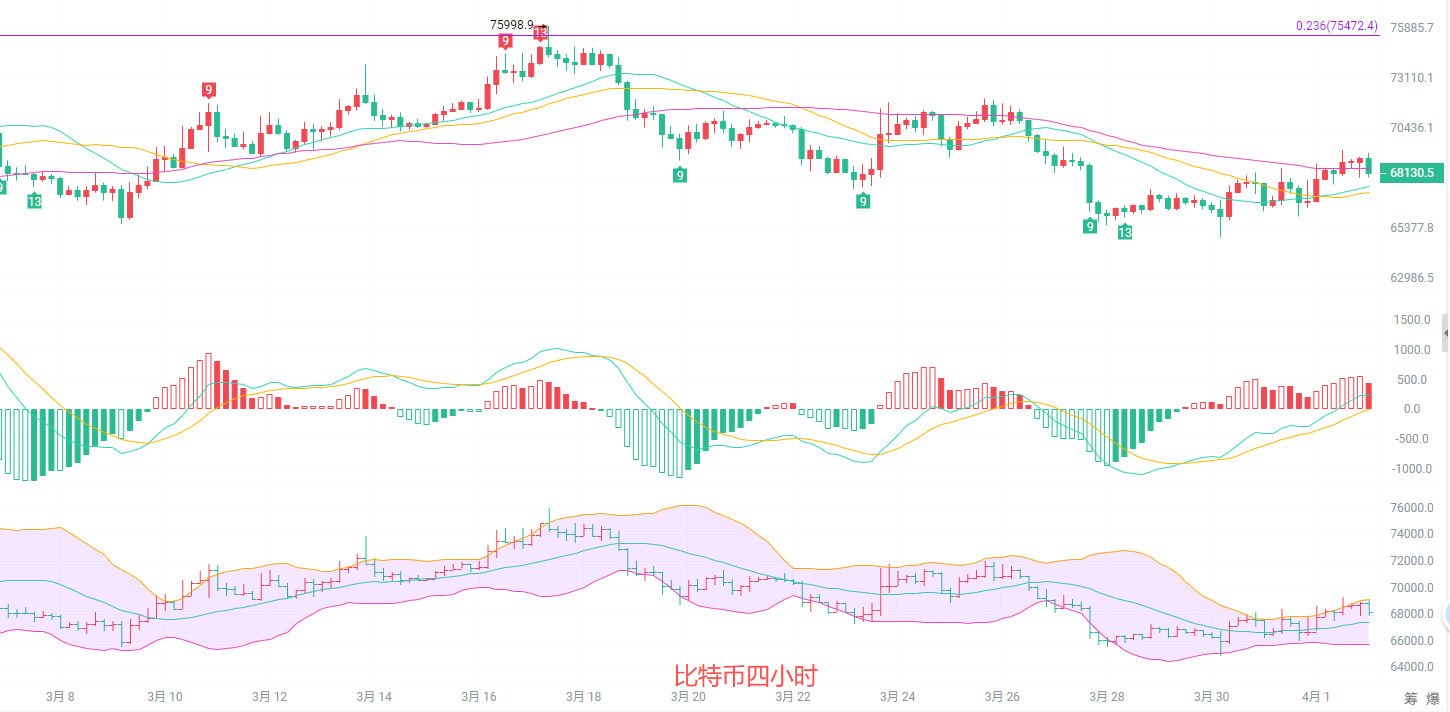
The 4-hour candlestick chart clearly shows the moving average system trending upwards, with the price climbing steadily along the moving averages, indicating a strong short-term trend. The MACD indicator shows continued expansion of the red bars, with the DIF and DEA lines trending upwards, indicating ample upward momentum. The Bollinger Bands are widening upwards, with the price trading near the upper band, indicating overbought conditions and a potential technical pullback. The 0.236 Fibonacci retracement level at 75472 is a key resistance level, while the 20-period moving average at 67448 provides strong support. The 4-hour chart shows a dominant upward trend, suggesting short-term upward fluctuations; pullbacks present buying opportunities.
Short-term trading strategy: Follow the long-term trend, use small stop-loss orders, and trade quickly.
The support level is 66800-67300, with a stop loss at 66000 and a target of 68000-69000. A break above this level could lead to 70000.
The upside target is 69300-69800, with a stop loss at 70300 and a target of 68000-67000.
In the crypto, those who are prescient reap the rewards, those who are slow to react get the scraps, and those who are oblivious end up losing everything.
For specific operations, please refer to real-time market data. For more information and details, please contact the author. There may be a delay in article publication; this advice is for reference only, and you assume all risk.

