Written by: 0x Li Daqi
Introduction: Finding Certainty in the Fog of Cycles
Predicting the future is always challenging in the cryptocurrency market. After the dramatic fluctuations in Bitcoin (BTC) during 2024-2025, market sentiment oscillated between extreme greed and extreme fear. Retail investors were often swept up by short-term price volatility, neglecting the market structure hidden behind the candlestick charts and the true intentions of major players.
This article is based on cryptocurrency technical analyst Killa's latest video, "My forecast for $BTC's movement over the next 3–6 months." Unlike many analysts who rely on complex indicators such as MACD, RSI, or on-chain data, Killa employs a minimalist yet highly insightful approach: pure price action analysis combined with Wyckoff's market cycle theory.
In this in-depth analysis, we will comprehensively dissect Killa's analytical framework. From his short-term prediction of a "gradual decline" over the next 3-6 months, to his assessment of an "ultimate bottom" in late summer/early autumn 2026, and his grand vision of targeting $160,000-$180,000 over the next 3-4 years, we will not only record his conclusions but also delve into the logical reasoning behind them, the confirmation mechanism of support/resistance levels, and why he chose to launch a contrarian Dollar-Cost Averaging (DCA) strategy in what appears to be a bottomless bear market.
This is not just a report on Bitcoin price prediction, but also an in-depth masterclass on trading psychology, cycle cognition, and risk management.
Chapter 1: Reconstructing the Technical Analysis Framework – Abandoning Indicators and Returning to the Essence
Before diving into specific numerical predictions, it's crucial to understand the tools and methodologies used by analysts. Killa's charts exhibit a surprisingly "clean" state, reflecting his unique philosophy of technical analysis.
1.1 Believers in Pure Price Action
On Killa's analytics screen, you won't find any traditional lagging indicators. There are no moving average crossovers, no overbought/oversold divergences in the Relative Strength Index (RSI), and no MACD histogram. He doesn't even cite the currently popular on-chain data analysis.
He has only three core analytical tools:
- Candlesticks: Observe the opening, closing, highest, and lowest prices within a specific time period.
- Support and Resistance Zones: These are key supply and demand transition zones defined by dense trading areas in historical prices.
- Liquidity Sweeps/Deviations: This is one of the core concepts in his analytical framework.
The liquidity-hunting theory posits that markets (especially those dominated by large market makers and institutions) tend to move towards areas of highest liquidity. These areas are typically located outside of clear previous highs or lows, where a large number of retail stop-loss orders and breakout orders accumulate. When prices briefly break through these key levels, triggering numerous stop-loss orders and absorbing liquidity, they often reverse quickly, forming a so-called "false breakout" or "deviation." Killa relies heavily on this pattern to determine the true intentions of major market players.
1.2 Modern Applications of the Wyckoff Method
Although Richard Wyckoff's name is not explicitly mentioned, Killa's division of market structure perfectly aligns with Wyckoff's market cycle theory. He defines the current market state as a "complex market maker distribution phase."
In Wyckoff's theory, the market cycle is divided into four main phases:
- Accumulation: Major funds quietly build positions at low levels, resulting in a long-term bottoming-out phase in the market.
- Markup/Expansion: After accumulation is complete, the price breaks out of the range and enters a clear upward trend.
- Distribution: Major funds distribute their shares to enthusiastic retail investors at high prices, resulting in wide-range fluctuations in the market at high levels.
- Markdown: After distribution is complete, the support level is breached, and the price enters a clear downward trend.
Killa clearly marked these stages on the chart. He believes that after its previous expansion phase, Bitcoin is currently in a long and complex distribution (or redistribution) process. This confirmed structure is the fundamental basis for his conclusion that "it is still in a bear market."
1.3 Comparison of Cycle Time: The Rhyme of History
In addition to the analysis of price (space), Killa also incorporated a time dimension. He used date/price measurement tools on charts to compare the duration of the current bear market with historical averages.
- Current bear market duration: According to his measurements, the current downtrend has only lasted about 170 days from the absolute high of this cycle.
- Historical average duration: He pointed out that the average bear market cycle in Bitcoin's history usually lasts 350 to 400 days.
Key inference: The 170-day timeframe is less than half the historical average. This means that, from a time cycle perspective, the market has not yet undergone a sufficiently long period of "cleansing" and "transfer of ownership." Major players need more time to wear down retail investors' resolve and complete the redistribution of shares. Therefore, it is premature to conclude that "the market has bottomed out." While he doesn't believe the market will necessarily fall for the full 400 days, this data strongly suggests that the bottom formation will take at least several more months.
Chapter Two: Brutal Short- to Medium-Term Predictions – Volatility, Decline, and Capitulation
Based on the above analytical framework, Killa has given an extremely bleak prediction for Bitcoin's price movement over the next 3 to 6 months (i.e., Q2 to Q3 2026). He warns investors that the upcoming market conditions will be a severe test of patience and psychological resilience.
2.1 The protracted "meat grinder" market (Chop & Slow Bleed)
Killa predicts that in the next 60 to 70 days (entering May and June), the market will fall into a state known as "Chop" and "Slow bleed".
- Top of the trading range: He set the expected top of the trading range around $70,000 for the next few months.
- The bottom of the trading range: the current local low is around $60,000.
He referenced the historical price action of the previous cycle, pointing out that the market experienced a tedious four-month period of consolidation before finally breaking below the key low of $17,000. He believes history is repeating itself. Before breaking the psychological level of $60,000, Bitcoin is highly likely to fluctuate within a wide range of $60k-$70k for three to four months.
Analysis of the main players' intentions: The purpose of this market movement is not a rapid plunge, but rather to destroy the confidence of the bulls through repeated ups and downs and a slow downward shift in the center of gravity. Frequent short-term traders will be stopped out repeatedly in this market, while long-term holders will lose patience in the endless waiting.
2.2 Falling below 60k: An inevitable liquidity grab
In Killa's analysis, the current $60,000 level (previous wick low) is an extremely weak support level. He explicitly stated that this level will eventually be broken.
Why? This brings us back to his "liquidity hunting" theory. $60,000 is a clear psychological level and a previous low, inevitably resulting in a massive accumulation of long stop-loss orders. For market makers, this huge liquidity pie is an irresistible temptation.
He predicts that the market will deliberately create a panic scenario of falling below 60k, forming a downward "deviation." When the price falls below 60k, the technical picture will look extremely bad, and retail investors' panic will be completely ignited.
2.3 The ultimate bottom: "Surrender sell-off" below 50k
With the 60k level breached, the market will enter the final stage predicted by Killa: capitulation.
- Timing: He predicts this ultimate bottom will occur between August and September of this year. This aligns with his previous analysis that the bear market has not lasted long enough, extending the downtrend cycle to near historical average levels.
- Price target: He predicts the largest surrender bottom area will be below $50,000.
At this stage, he painted an extremely pessimistic picture of market psychology: as prices fall below 50k, retail investors' psychological defenses will completely collapse. Social media and forums will be filled with voices of despair, and people will start calling for target prices of 40k, 30k, or even 20k. And this is the perfect opportunity for major funds to complete their final accumulation and prepare to start the next super bull market.
Chapter 3: Review of Key Points and the Logic of Bull-Bear Game
To justify his prediction, Killa provided a detailed analysis of recent key price action in the video and clearly explained the game logic between bulls and bears in the current market.
3.1 Confirmation of resistance level: False breakout trap at 73.9k
Killa specifically emphasized the importance of the $72,000-$74,000 area as the current absolute resistance level. He successfully placed short orders in this area and explained the underlying logic in detail.
He marked $73,900 as the "external range high." When Bitcoin's price attempted to break through this high, it failed to hold and quickly fell back. In Killa's view, this was a textbook example of a "liquidity sweep" or "deviation."
Major players used the illusion of breaking through previous highs to lure a large number of retail investors into buying (providing liquidity), while simultaneously triggering stop-loss orders from early short sellers. After absorbing sufficient buying liquidity, the major players quickly reversed short, causing the price to fall rapidly by 9% to 10% after the false breakout. This classic price action established an insurmountable short-term top near 74k.
3.2 Summary of bearish arguments (short to medium term)
Based on Killa's analysis, the bearish arguments in the short to medium term can be summarized into the following three points:
- Qualitative analysis of market structure: From the perspective of the Wyckoff distribution model, the market is in a clear downtrend structure. "Leaving aside sentiment, from a logical structural perspective, we are currently in a bear market."
- The time cycle is incomplete: 170 days of decline is far from enough to complete a thorough bear market shakeout. The market needs more time (until late summer or early autumn) to build a solid bottom.
- Liquidity magnet effect: The huge liquidity pool below $60,000 will inevitably attract prices to test downwards in order to complete the final accumulation of shares by the major players.
3.3 Emergence of bullish arguments (medium to long term)
Despite his extreme pessimism about the coming months, Killa's long-term stance has undergone a dramatic reversal. His bullish argument is not based on short-term technical breakouts, but on a fundamental shift in the risk/reward ratio.
He explicitly stated that the current risk-reward ratio is extremely bullish. Although he predicts the price will fall below 50k, he believes the downside potential is far less than the upside potential.
- Stop Short: Based on this risk-reward assessment, he announced a crucial decision in the video: he has stopped short. He explicitly stated that his short position near 74k was his "last swing short position" in this bear market. Continuing to hold short positions at the current price level is akin to picking up coins in front of a steamroller—the risk-reward ratio is extremely disproportionate.
- The allure of long-term returns: He did the math. If an investor buys now (around 60k) and holds for 3 years, targeting his predicted 160k+, they will gain approximately 87% in absolute terms. That translates to an annualized return of 25% to 30%. In any traditional financial market, this is an incredibly impressive return.
Chapter 4: Macro Perspective – Bitcoin's Relative Advantage as the Ultimate Asset
While Killa's analysis focuses primarily on charts and price action, he doesn't completely ignore the macroeconomic context. Interestingly, unlike other analysts, he doesn't delve into lengthy analyses of the Federal Reserve's interest rate decisions, CPI inflation data, or net inflows/outflows of spot ETFs.
His macro-analysis perspective is very unique, focusing on the relative performance comparison across markets.
4.1 "Alpha" that outperforms traditional finance
Killa emphasized an undeniable fact: Bitcoin has been the best-performing asset globally over the past decade, bar none.
He compared Bitcoin to the cornerstones of traditional financial markets—the Nasdaq and the S&P 500. He pointed out that even after a decade-long bull market in US stocks, the Nasdaq and S&P 500 have only achieved an average annualized return of about 10% over the past 20 years.
In contrast, as he calculated in the previous chapter, even if you buy Bitcoin spot at what currently seems to be a “high” price of around $60,000, as long as you hold it for a long enough period (3-4 years), the expected annualized return can easily reach 25% - 30%.
4.2 The Underlying Logic of Asset Allocation
This macroeconomic comparison reveals the underlying logic of Killa's asset allocation: against the backdrop of excessive fiat currency issuance and increased global macroeconomic uncertainty, investors are looking for assets that can provide true " alpha ( excess returns) " .
While traditional US stocks are stable, their growth potential has gradually peaked. Bitcoin, on the other hand, as an emerging asset with absolute scarcity, decentralization, and gradual acceptance by global institutions, has an upward potential that traditional assets cannot match.
Therefore, his macroeconomic argument is very simple and direct: do not be distracted by short-term macroeconomic data noise. As long as Bitcoin can consistently and significantly outperform traditional US stocks in the long run, it is the ultimate asset worth holding in large positions.
Chapter 5: Unity of Knowledge and Action – Killa 's Specific Trading Strategies and Execution Plan
The best analysts not only predict the future, but also develop practical trading plans. In the latter part of the video, Killa reveals his specific trading strategies for dealing with market conditions over the next 3-6 months without reservation.
5.1 Core Strategy: The Art of Spot DCA
Given his assessment that the market had entered a phase of "limited downside and huge upside," Killa abandoned the high-risk short-selling contracts and instead adopted the most classic but also most challenging strategy: Spot Dollar-Cost Averaging (DCA).
He is gradually building up long-term spot positions in preparation for the next super bull market.
5.2 Publicly disclosed "tiered" order placement locations
Killa clearly illustrated his buying plan on the chart. Instead of trying to "buy the dips" at the absolute lowest point, he used a tiered grid order book strategy. His spot buy points were set as follows:
- $65,000
- $60,000
- $55,000
- $50,000
- $45,000
During the video recording, he revealed that his buy orders at 65k and 60k had been filled. This means that he had already entered the market with a portion of his capital and had prepared sufficient cash (stablecoins) to cope with the extreme capitulation market conditions that might occur if the price drops below 50k.
5.3 The Triumph of Long-Term Thinking: A 3-4 Year Holding Period
Killa emphasizes that the success of this spot DCA strategy depends on a sufficiently long holding period. He advises investors to take a long-term view after establishing a position and prepare to hold for 3 to 4 years.
This timeframe wasn't arbitrary. It precisely covers the entire fermentation period of Bitcoin's next halving cycle. In the history of cryptocurrencies, the true secrets to wealth often belong to those "diamond hands" who bravely built positions at the bottom of bear markets and held them steadfastly over long periods.
Chapter Six: Risk Management and Psychological Preparation – How to Survive in the " Meat Grinder "
Every trading strategy carries risk. At the end of the video, Killa issues a stern risk warning to investors and shares his methods for building mental resilience when facing extreme market conditions.
6.1 The biggest risk: miss the pump(Front-run Risk)
This is a very counterintuitive viewpoint. If Killa strongly predicts that the price will fall below 50k, why did he start buying at 65k and 60k? Why not stay out of the market and wait for that "absolute bottom"?
Killa explained that, given the current profit/loss ratio, the biggest risk is not short-term paper losses, but rather miss the pump entirely (being overtaken).
The market is unpredictable. Although his model points to a bottom below 50k, if major funds have completed their accumulation in advance, or if there is a sudden major positive news (such as a sovereign country announcing that it will include Bitcoin in its reserves), the market may reverse at 55k or even 60k and surge ahead.
If investors wait indefinitely for prices to fall below 50k, and the market reverses prematurely, they risk miss the pump entirely, thus missing out on a massive 87% gain over the next 3-4 years. Therefore, he prefers to start buying in batches now, accepting short-term paper losses (drawdowns), to ensure he's "on board." This is a highly sophisticated probabilistic thinking and risk hedging strategy.
6.2 Avoid frequent trading: Stay away from the trap of "market consolidation".
In response to the anticipated "volatile and declining" market conditions in the coming months, Killa issued a clear warning: stay away from frequent short-term contract trading.
Within the wide trading range of 60k-70k, the market frequently experiences false breakouts and false breakdowns. If investors attempt high-frequency swing trading within this range, they are highly susceptible to being stopped out by major players through repeated stop-loss orders, ultimately depleting their capital.
His advice is: shut down high leverage, stop monitoring the market, strictly adhere to the spot DCA plan, and then spend your time on life and learning. Only by surviving this most agonizing "meat grinder" market can you reap a bountiful harvest in the future bull market.
Conclusion: Sow hope in despair
Killa's video provides us with a valuable roadmap for the future trajectory of Bitcoin.
He coldly told us that the bear market is not over yet, and the real pain (falling below 60k, or even 50k) is yet to come. The next few months will be a long and torturous slow decline.
However, he also gave us hope with a long-term perspective: the profit-loss ratio has reversed, the downside is limited, and the ambitious goal of 160k-180k in the next 3-4 years is worth starting to plan now.
In the cryptocurrency market, rife with frenzy and panic, Killa's analysis serves as a sobering reminder. He teaches us to discard complex indicators and return to the essence of price behavior; he reminds us to respect market cycles and not try to predict absolute bottoms; and he shows us how true trading masters, through strict discipline, reasonable position management (DCA), and long-term patience, sow hope in despair and ultimately weather bull and bear markets.
The next three to six months will be a severe test for every Bitcoin investor. But as history has repeatedly shown, those who can remain clear-headed and steadfastly execute their strategies during the depths of a bear market will ultimately be the biggest winners in the next bull market.
Chapter 7: Deep Extension – The Micro-Mechanism of Liquidity Sweep
To help readers gain a deeper understanding of Killa's core analytical tools, this chapter will break down the micro-mechanisms of "liquidity hunting" in the cryptocurrency market. This is not only fundamental to understanding Killa's predictions but also an essential lesson for retail investors to survive in the treacherous market.
7.1 Retail Investors' "Sense of Security" and Market Makers' "Prey"
In traditional trading tutorials, retail investors are taught to place stop-loss orders below key support levels and buy-stop orders above resistance levels. This is theoretically done to control risk or capture trends. However, in the highly institutionalized and algorithmic modern crypto market, these orders clustered within specific price ranges constitute massive "liquidity pools."
For market makers or "whale" with large capital, their biggest problem is not "what to buy" or "what to sell," but "how to execute huge orders at the best price without causing drastic market fluctuations."
- The dilemma of building a position: If a whale wants to buy $1 billion worth of Bitcoin at $60,000, it cannot simply buy up the market directly, because this would instantly push the price up to $65,000 or even $70,000, resulting in an extremely high average cost of building a position (i.e., slippage).
- The thirst for liquidity: To solve this problem, whale need to find a place with a large number of sell orders. And the stop-loss orders (essentially market sell orders) placed by retail investors below $60,000 are exactly the liquidity that whale are dreaming of.
7.2 The Four Stages of the Hunting Process
Killa's repeated emphasis in the video on the 60k drop falling below expectations is based on a profound understanding of this micro-mechanism. A typical downward liquidity grab (also known as the "spring effect" or "downward deviation") usually includes the following four stages:
- Inducement: The price fluctuates repeatedly above $60,000, forming a seemingly unbreakable support level. Retail investors thus gain a false sense of security and buy in at this level, setting stop-loss orders at $59,500 or $59,000.
- The Sweep: Major funds suddenly exerted pressure, selling a small amount of shares and driving the price below $60,000. This action instantly triggered a massive number of stop-loss orders (market sells) from retail investors. Market sentiment instantly shifted from calm to extreme panic.
- Absorption & Reversal: While retail investors panic and sell, major funds (whale) spread their nets below, using these market sell orders to complete massive accumulation at extremely low costs (such as $58,000 or $57,000). Once the accumulation is complete and the selling pressure disappears, the price will quickly rebound and rise back above $60,000.
- Short Squeeze: A rapid price reversal can result in losses for traders who shorted when the price fell below 60k. As the price continues to rise, these short sellers are forced to buy back to close their positions (stop-loss), further pushing the price higher and creating a strong upward trend.
7.3 The Underlying Logic of Killa Prediction
Once we understand the above mechanism, we can fully understand why Killa was so certain that $60,000 would be broken, and why he set the ultimate bottom below $50,000.
- The vulnerability of the 60k level: The 60k level is an extremely obvious psychological barrier and a previous low, with a huge liquidity pool below it. Major funds are unlikely to let go of this lucrative opportunity.
- Surrender below 50k: A drop below 60k alone may not be enough to make even the most stubborn bulls surrender. The major players need to create deeper panic, driving the price below 50k to completely destroy retail investors' faith, in order to accumulate enough cheap shares and lay the foundation for a future super bull market of 160k.
Chapter 8: Practical Applications and Variations of the Wyckoff Distribution Model
In the video, Killa mentions that the current market is in a "complex market maker distribution phase." To make these notes more practically relevant, we will delve into the specific manifestations of the Wyckoff distribution model in the current Bitcoin market.
8.1 The Five Stages of the Classic Wyckoff Distribution Model
Richard Wyckoff divides the market top distribution process into five phases (Phase A to Phase E). Killa's analysis echoes this classic framework:
- Phase A (Stop of the previous uptrend): Initial supply (PSY) and buying spree (BC) occur, followed by a natural pullback (AR) and a second test (ST). This marks the beginning of the cooling of the bull market frenzy.
- Phase B (Constructing the Distribution Range): Major funds repeatedly oscillate within this range (such as the 60k-74k range mentioned by Killa), distributing shares to retail investors. This phase is characterized by violent fluctuations and a lack of clear direction.
- Phase C (Testing and Deception): This is the most crucial part of the distribution phase. The major players will create the illusion of an upward breakout from the top of the range (Upthrust, UT, or UTAD) to lure retail investors into chasing the price higher. The false breakout at 9k mentioned by Killa is a typical example of UTAD (a pullback after distribution).
- Phase D (Trend Emerging): Prices break below the support level of the range (such as Killa's predicted break below 60k) and show a weakness signal (LPSY). At this point, supply completely dominates the market.
- Phase E (Downtrend Development): Prices break out of the distribution range and enter a clear bear market downtrend.
8.2 The "Complexity" and "Redistribution" of the Current Market
Killa particularly emphasized the "complexity" of the current stage. In the real market, the Wyckoff model rarely unfolds perfectly as it does in textbooks.
- The possibility of redistribution: If the market, after falling below 60k, does not immediately plunge into a deep abyss, but instead forms a long-term consolidation range between 50k and 60k, then this constitutes a "redistribution" structure. Major players use this new range to continue distributing shares to retail investors attempting to "buy the dips."
- The extended timeframe: As Killa pointed out, a 170-day decline is far from sufficient. This complexity and redistribution structure are the main reasons for the prolonged bear market cycle. Major players need enough time to complete the transfer of shares.
8.3 Strategies for Retail Investors: Identify Traps and Maintain Patience
Faced with such a complex distribution and consolidation structure, how should retail investors respond? Killa's strategy provides the best answer:
- Avoid frequent trading within a range: Trying to capture every wave during the wide fluctuations of Phase B and Phase C is extremely dangerous. False breakouts and false breakdowns will frequently trigger stop-loss orders.
- Beware of breakout traps: When prices suddenly break upwards after a long period of consolidation (such as retesting the 74k level), do not blindly chase the price. You must wait for the price to effectively stabilize above the breakout level (forming support) to confirm a trend reversal. Otherwise, it is highly likely to be another instance of liquidity hunting (UTAD).
- Embrace Dollar-Cost Averaging (DCA): Since it's impossible to predict when a complex bottoming structure will end, the safest strategy is to do what Killa did: place orders in batches at key support levels (65k, 60k, 55k, 50k, 45k), using time to create space.
Chapter 9: A Supplementary Macro Perspective – Why Can Bitcoin Outperform Traditional Assets?
While Killa primarily emphasized Bitcoin's advantages in the video from a technical and cross-market perspective, to make this note more comprehensive, it's necessary to supplement it with some macroeconomic and fundamental arguments to support his ambitious prediction that "Bitcoin will reach 160k-180k in the next 3-4 years."
9.1 Fiat Currency Depreciation and its Anti-Inflationary Properties
Against the backdrop of high debt and persistent fiscal deficits in major global economies (especially the United States), the long-term depreciation of fiat currencies is an irreversible trend.
- Absolute scarcity: Bitcoin's hard cap of 21 million coins makes it the ultimate weapon against the over-issuance of fiat currency. Unlike fiat currencies that can be printed indefinitely, Bitcoin's supply is completely transparent and immutable.
- The Evolution of Value Storage: More and more institutional investors and high-net-worth individuals are beginning to regard Bitcoin as "digital gold." In an environment of high inflation expectations, funds will inevitably flow to hard assets that can preserve and increase their value.
9.2 The Accelerated Institutionalization Process and its Impact on Spot ETFs
The approval of a U.S. Bitcoin spot ETF in early 2024 was one of the most important milestones in cryptocurrency history. It completely changed the market structure of Bitcoin.
- The influx of compliant funds: ETFs provide a compliant and convenient investment channel for traditional pension funds, family offices, and wealth management institutions. The scale of these institutional funds is unmatched by retail investors.
- Long-term buying support: Unlike short-term speculation by retail investors, institutional funds typically have a longer investment horizon. Their continuous buying and holding of Bitcoin through ETFs provides solid underlying buying support for the market. Killa's predicted target of 160k Bitcoin largely depends on the continued inflow of these institutional funds over the next few years.
9.3 The hysteresis effect of the halving cycle
The Bitcoin network undergoes a "halving" approximately every four years, where the block reward received by miners is halved. This directly leads to a reduction in the new supply of Bitcoin.
- Supply and demand imbalance: When demand remains unchanged or increases, a decrease in new supply will inevitably lead to a price increase.
- Historical patterns are repeating themselves: Looking back at Bitcoin's history, a super bull market typically follows each halving within 12 to 18 months. Killa predicts the ultimate bottom will occur in late summer or early autumn of 2026 and recommends holding for 3-4 years, precisely to fully capture the huge profits brought by the halving cycle.
Chapter Ten: Summary and Reflection – Becoming One of the " Minority " Who Navigates Bull and Bear Markets
Although short, Killa's video is packed with information and trading wisdom. He not only provides clear price predictions, but more importantly, he demonstrates the mindset of a mature trader.
10.1 The Power of Independent Thinking
In the crypto market, the vast majority of people are slaves to their emotions. When prices rise, they are blindly optimistic, shouting "It will always rise"; when prices fall, they are extremely panicked, believing "It's about to go to zero".
Killa's value lies in his ability to sifte out emotional distractions and insist on using objective charts and logic for analysis. When the market was frenzied around 70k, he saw the risk of distribution and decisively short; when the market was about to face panic selling below 60k, he saw a reversal in the risk-reward ratio and began to build a position in the spot market in batches. This contrarian thinking of "being fearful when others are greedy, and greedy when others are fearful" is an essential quality for becoming a successful trader.
10.2 A Dual Test of Discipline and Patience
Killa's spot DCA strategy seems simple, but it is extremely difficult to implement.
- The discipline to endure unrealized losses: After buying at 65k and 60k, if the price actually drops to 50k or even 45k, the account will face huge unrealized losses. Most people would choose to cut their losses and leave the market during this agonizing period. Only those with iron discipline can strictly execute their predetermined order plan and remain unmoved by short-term fluctuations.
- The patience to wait for the flowers to bloom: A holding period of 3 to 4 years feels like an eternity to traders accustomed to the fast pace of the crypto market, where "a day feels like a year." But as Killa said, true wealth is earned through patience, not trading.
10.3 Conclusion: A Letter to My Future Self
This article is not only a summary of Killa's video content, but also a comprehensive review of our own trading system.
In the next 3 to 6 months, when we face severe market volatility, panic over a drop below 60k, and unrealized losses in our accounts, I hope we can revisit this article.
Let us remember Killa's warning: stay away from frequent trading, be wary of liquidity hunting, and don't let short-term declines destroy your faith.
Let us also remember Killa's vision: the profit-loss ratio has reversed, there is limited room for further decline, and the vast potential of the next 160k stars awaits those "minorities" who possess discipline and patience.
In this brutal game of wealth transfer in the cryptocurrency world, may we all be the ultimate winners.
Appendix: Summary of Core Data and Forecasts
To facilitate readers' review, we have compiled the key data and predictions from the Killa videos as follows:
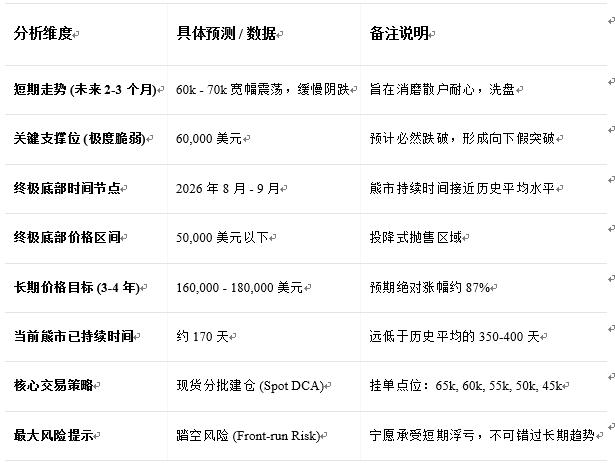
Disclaimer: This note is merely an objective summary and in-depth analysis of the original video content and does not constitute any financial or investment advice. The cryptocurrency market is highly volatile and risky; investors should conduct independent due diligence and make investment decisions based on their own risk tolerance.