

Crypto Expert: Ethereum's daily chart shows bottoming out, while the 4-hour chart indicates consolidation – a key entry point for both bulls and bears! Latest market analysis and strategy reference.
Ethereum is currently priced at 2045. Its recent price action, to put it simply, is a bottoming process on a larger timeframe and oscillation on a smaller timeframe, leaving retail investors confused. Looking at the daily chart, it has just climbed from the low of 1736 and hasn't fully shaken off the lingering effects of the bear market; on the 4-hour chart, it's been fluctuating between 2000 and 2100, failing to gain a clear advantage in either direction. Many people are debating whether to buy the dips or short, but the key is whether the crucial support and resistance levels can hold. Today, I'll use two charts to explain the market logic and entry points clearly, making it easy for beginners to understand.
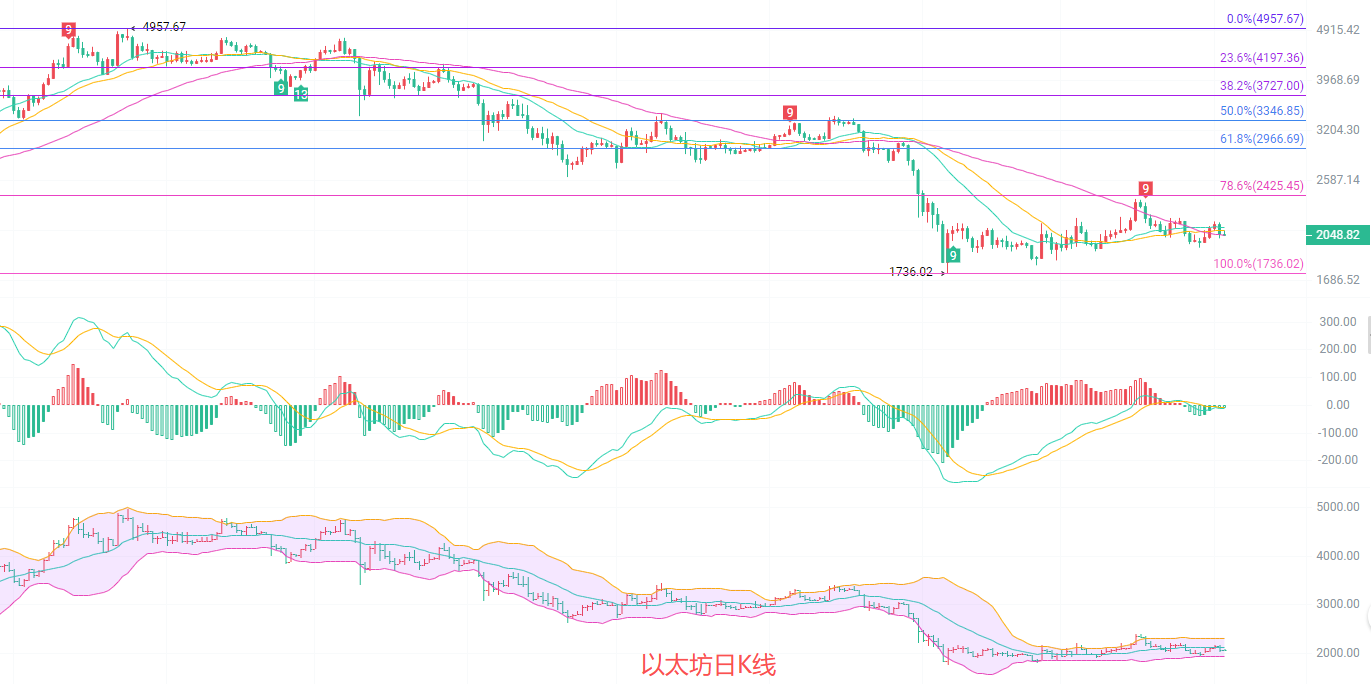
The daily chart shows the price currently in a bottoming-out consolidation phase. In terms of moving averages, the 20-day and 30-day moving averages (MA20 and MA30) are still providing resistance above the price, while the 60-day moving average (MA60) coincides with the current price, acting as a dividing line between upward and downward movement. The MACD indicator shows a continuous shortening of the green bars, with the DIF and DEA lines gradually converging, indicating weakening downward momentum and a potential golden cross, suggesting that the downward momentum has largely dissipated. The Bollinger Band middle line at 2117 represents strong resistance, while the lower band at 1923 provides strong support. The price is currently trading in the lower half of the Bollinger Bands, indicating a bottoming-out phase, awaiting a breakout with increased volume to open up upward potential.
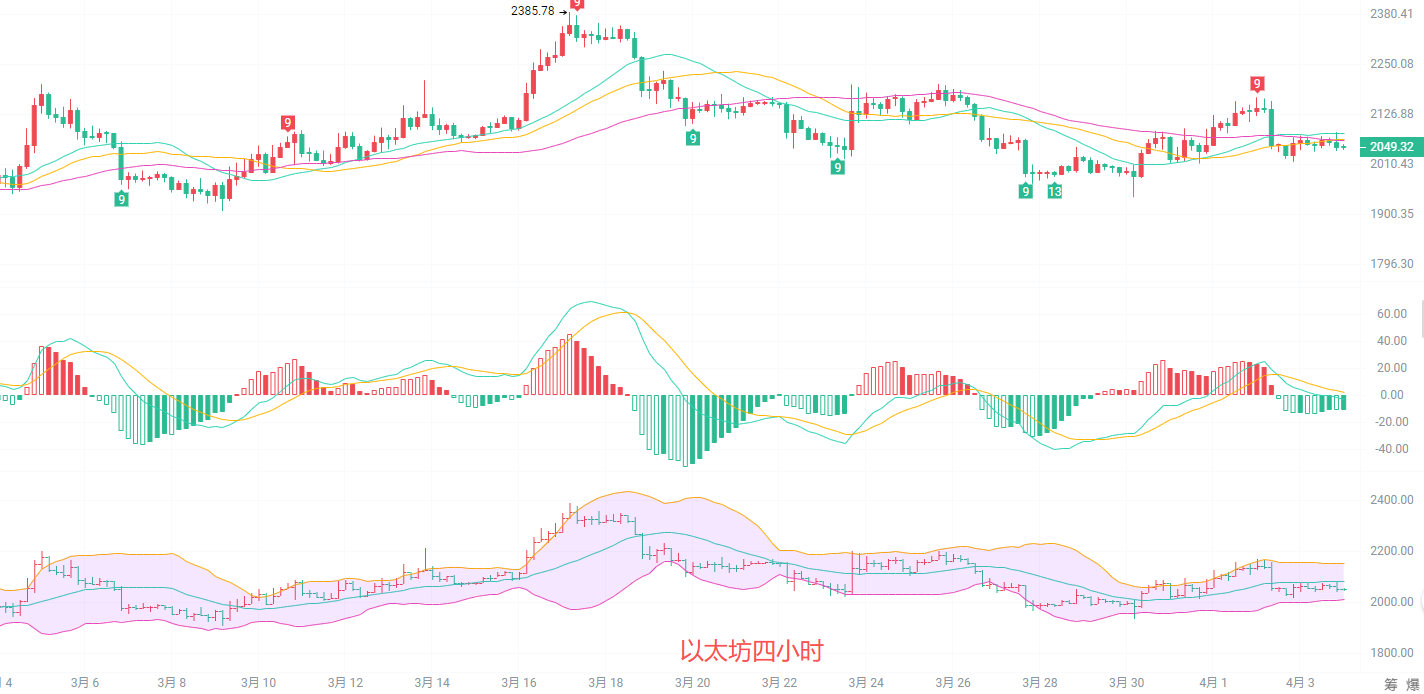
The 4-hour chart shows a narrow, weak trading range. The moving average system has converged and is trending downwards; the 20-day, 30-day, and 60-day moving averages are all above the price, suppressing any rebound and indicating a lack of upward momentum in the short term. The MACD indicator shows a slight increase in the green bars, suggesting strengthening downward momentum and a potential test of support levels. The Bollinger Band middle line at 2081 is the resistance level, and the lower band at 2010 is the support level. With the price trading between the middle and lower Bollinger Bands, a directional move is imminent, and a breakout from this range should be closely monitored.
Short-term reference: (Real-world data has been updated; please contact the author for details)
The downside target is 2010-2020, with a stop loss at 1980 and a target of 2080-2120.
The upside target is 2080-2100, with a stop-loss at 2130 and a target of 2020-2000.
For specific operations, please refer to real-time market data. For more information and details, please contact the author. There may be a delay in article publication; this advice is for reference only, and you assume all risk.

