Last week, Bitcoin continued its range-bound trading pattern, which was highly consistent with our previous predictions.
This week, we will focus on two main themes: First, the fourth wave correction of HYPE is nearing completion in both time and space, the bottom formation on the daily chart continues to strengthen, and the quantitative model has also triggered a bottom warning. This week, we will focus on long. Second, the medium-term downtrend of Bitcoin remains unchanged. This week, we will maintain our judgment of range-bound trading and flexibly implement two short-term trading plans, A and B, based on support and resistance levels and model signals.
Summary of key trading insights this week:
• HYPE multi-period trend structure analysis. (See Part 1 for details)
• HYPE Market Forecast and Short-Term Trading Strategy for This Week. (See Part Two for details)
• Analysis of BTC's multi-timeframe price movement structure. (See Part 3 for details)
• BTC Market Forecast for This Week and Medium- to Short-Term Trading Strategies. (See Parts Four and Five for details)
Last week's key viewpoints were validated by the market:
• BTC Short-Term Trading Results: Bitcoin completed a short-term short position (1x leverage) last week, successfully realizing a profit of approximately 2.45%. (See Table 1 for details)
• BTC Mid-Term Trading Performance Verification: Bitcoin followed the established mid-term strategy last week, continuing to hold the short position established at $89,000 (1x leverage). By the close of last week (approximately $69,031), the profit was approximately 22.43%, with a maximum profit of approximately 32.58% during the period.
• BTC Price Movement Prediction Verified: In last week's article, we pointed out that the market would maintain a range-bound trading pattern . Current market movements have validated our previous prediction.
I. HYPE: Trend Structure Analysis
1. HYPE Daily Chart Trend Structure Analysis: (Based on market evolution after January 21st)
HYPE_ Daily Candlestick Chart
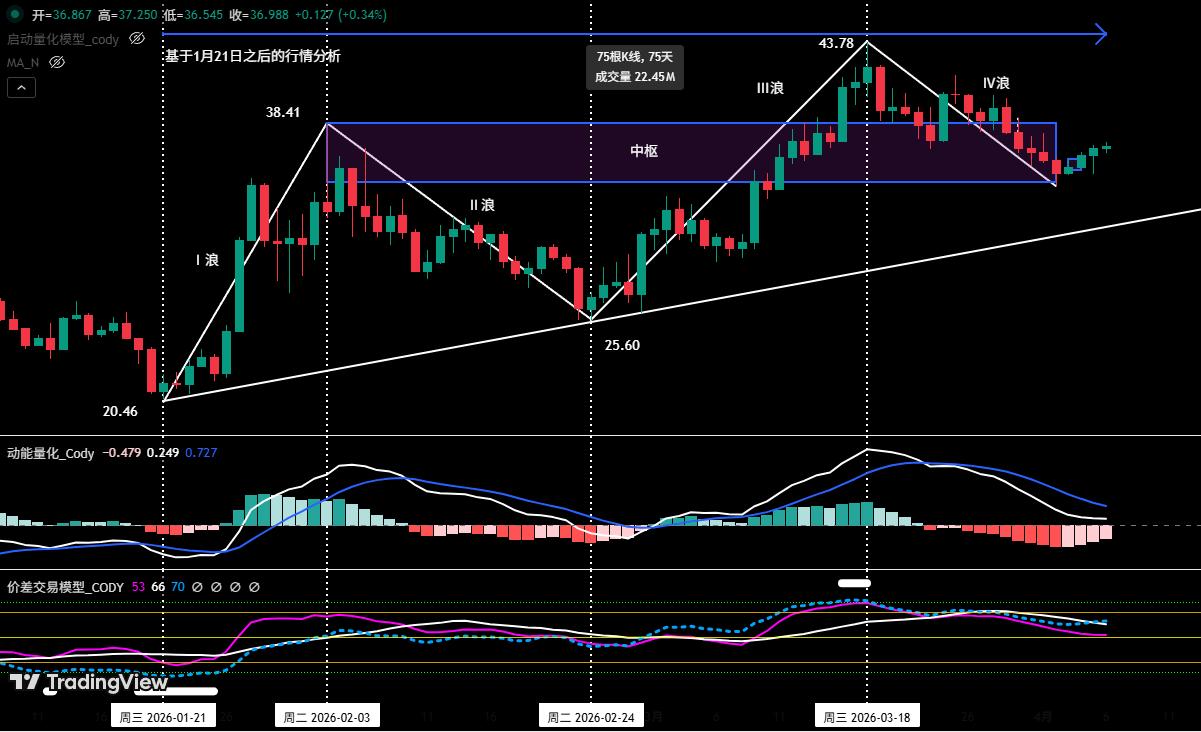
Figure 1
As shown in Figure 1:
• Wave I (Drive Wave): From the low of $20.46 on January 21 to the high of $38.41 on February 3, it lasted 14 days, with a maximum increase of 87.73%.
• Wave II (Corrective Wave): From the high of $38.41 on February 3 to the low of $25.60 on February 24, lasting 20 days, with a maximum drop of 33.35%.
• Wave III (Main Upward Wave): From the low of $25.60 on February 24 to the high of $43.78 on March 18, it lasted 23 days, with a maximum increase of 71.02%.
• Wave IV (Corrective Wave): It has been running for 18 days since the high of $43.78 on March 18, with a maximum drop of 21.33% during this period.
2. In-depth analysis of the current trend structure of HYPE (using a 4-hour analysis period)
HYPE_4-hour candlestick chart
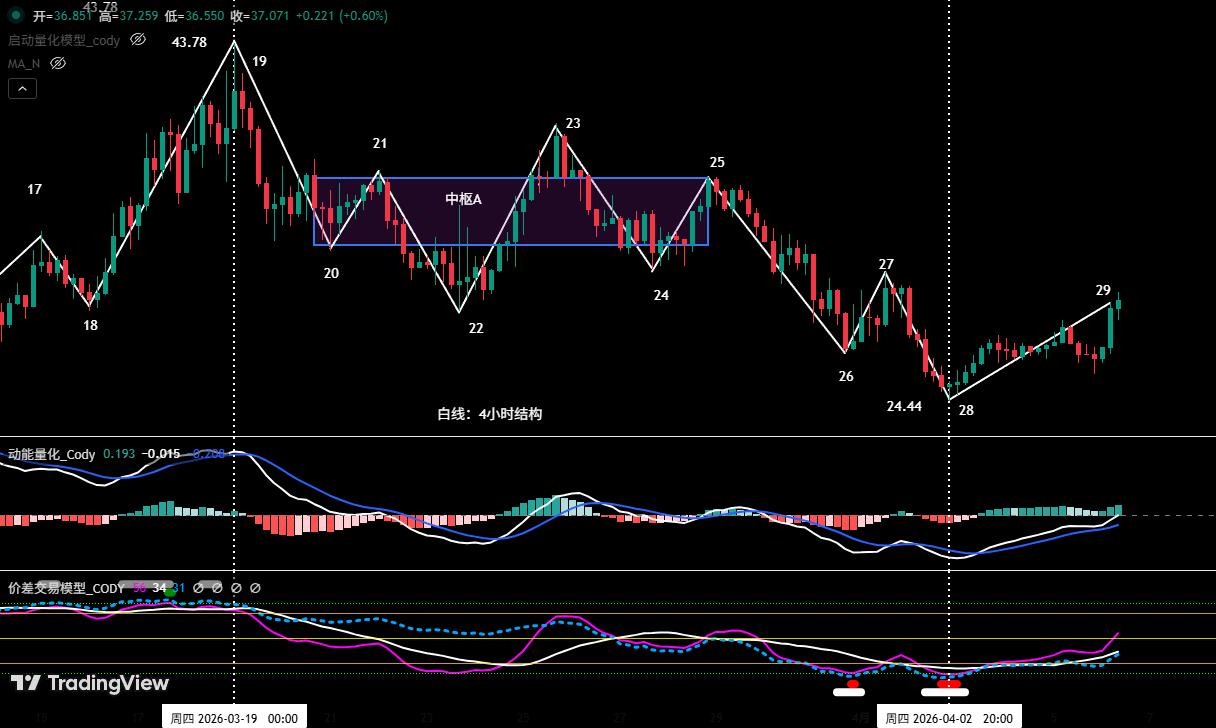
Figure 2
• This is based on the wave IV correction that occurred after the high of $43.78 on March 18.
• As shown in Figure 2, wave IV can be subdivided into a complex adjustment structure consisting of 9 segments from endpoint 19 to endpoint 28: 19-20, 20-21, 21-22, 22-23, 23-24, 24-25, 25-26, 26-27, and 27-28.
• Central Pivot A: In the 5-segment structure of 20-21, 21-22, 22-23, 23-24, and 24-25, they overlap with each other to form a downward central pivot (i.e., central pivot A).
• The market is currently in the 28-29 segment. The chart shows a key momentum divergence signal: the downward momentum is weakening between the entry segment (19-20) and the exit segment (25-26), and between the 25-26 and 27-28 segments. This suggests that the IV wave correction has very likely ended near the endpoint of 28.
• According to our self-built spread trading model , bottom warning signals were triggered at endpoint 26 and endpoint 28 respectively (red dots and white dots in the figure).
II. HYPE: Market Forecast and Short-Term Trading Strategy for This Week
1. HYPE Market Trend Forecast for This Week:
• From a daily chart perspective, the fourth wave correction that started from the high of $43.78 on March 18 has lasted for 19 days. Considering that the previous second wave correction lasted for about 20 days, this correction may be nearing its end.
• Based on the 4-hour cycle analysis, there is a high probability that the wave IV correction will end near the endpoint 28.
• This Week's Market Forecast : From a technical analysis perspective, the fourth wave correction in HYPE has largely reached its target in terms of both time and price. Furthermore, the daily "bottom reversal" pattern formed by the April 1st low is strengthening, coupled with bottom warning signals triggered by quantitative models. Therefore, this week we will focus on signals indicating the end of the HYPE correction and identifying entry opportunities.
2. HYPE's short-term trading strategy for this week:
Based on the prediction of an overall upward trend, the strategy should be to "follow the trend and buy on long" .
• Based on signals from our self-developed quantitative model, we use a 30-minute/60-minute trading cycle and a 30% position to capture opportunities to go long.
• Entry Strategy: The market is currently trending upwards with fluctuations. If the price can break through the key resistance of $38 this week and retrace to confirm and hold above the support of $34.47 (the lower end of April 2nd) (the further the retracement is from that low, the better), it may constitute a relatively certain right-side buying opportunity.
3. HYPE Upside Risk Warning: While HYPE's price movement is somewhat independent, it cannot be completely separated from the broader Bitcoin environment. If Bitcoin experiences a significant correction, it may affect HYPE's rebound momentum.
III. Bitcoin: Price Structure Analysis
1. BTC Daily Chart Structure Analysis: (Based on market developments since February 6th)
• The upward trend in Bitcoin since the low of approximately $60,000 on February 6th can still be defined, in terms of wave structure, as a C-2 wave oversold rebound within a larger C-wave correction. If the subsequent rebound fails to break through the $76,000 level of March 17th, there is a high probability of a subsequent C-3 wave decline.
• Key observation points regarding structural evolution:
The current rebound cycle is extending, and we need to pay attention to whether the subsequent rebound can break through the high point of March 17. If it successfully breaks through, this round of rebound may upgrade to a more complex D-wave rebound (equivalent to the C-wave), which may be followed by an E-wave correction.
• Key conditions for trend confirmation:
The key signal to definitively determine the start of the C-3 wave (or E wave) correction is a decisive break below the previous low of approximately $60,000 on February 6th. Prior to this, the market remains in a phase of oscillation between a rebound and a trend reversal.
2. In-depth analysis of the current price structure of BTC: (based on a 4-hour analysis period)
Bitcoin 4-hour candlestick chart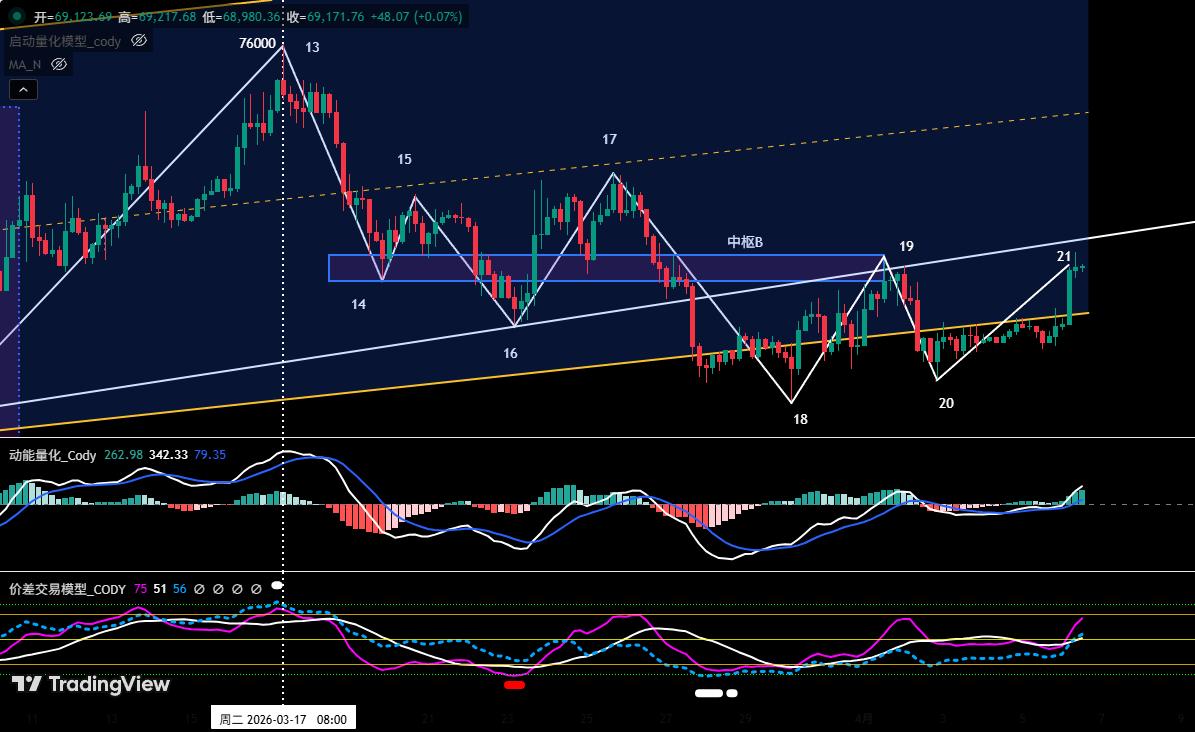
Figure 3
• Based on the market evolution since the high point on March 17 (approximately $76,000).
• As shown in Figure 3, BTC has been retracing since its high on March 17. The structure consists of 8 segments from endpoint 13 to endpoint 21.
• Central Pivot B: The downward central pivot consists of 6 segments: 14-15, 15-16, 16-17, 17-18, 18-19, and 19-20, and it continues to extend to the left.
• Currently, it is running in segment 20-21, and the price has touched the upper rail of the central range near $69,300.
IV. Bitcoin: This Week's Market Forecast and Short-Term Trading Strategies
1. BTC price trend prediction for this week:
• This week's key takeaway: The price is expected to remain range-bound between $65,000 and $69,500. A decisive break above the $69,500 resistance level could lead to a wider trading range of $65,000 to $72,000. Conversely, a break below the $65,000 support level could target the $60,000 to $62,500 support zone.
• This week is approaching a sensitive period for news, so it is advisable to remain on the sidelines and observe.
3. Core pressure level:
• First resistance zone: $69,500–$72,000 (previous trading range)
• Second resistance zone: $74,500–$76,000 area (near the November 2025 low)
4. Core support level:
• First support level: $65,000–$66,000 area (previous important support area)
• Second support level: $60,000–$62,500 area (near the low of February 6)
• Third support level: around $57,400
5. Trading strategy for this week (excluding the impact of unexpected news): (April 6th - April 12th)
① Medium-term strategy:
Bitcoin Daily Candlestick Chart: (Position Monitoring Model)
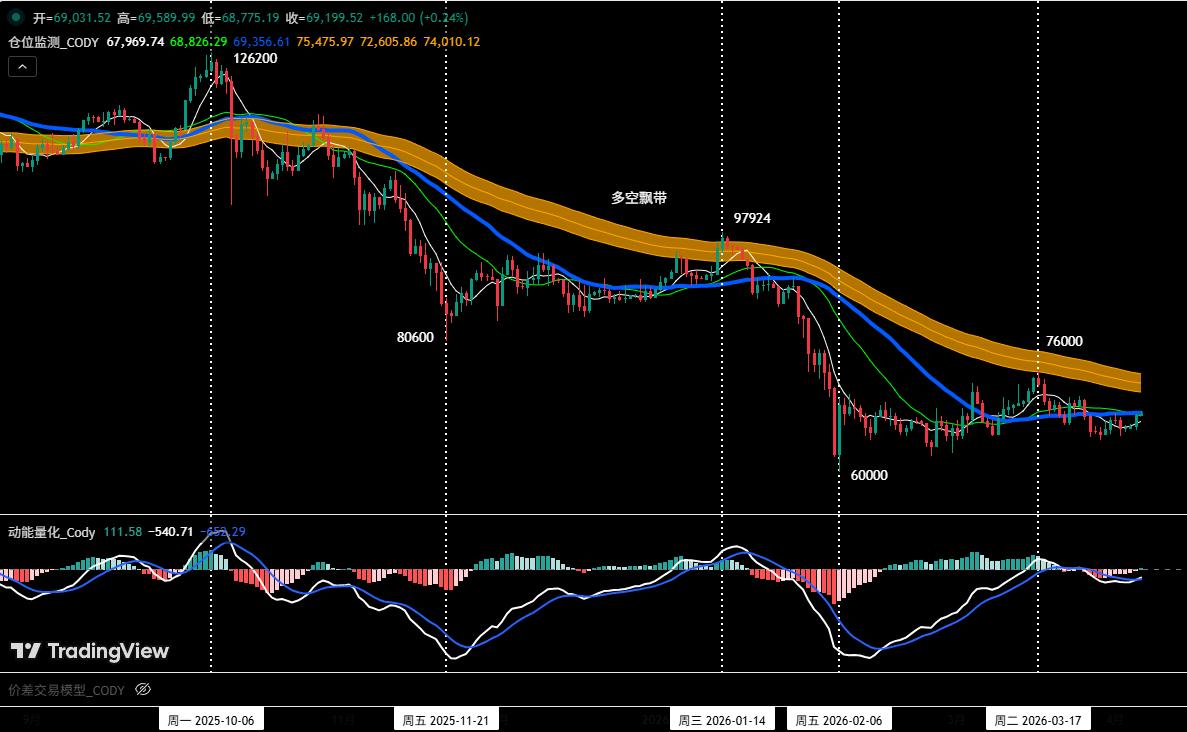
Figure 4
Position Monitoring Model: As shown in Figure 4, the current price is below the bullish/bearish band (yellow), indicating a continuation of the downtrend. Based on our strategy rules, we will continue to hold the 60% short position established at $89,000 (January 28th).
• If the price rebounds and breaks through the support/resistance level and holds above it, clear all medium-term positions to zero.
② Short-term strategy: Use 30% of your position, set a stop-loss point, and look for opportunities to profit from price differences based on support and resistance levels. (Use 30-minute/60-minute charts as the trading timeframe).
③ Based on the anticipated medium-term downtrend in the market, the current operational principle should be " short with the trend ." To dynamically respond to complex market evolutions and incorporate signals from our self-built trading model, we will formulate two short-term trading plans, A and B:
• Option A : If the rebound encounters resistance, sell short on rallies .
• Opening a position: When the price rebounds to the $69,500-$72,000 range and triggers a resistance signal, combined with the top signal of the model, a 15% short position can be established.
• Add to short position: When the price continues to rebound to the $74,500-$76,000 area and triggers a resistance signal, combined with the top signal of the model, you can increase your short position by 15%.
• Risk control: The initial stop-loss for both short positions was set above $76,500.
• Closing positions: When the price of the coin falls to the vicinity of an important support level and combined with model signals, you can gradually close your positions and take profits.
• Option B: Short position following the breakout .
• Opening a position: When the price of the coin effectively breaks below the support level near $65,000, and combined with the top signal of the model, a 30% short position can be established.
• Risk control: The initial stop loss for short positions is set above $67,000.
• Closing positions: When the price falls to the support level and the model signals are combined, positions can be gradually liquidated to realize profits.
V. Bitcoin: A Review of Last Week's Trading
1. Review of short-term trading: (See Table 1)
We strictly followed the operational plan and, based on the trading signals generated by our self-developed spread trading model and momentum model, completed a short-term (short) operation last week, with a profit of 2.45%.
① Summary of Bitcoin short-term trading details: (leverage * 1x)
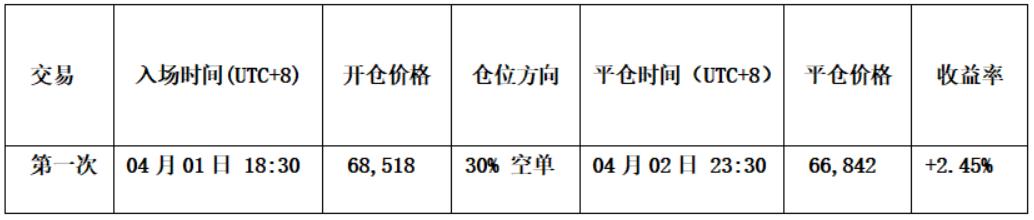
Table 1
② Short-term trading review: (See Figure 5)
• Opening a position: When the price rebounded to around $72,000 and encountered resistance, the spread trading model simultaneously triggered a top warning signal (white dot), and resonated with the momentum quantification model to form a short-selling resonance. Therefore, we established a 30% short position at $68,518.
• Closing positions: When the price of the coin stabilized near $65,000, and the spread trading model triggered a strong bottom warning signal (red dot + white dot), we closed all positions near $66,842.
• Summary: This transaction resulted in a profit of approximately 2.45%.
Bitcoin 30-minute candlestick chart: (Momentum-based model + Spread trading model)
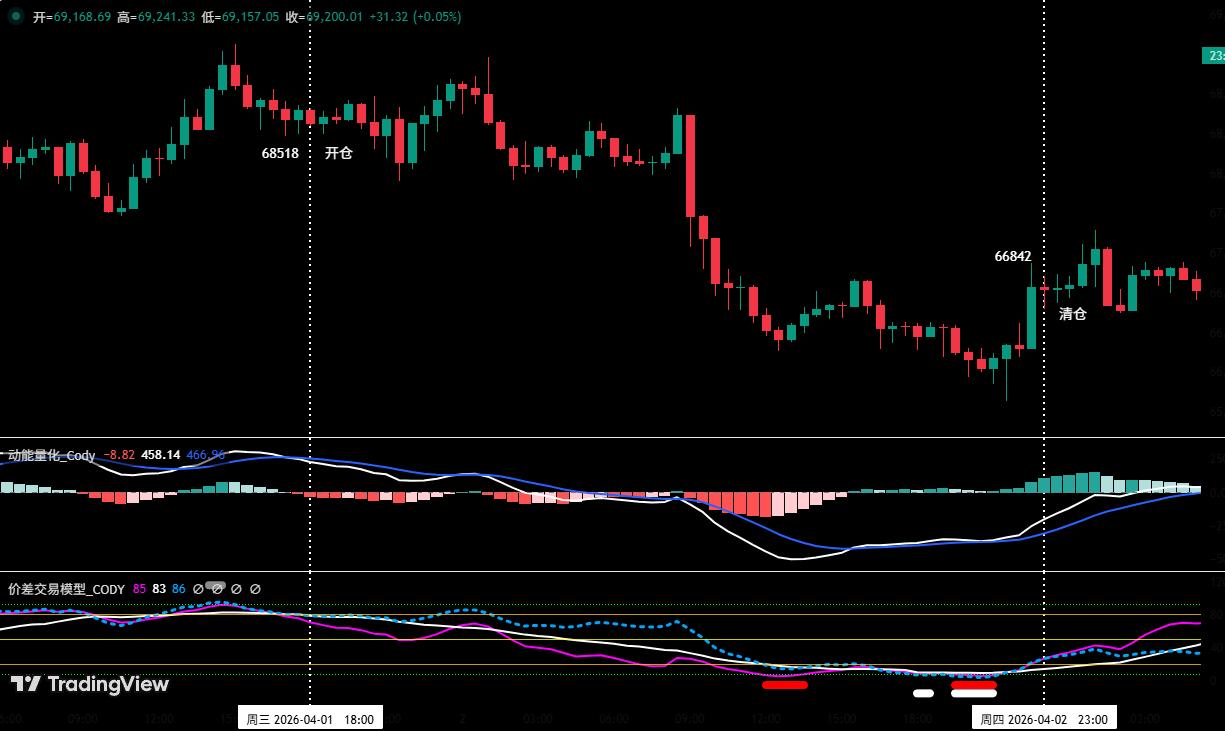
Figure 5 (Short-term trading illustration)
2. Review of Mid-Term Operations:
Medium-term strategy: Continue to hold the 60% short position established around $89,000 (January 28), which has yielded a profit of approximately 22.43% by the close of last week (closing price of approximately $69,031).
VI. Special Notes
1. When opening a position: immediately set the initial stop-loss level.
2. When the profit reaches 1%, move the stop loss to the opening cost price (break-even point) to ensure the safety of the principal.
3. When the profit reaches 2%, move the stop loss to the position where the profit is 1%.
4. Continuous monitoring: For every additional 1% profit in the coin price thereafter, the stop loss level will be moved by 1% accordingly, dynamically protecting and locking the loss.
Financial markets are constantly changing, and all market analysis and trading strategies must be dynamically adjusted. All views, analytical models, and operational strategies presented in this article are derived from personal technical analysis and are for personal trading journal use only. They do not constitute any investment advice or basis for action. The market is risky; invest with caution. Please do not make decisions based on this information.