The ceasefire announcement caused short sellers to lose $350 million, but weekly and monthly charts won't immediately turn bullish because of a single tweet.
Written by: Sanqing, Foresight News
On the morning of April 8th, Beijing time, US President Trump announced on Truth Social Media that he had agreed to suspend bombing operations against Iran for two weeks, on the condition that Iran "fully, immediately, and safely open" the Strait of Hormuz. Iranian Foreign Minister Araqchi subsequently issued a statement announcing that if the US ceased its attacks, the Iranian armed forces would cease defensive operations and coordinate the reopening of the strait within two weeks.
The statement came just 90 minutes before the previously set 8 p.m. deadline, and hours earlier he had warned that "the entire civilization will die tonight."
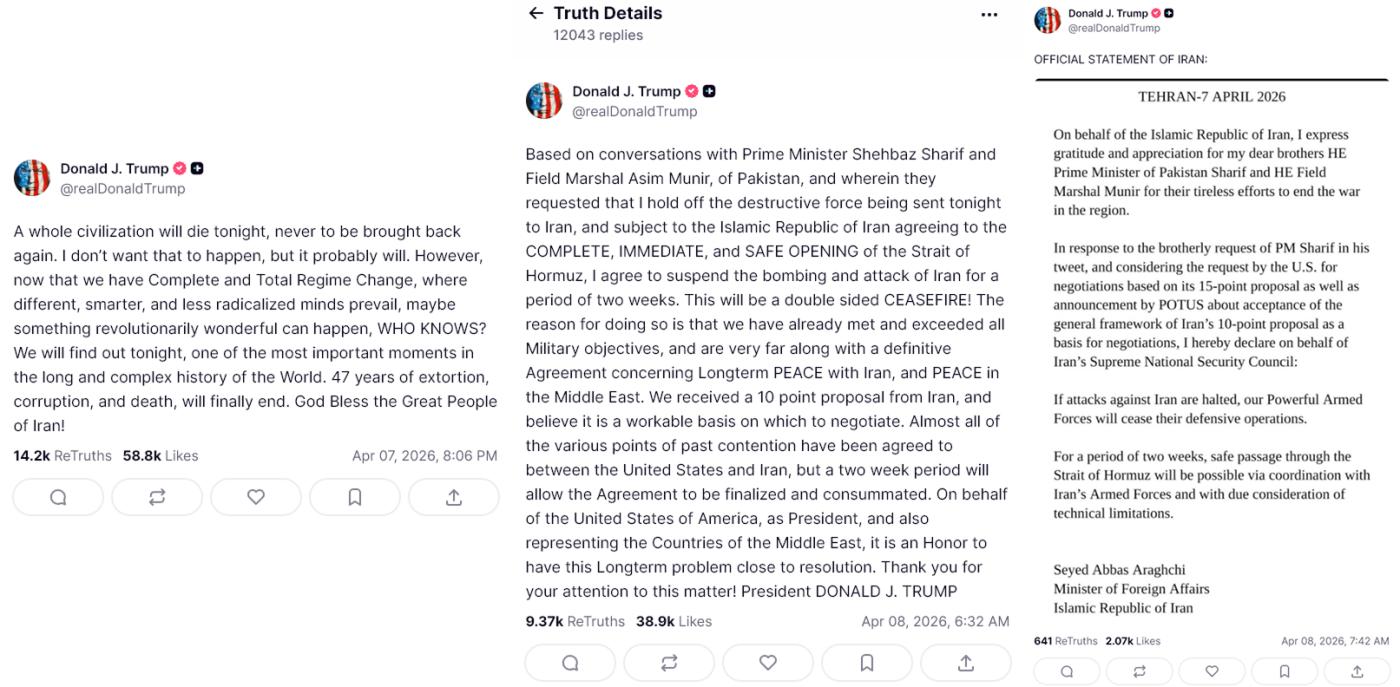
Image source: Truth Social
The market reacted sharply. WTI crude oil plunged from an intraday high of $117.63 to around $96, a drop of over 9% in half an hour. S&P 500 futures surged over 1.6% in overnight trading, Nasdaq futures rose 1.8%, and Dow futures jumped 725 points. BTC reached a high of $72,772 in the past 24 hours, closing at approximately $71,924 on the daily chart, a daily gain of about 4.47%. CoinAnk data shows that $495 million in contract liquidations occurred across the network in the past 24 hours, with short positions accounting for $346 million, indicating a concentrated liquidation of short positions.
A ceasefire is not peace, and the market is trading in a way that "it can't get any worse."
This is the clearest sign of de-escalation in the Middle East conflict in six weeks, but it is too early to define it as peace.
Pakistani Prime Minister Sharif facilitated this breakthrough, and the two sides are expected to hold face-to-face talks in Islamabad this Friday. However, Iran deliberately left room for ambiguity in its statement, agreeing to coordinate passage through the Strait "provided technical conditions permit," without committing to an unconditional and full opening. While Israel has agreed to a ceasefire, it launched attacks on Iranian railways and bridges just hours earlier.
Market pricing does not signify a peaceful arrival, but merely a temporary avert of the worst-case scenario.
The collapse in oil prices is the most direct evidence. WTI crude oil fell from a wartime high of $117 to around $96, breaking below the psychological barrier of $100, but still remaining well above pre-war levels. This means traders believe the Strait of Hormuz is likely to partially reopen to navigation, but full recovery will still take several months. While traders believe the Strait of Hormuz is likely to partially reopen, the U.S. Energy Information Administration (EIA) warns that Middle Eastern oil production will not approach pre-conflict levels until the end of the year.
The logic behind the collective rebound in risky assets is consistent with this: tail risks have subsided, but fundamental constraints remain.
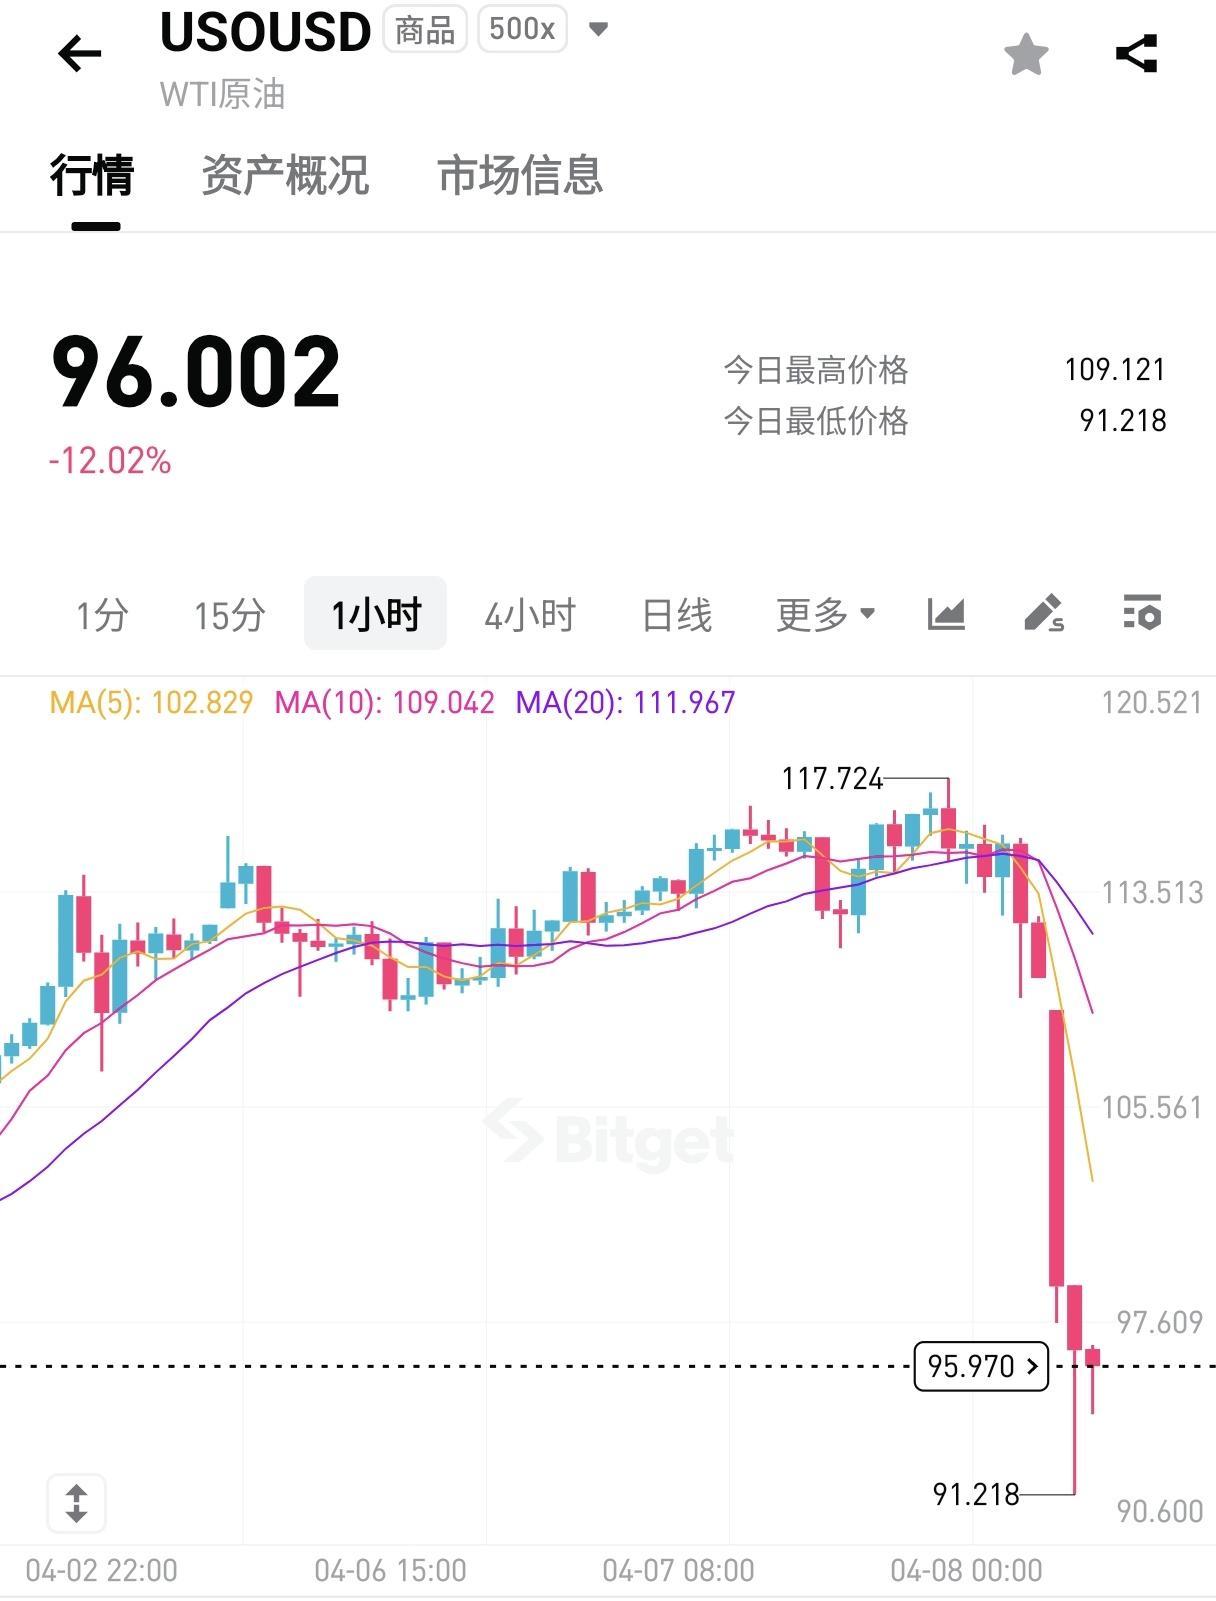
WTI Crude Oil Intraday Chart | Source: Bitget TradeFi
Morgan Stanley's entry into the market marks a turning point in ETF funding.
On April 8th, Eastern Time, the Morgan Stanley Spot Bitcoin ETF (MSBT) is expected to officially list and trade on the NYSE Arca, marking the first spot BTC ETF issued by a major US bank. The product has an annual fee of only 0.14%, lower than BlackRock's IBIT at 0.25% and Grayscale's GBTC at 0.15%, making it the Bitcoin ETF with the lowest fees currently on the market.
The launch of MSBT coincided with a rebound in risk appetite triggered by the ceasefire news. Prior to this, on April 6, the US spot BTC ETF saw a net inflow of $471 million, the largest single-day inflow since February 2, with BlackRock contributing $181 million and Fidelity contributing $147 million.
However, the actual impact of Morgan Stanley ETFs may be limited. IBIT, on the other hand, has seen cumulative net inflows exceeding $63 billion, indicating a largely established investor landscape. In the past five months, ETFs have experienced net outflows exceeding $5 billion. Whether fee competition can translate into incremental funds depends on whether a true ceasefire can be implemented.
The Fear & Greed Index has rebounded from 17 (extreme fear) last month to 47 (neutral) today, compared to 32 (fear) last week. Sentiment is rapidly moving away from the bottom, and the market is no longer panicking.
The daily chart broke through the upper Bollinger Band, but it remains below the mid-to-long-term moving average.
Since early February, BTC has been consolidating within a range of $65,000 to $73,000. The daily Bollinger Bands show the price has broken above the upper band, and the RSI has risen to 59.86, indicating a short-term bullish trend. However, on the weekly chart, the price remains well below the 20-week moving average, with the weekly RSI at only 39.70, suggesting a weak medium-term trend. The monthly chart also shows downward pressure, with the current price more than 25% below the moving average.
The daily chart broke through the upper Bollinger Band while the weekly and monthly charts remained below the middle Bollinger Band. This divergence across multiple timeframes indicates strong short-term momentum, but whether it can extend to longer timeframes depends on subsequent trading volume and fundamental factors.
ETH performed relatively stronger, with a monthly gain of about 7%, a daily RSI of 61.61, and the price breaking through the upper Bollinger Band. The ETH/BTC exchange rate rebounded, and its short-term momentum was even better than BTC. However, the weekly RSI was only 41.66, still more than 10% away from the weekly moving average.
On-chain data is sending conflicting signals. A previous Glassnode report indicated that spot CVD had turned positive, with selling pressure at a loss significantly reduced. However, the apparent on-chain demand on the 30th remained at -63,000 BTC, and whale(holding 1,000-10,000 BTC) shifted from a net increase of 200,000 BTC a year ago to a net decrease of 188,000 BTC, marking one of the most aggressive distribution cycles on record.
Institutional investors are absorbing the selling pressure, but retail investors and medium-to-large holders are still retreating. This structure determines the ceiling for any rebound.
The two-week window determines more than just oil prices.
The ceasefire announcement provided the market with a very brief respite. The outcome of the Islamabad talks this Friday, the speed at which actual navigation in the Strait of Hormuz resumes, and the upcoming release of the US March CPI data (Friday at 20:30, market expectations are for an increase from 2.4% to 3.4%) will collectively determine whether this rebound can evolve from a technical correction into a trend reversal.
If negotiations break down within two weeks, oil prices return to above $110, inflation expectations surge again, and the window for a Fed rate cut closes further, then the risk of BTC breaking below the lower edge of its trading range and sliding towards $58,330 (61.8% Fibonacci retracement level) will increase dramatically.
Conversely, if the strait truly resumes navigation and oil prices fall below $90, coupled with the incremental narrative brought by the Morgan Stanley ETF, $75,000 will be the first hurdle that the bulls must overcome.

BTC & ETH Breakout Probability Chart | Source: Polymarket