Author: Benji Siem @BenjiSiem, IOSG Ventures
Thanks to Kai Siefert (@KaiSiefert) and Yiping for his feedback and help with this article!
Introduction
I began this research with a simple observation: the electricity system is being asked to do something it was never designed for. As renewable penetration accelerates, electrification expands, and AI-driven data center demand surges, the traditional model of building more generation and transmission to meet peak load is breaking down. Infrastructure timelines are too slow, interconnection queues are too long, and capital intensity is too high.
In this context, flexibility, defined as the ability to dynamically adjust demand and supply in real time, has shifted from a supporting function to a core pillar of grid reliability. What once relied primarily on large industrial loads and peaker plants is now evolving into a complex, multi-layered marketplace where distributed energy resources, software platforms, and aggregators coordinate millions of assets to balance the system. I believe we are at a structural inflection point.
The winners in this transition will not be those who control generation, but those who build the connective and orchestration layers that unlock flexibility at scale. Emerging crypto-native coordination models and token-based incentive systems may further accelerate this shift by enabling decentralized participation, transparent settlement, and global liquidity for flexibility services. As I explore throughout this paper, flexibility is no longer just a technical capability; it is an emerging economic infrastructure where revenue stacking across capacity, ancillary, demand response, and local markets is creating new value pools and reshaping how energy is traded, managed, and monetized.
Thesis
- The electricity flexibility market is at an inflection point. Rising renewable penetration, data center demand growth, and regulatory mandates are creating a structural supply-demand imbalance for grid flexibility services. The demand for electricity to power large AI and app developments rapidly exceeds the amount of available electricity in the grid to support it. This is driven by:Increase in global data centre electricity consumption, which is set to more than double to around 945 TWh by 2030. This is slightly more than Japan’s total electricity consumption today. AI is the most important driver of this growth, alongside growing demand for other digital services. Similarly, the lack of flexibility could also be a limiting factor for the growth of AI
- The electricity market requires operational efficiency and flexibility to mitigate risks, as infrastructure lags behind and construction is built. This increases the demand and necessity of these services.Electricity grids are already under strain in many places: it is estimated that unless these capacity risks are addressed, around 20% of planned data centre projects could be at risk of delays. Power generation projects in the US that are currently delayed because grid operators struggle with grid congestions (a queue of ~10,300). Thats 2,300 GW or or twice the entire existing generation capacity of the US.
- The middle layer of aggregation and connection infrastructure will be the biggest winners in the space, as it bridges essential infrastructure between supply (consumers with spare unused capacity) and demand (strained grid operators)Software-centric platforms that aggregate and optimize distributed energy resources (DERs) will capture disproportionate value as the market scales from ~$98.2 billion (2025) to approximately ~$293.6 billion (2034), expanding at a CAGR of 12.94% from 2025 to 2034.
Flexibility Market Overview
What is flexibility in energy markets?
In power systems, flexibility = the ability of the system to quickly adjust generation and/or demand in response to signals (price, grid congestion, frequency, etc.) to keep supply and demand balanced and avoid blackouts
Historically, this came almost entirely from flexible generators (gas peakers, hydro). As renewables and electrification scale, system operators now also buy flexibility from:
- Demand response: loads that can turn down or shift in time
- Storage: batteries, EVs, thermal storage
- Distributed generation: rooftop solar, small CHP, etc.
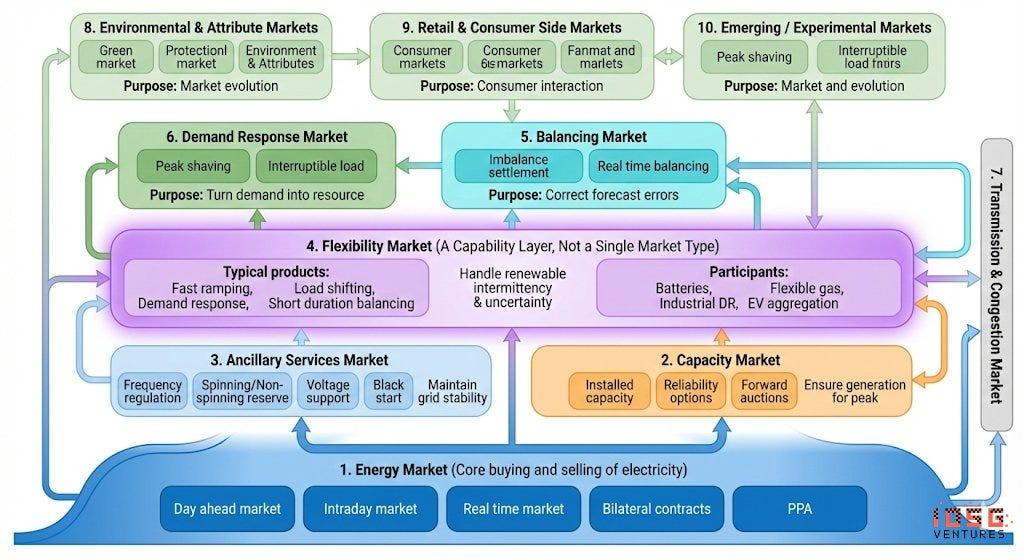
The “flexibility market” is the set of marketplaces and contracts where this flexibility is bought and sold: wholesale markets, balancing/ancillary service products, capacity markets, and local Distribution System Operators (DSO) flexibility platforms. Aggregators work together as middlemen to provide platforms that allows grid operators to buy flexibility from end customers, creating a meaningful infrastructure layer (see “How Flexibility Is Traded & Priced” section). The settlement is handled by Transmission System Operators (TSOs), who pay out the aggregator and, then, the aggregators pays the customer after taking its cut.
This flexibility can be delivered in two ways:
- Implicit flexibility happens automatically through static price signals, like time-of-use tariffs. E.g. your smart EV charger delays charging until overnight when electricity is cheaper. The price signal drives the behaviour.
- Explicit flexibility involves deliberate actions in response to specific requests from the grid operator. These actions are consciously taken and directly compensated — normally through markets coordinated via a market platform.
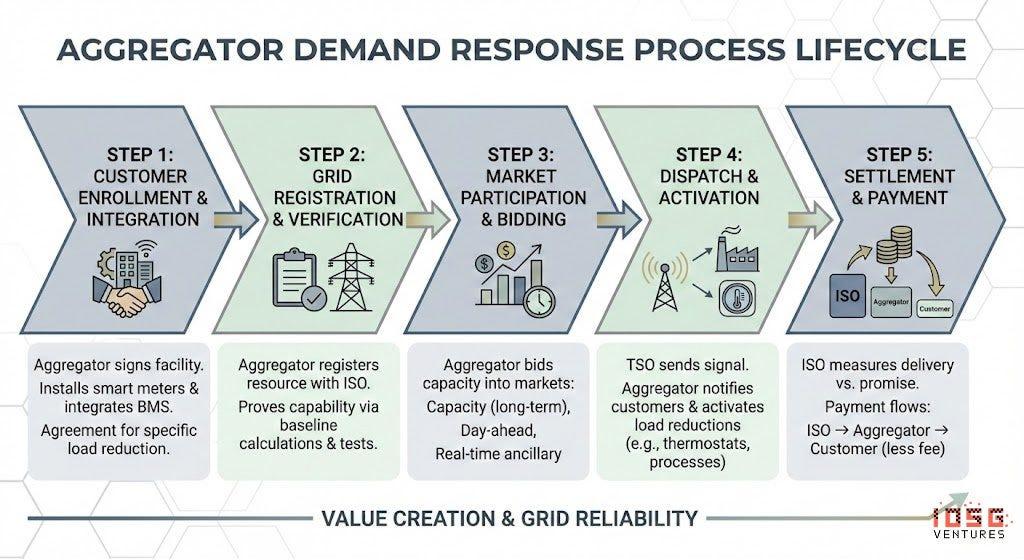
Detailed Example:
Step 1: Customer Enrollment
An aggregator like CPower signs up a manufacturing facility. They install monitoring equipment (smart meters, controllers) and integrate with the facility’s building management system. The customer agrees to reduce load by, say, 2 MW when called upon.
Step 2: Registration with Grid Operator
The aggregator registers this 2 MW (along with thousands of other sites) as a “demand response resource” with the ISO. The aggregator must prove the resource can actually deliver. This involves baseline calculations, metering protocols, and sometimes test dispatches.
Step 3: Market Participation
The aggregator bids the aggregated capacity into various markets:
- Capacity markets (annual/multi-year): “I commit to having 500 MW available during summer peaks”
- Day-ahead energy markets: “I can reduce load by 200 MW tomorrow between 4–8pm”
- Real-time ancillary services: “I can respond within 10 minutes to frequency deviations”
Step 4: Dispatch
When the grid needs flexibility, the TSO sends a signal to the aggregator. The aggregator’s software platform then:
- Sends notifications to enrolled customers (text, email, automated control signals)
- Activates pre-programmed load reductions (e.g., raising thermostat setpoints, dimming lights, pausing industrial processes)
- Monitors performance in real-time
Step 5: Settlement
After the event:
- The ISO measures what was actually delivered vs. what was promised
- Payment flows: ISO → Aggregator → Customer (minus aggregator’s cut)
Key Players
1. Exchanges — Market Platforms
- Where flexibility is traded: These platforms match buyers (DSOs/TSOs) with sellers (aggregators, DER owners). Fast Frequency Reserves Markets also provide another platform for trade.
- Examples: EPEX SPOT, Nord Pool, Piclo Flex, NODES, GOPACS, Enera
Business Model:
- Transaction fees on cleared trades (typically 0.5–2% of transaction value or €0.01–0.05/MWh)
- Subscription/membership fees for market access (annual platform fees for participants)
- Some platforms operate as regulated utilities (cost recovery through grid tariffs) while others are commercial ventures
Pricing:
- Platforms don’t set prices, they facilitate price discovery through auctions (pay-as-bid or pay-as-clear)
- Local flexibility platforms (Piclo, NODES) typically see prices of €50–200/MWh for congestion management
- Wholesale balancing markets can spike to €1,000+/MWh during scarcity eventsPrices at classic wholesale markets (e.g. EPEX) can go negative, which has the same effect like actively acquiring flexibility at a dedicated flexmarket.
2. Aggregators / Virtual Power Plants (VPPs)
- Control fleets of flexible assets. Their revenue depends on winning contracts and dispatching loads/storage correctly.
- Examples: Enel X, CPower, Voltus, Next Kraftwerke, Flexitricity, Limejump
Business Model:
- Revenue share with asset owners: aggregator keeps 20–50% of market revenues, pays remainder to customers
- Some charge upfront enrollment fees or monthly SaaS fees to asset owners
- May also earn performance bonuses from utilities for exceeding dispatch targets
Pricing:
- Capacity payments: $30–150/kW-year depending on market and product
- Energy payments: Pass-through of market prices (minus aggregator margin)
- Typical customer earnings: $50–200/kW-year for C&I loads, $100–400/year per residential battery
3. Distributed Energy Resource Management System (DERMS) / Optimization
- Software that enables forecasting, control, bidding, and compliance. This is the intelligence layer.Can be built into Aggregators
- Examples: AutoGrid (Uplight), Enbala (Generac), Opus One, Smarter Grid Solutions, GE GridOS, Siemens EnergyIP
Business Model:
- Enterprise SaaS licensing: Annual contracts based on MW under management or number of assets controlled
- Implementation/integration fees: One-time project fees for utility deployments ($500K-5M+)
- Managed services: Ongoing optimization-as-a-service with performance-based fees
Pricing:
- Typically $2–10/kW-year for software licensing (varies by functionality and scale)
- Large utility DERMS deployments can be $5–20M total contract value over 5+ years
- Some vendors offer revenue-share models (5–15% of incremental value captured)
4. Assets
- The physical supply: EVs, batteries, thermostats, heat pumps, industrial loads, etc.
5. Grid Buyers
- The demand side: utilities and system operators who procure flexibility to manage congestion, balancing, and peak loads.DSOs, TSOs, suppliers, and municipal utilities
- Examples: PJM, CAISO, National Grid ESO, TenneT, UK Power Networks, E.ON, Con Edison
Business Model:
- Regulated entities — costs recovered through grid tariffs or capacity charges to ratepayers
- Procure flexibility when it’s cheaper than infrastructure alternatives (“non-wires alternatives”)
- Some vertically integrated utilities run in-house DR programs; others outsource to aggregators
Pricing (what they pay):
- Capacity procurement: $20–330/MW-day depending on market conditions (PJM 2026–27 auction hit $329/MW-day)
- Ancillary services: $5–50/MW-hour for frequency response, spinning reserves
- DSO local flexibility: €50–300/MWh for congestion management (often pay-as-bid auctions)
- Rule of thumb: Flexibility must be cheaper than grid reinforcement (~30–40% savings target)
Figure 1: Mechanism Diagram
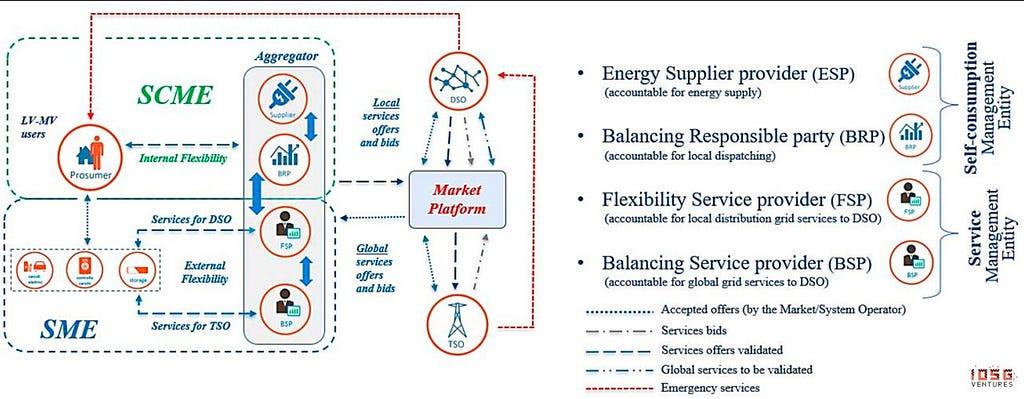
- Distribution System Operators (DSO): are the companies managing the local electricity grids (power lines, substations) that deliver power from the main transmission lines to homes and businesses
- Transmission System Operators (TSO): the crucial entities managing and maintaining the high-voltage networks (power grids and gas pipelines) that transport energy over long distances from producers to local distributors or large users
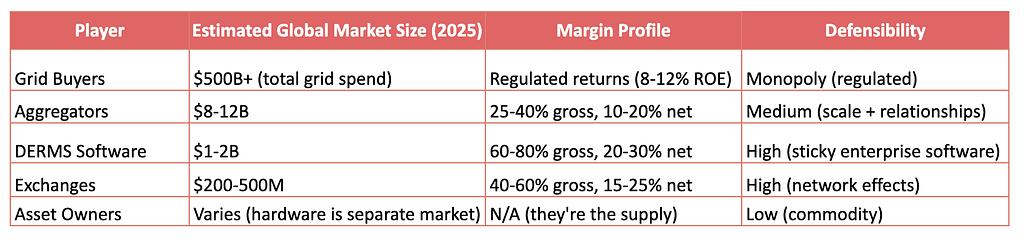
Revenue estimate by Player:
Current State of Industry
The electricity system faces a structural supply-demand imbalance for both generation capacity and grid infrastructure. This constraint manifests in two interconnected problems: an unprecedented interconnection queue backlog and surging demand from electrification and data centers.
Interconnection Queue Backlog
As of late 2024, 2,300+ GW of generation and storage capacity are actively seeking grid connection in the US alone, more than twice the total installed capacity of the existing power fleet (1,280 GW). This backlog has become the primary bottleneck for clean energy deployment.
Demand-Side Pressure
- Data centers: Global electricity demand projected to double to 1,000–1,200 TWh by 2030 (equivalent to Japan’s total consumption)
- PJM capacity market: Prices jumped from $28.92/MW-day (2024–25) to $329.17/MW-day (2026–27) — over 10x increase — driven largely by data center commitments
- US grid planners have nearly doubled 5-year demand forecasts; AI data centers require 99.999% uptime with massive power draws
- Grid upgrade costs: EU needs €730B for distribution + €477B for transmission by 2040; flexibility offers 30–40% cost savings vs. infrastructure buildout
How Flexibility Is Traded & Priced
Grid operators (ISOs/RTOs like PJM, ERCOT, CAISO) need to balance supply and demand in real-time, but they can’t directly communicate with millions of distributed assets (thermostats, batteries, industrial loads). Thus, Aggregators act as Middlemen for this process.
The aggregators we analyzed below (Enel X, CPower, Voltus) sit between two parties:
- Grid operators/utilities who need flexible capacity
- End customers who have flexible loads or assets
The aggregator bundles thousands of small, distributed resources into a single “virtual power plant” that can bid into wholesale markets as if it were a traditional power plant.
Settlement:
Unlike generation (where you measure MWh produced), demand response measures MWh not consumed. This requires establishing a “baseline” — what the customer would have consumed absent the DR event.
Common baseline methodologies:
- 10-of-10: Average consumption from the same hour over the previous 10 similar days
- Weather-adjusted: Baseline adjusted for temperature differences
- Meter-before/meter-after: Comparing consumption immediately before and during the event
Example Settlement:
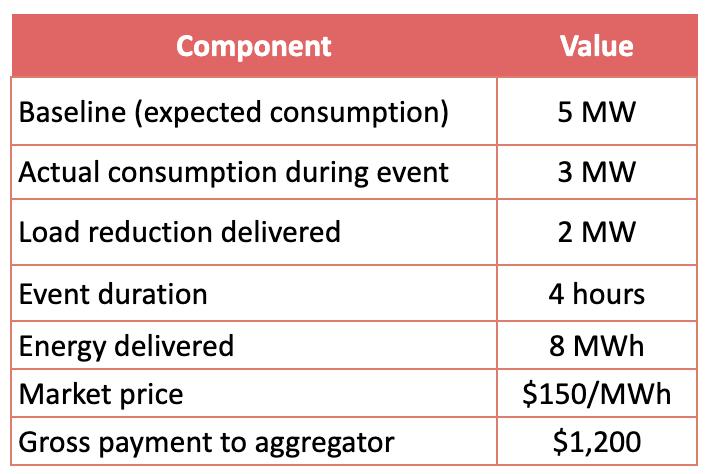
The aggregator then pays the customer according to their contract (typically 50–80% of gross), keeping the remainder.
Flexibility is monetized through multiple market mechanisms, each with different timeframes, products, and pricing structures. Providers can “stack” revenues across multiple markets to maximize asset returns.
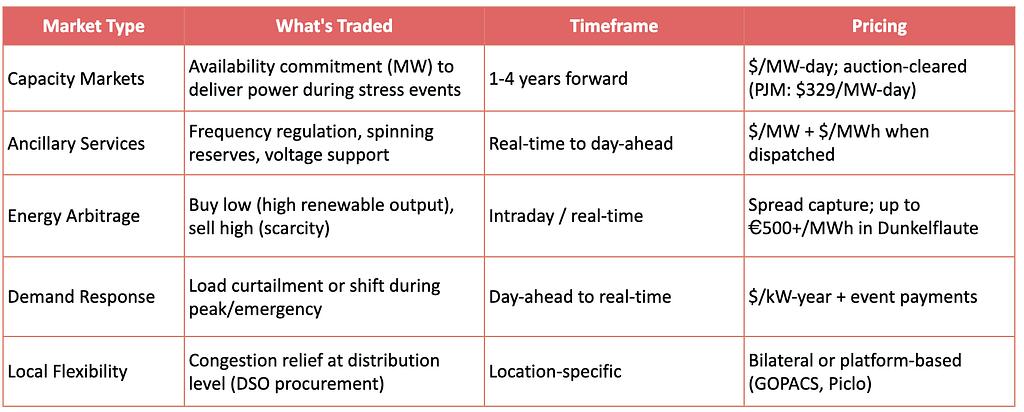
Additionally, energy communities, locally anchored cooperatives of citizens and small businesses empowered by EU policy, are becoming a significant force in flexibility aggregation, with roughly 9,000 communities representing about 1.5 million participants across the bloc.
- By pooling behind-the-meter assets such as solar, batteries, and controllable loads, these communities overcome the scale and coordination barriers that typically prevent individual households from accessing multiple flexibility revenue streams.
- This aligns directly with research showing that flexibility providers can “stack” value across capacity, ancillary, energy arbitrage, demand response, and local DSO markets: energy communities create the organizational and operational framework needed to participate reliably across these markets, transforming dispersed DERs into coordinated portfolios that can meet market entry thresholds, provide predictable availability, and capture diverse pricing structures, ultimately democratizing access to flexibility revenues while supporting grid decarbonization and resilience.
Why Flexibility Matters
Flexibility services provide a faster, cheaper alternative to building new generation and transmission. VPPs can be “built” as quickly as customers can be enrolled — no interconnection queue required. The Brattle Group estimates VPP peaking capacity is 40–60% cheaper than gas peakers or utility-scale batteries. ENTSO-E estimates flexibility could save €5B annually in EU generation costs alone.
For Grid Operators: Real-time balancing of supply and demand; reduced need for costly peaker plants and transmission upgrades; improved renewable integration; enhanced grid resilience during extreme weather.
For Asset Owners: New revenue streams from existing assets (batteries, EVs, HVAC, industrial loads); multi-service stacking can increase returns 30–50%; participation requires minimal operational disruption.
For Consumers: Lower electricity bills through demand response incentives; avoided costs from deferred infrastructure investment; improved reliability and fewer outages.
For the Energy Transition: Enables higher renewable penetration without curtailment; decarbonizes grid services (replacing gas peakers); accelerates deployment vs. infrastructure-constrained alternatives.
Structural Tailwinds
- Regulatory Momentum: FERC Orders 2222/2023 (US), EU Network Code on Demand Response (2027), UK BSC P483 enabling 345K households. 45+ countries introducing flexibility markets.
- Grid Investment Surge: US utilities forecast $1.1T grid investments through 2029. EU needs €730B distribution + €477B transmission upgrades by 2040. Flexibility is cheaper alternative.
- Data Center Demand: Global data center electricity doubling to 1,000–1,200 TWh by 2030. PJM capacity prices up 10x (2024→2027). Creates both flexibility demand (grid stress) and supply.
- DER Proliferation: 4M+ US residential solar systems; 240K+ home batteries; 1M+ EVs sold in 2023. Critical mass enabling aggregator and DER economics.
Key Risks to Monitor
- Post-2030 Oversupply: Massive battery storage investment could compress flexibility market margins. Pumped hydro revival in some markets.
- Cybersecurity: Millions of distributed assets expand attack surface. EU AI Act classifies grid operations as “high-risk.” NFPA 855 adding 15–25% to urban BESS costs.
The Aggregator Business Model
Revenue Streams:
- Capacity payments ($/MW-year or $/MW-day)Largest, most predictable revenue stream Customer gets paid for being available, even if never dispatched Example: PJM capacity prices hit $329/MW-day in 2026–27 auction
- Energy payments ($/MWh)Payment for actual load reductions during events More volatile, depends on dispatch frequency and market prices
- Ancillary services ($/MW + $/MWh)Frequency regulation, spinning reserves, etc. Higher value but requires faster response (seconds to minutes) Voltus has pioneered access to these higher-margin products
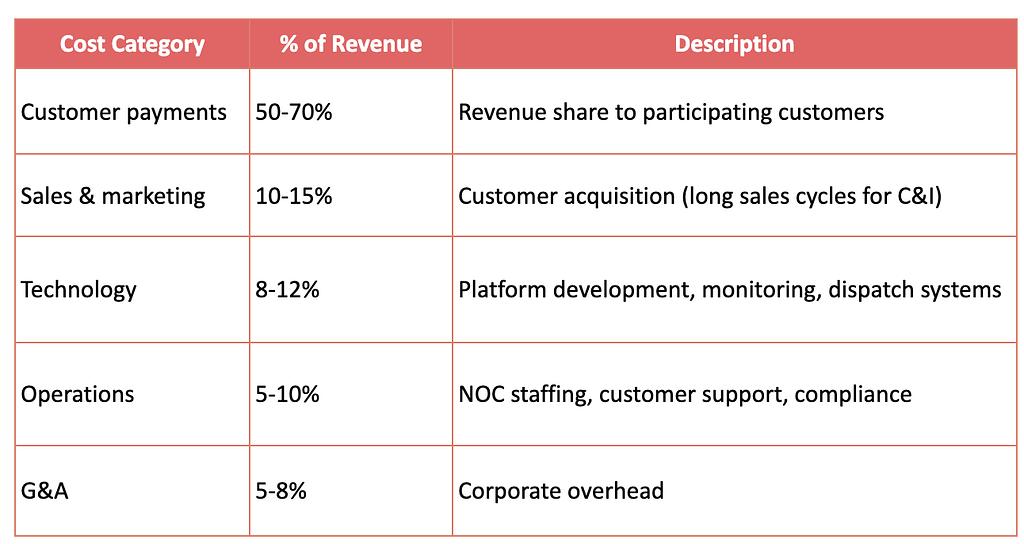
Cost Structure:
Unit Economics Example (C&I Customer):
Revenue Stacking: How Aggregators Maximize Value
The most sophisticated aggregators “stack” multiple revenue streams from the same asset:
Example: A 10 MW industrial load in PJM
This is why Enel’s DER.OS and Tesla’s Autobidder emphasize “co-optimization,”their AI figures out which markets to participate in at any given moment to maximize total returns.
Key Players in Aggregator Layer
Enel X — Global Market Leader
Company Overview
Enel X is the demand response and distributed energy arm of Enel Group, one of the world’s largest utilities with €86B+ in annual revenue. The company traces its roots to EnerNOC, the pioneering demand response provider founded in 2001 and acquired by Enel in 2017. Today, Enel X operates the world’s largest C&I virtual power plant with over 9 GW of demand response capacity across 18 countries and 110+ active programs.
Scale & Reach
- Global capacity: 9+ GW under management (Q1 2025), with ambition to reach 13 GW
- North America: ~5 GW across 10,000+ sites in 31 US states and 2 Canadian provinces
- Programs: 80+ demand response programs, 30+ utility partnerships (11 exclusive bilateral agreements)
- Customer payments: Nearly $2 billion distributed to DR participants since 2011
- Technology investment: $200M+ invested in platform development
Strategic Partnerships
In September 2024, Enel X partnered with Google to aggregate 1 GW of flexible load from data centers — the largest corporate VPP globally. This partnership demonstrates the convergence of data center demand growth and flexibility provision: the same hyperscalers driving grid stress can become major providers of demand-side flexibility through their UPS batteries and load-shifting capabilities.
Technology Platform: DER.OS
Enel X’s DER.OS platform uses machine learning-driven dispatch optimization to improve profitability by 12% over rule-based strategies (per internal audits). The platform streams data from 16,000+ enterprise sites and operates a 24/7/365 Network Operations Center for real-time dispatch management and monitoring.
Key Customers: Commercial & Industrial (C&I) Facilities
These are large electricity consumers with interruptible loads, processes that can be temporarily reduced without major disruption:
Key point: These customers already own the “asset” (their electricity load). Enel X just helps them monetize the flexibility they didn’t know they had. Enel X is explicitly demand-side and asset-light. They don’t build or own generation. They reduce demand, which has the same grid effect as adding supply.
The Google Partnership
The September 2024 Google deal is notable because it flips the usual model:
Traditional model: Enel X recruits facilities → aggregates into VPP → sells to grid
Google deal: Google’s data centers become the flexible asset → Enel X operates the VPP → Grid operators buy the flexibility
Google’s data centers have:
- Massive UPS battery banks (normally for backup)
- Flexible cooling loads
- Some workload scheduling flexibility
Instead of consuming grid flexibility, Google is now providing it — and Enel X is the orchestration layer. This is the “data centers as grid assets” thesis playing out.
Revenue Model Breakdown
How Enel X makes money from a single customer:
Competitive Position
- Strengths: Largest global scale, deep utility relationships, integrated clean energy ecosystem (11 GW renewables + 1 GW storage), proven platform, financial backing of Enel Group
- Weaknesses: Legacy enterprise sales motion, slower innovation cycle vs. pure-play startups, corporate overhead
- Strategy: Focus on C&I segment, utility-scale renewables integration, data center flexibility partnerships
2. Voltus — Software-First Challenger Europe vs North America
Company Overview
Founded in 2016 by former EnerNOC executives Gregg Dixon and Matt Plante, Voltus has positioned itself as a technology-first alternative to legacy demand response providers. The company’s thesis: superior software and broader market coverage can overcome scale disadvantages. As of September 2025, Voltus ranked #1 in GW under management in Wood Mackenzie’s North American VPP report for the third consecutive year.
Scale & Funding
- Capacity: 7.5+ GW under management (September 2025), up from 2 GW in 2021
- Market coverage: Active in all 9 US wholesale power markets and Canada — broadest geographic footprint among pure-play aggregators
- Funding: $121M raised to date (investors include Equinor Ventures, Activate Capital, Prelude Ventures)
- SPAC attempt: Announced $1.3B SPAC merger in December 2021 (valued at $1.3B); deal did not complete
Differentiation Strategy
Voltus differentiates on three axes: (1) First-to-market innovation — the company pioneered access to Operating Reserves programs across multiple grid operators; (2) Broadest market access — active in programs that competitors avoid due to complexity; (3) DER partnerships — rather than competing with device manufacturers, Voltus partners with OEMs like Resideo and Carrier to aggregate their installed bases into VPPs.
Data Center Focus
In 2025, Voltus launched “Bring Your Own Capacity” (BYOC), a product specifically designed for data centers and hyperscalers. BYOC allows data center developers to deploy VPP-driven grid flexibility in parallel with their own projects, reducing time-to-power by offsetting their capacity needs with flexibility procured from Voltus’s distributed network. Partners include Cloverleaf Infrastructure.
Key Customers: C&I Facilities (Similar to Enel X)
OEM Partnerships
This is Voltus’s key strategic innovation. Instead of only doing direct sales to facilities, they partner with device manufacturers:
Why this matters: Customer acquisition cost (CAC) is the biggest expense for aggregators. By partnering with OEMs:
- OEM handles the customer relationship
- Voltus provides the software and market access
- Revenue is split between OEM, Voltus, and end customer
- CAC drops dramatically vs. direct enterprise sales
Revenue Streams: Where Voltus Differs
Enel X: Primarily Capacity Markets
Enel X’s bread and butter is capacity market revenue — getting paid for committed availability. This is:
- Predictable (annual auctions)
- Lower $/kW but high volume
- Requires large MW commitments
Voltus: Ancillary Services Focus
Voltus deliberately pursues ancillary services programs that competitors avoid:
Why ancillary services?
- Higher $/kW (2–3x capacity markets)
- Fewer competitors (complexity is a barrier)
- Requires sophisticated software (Voltus’s strength)
- But: Requires faster-responding assets
Competitive Position
- Strengths: Technology sophistication, broadest market coverage, regulatory advocacy (former FERC Chairman Jon Wellinghoff as Chief Regulatory Officer), OEM partnership strategy, data center positioning
- Weaknesses: Smaller scale than Enel X, no utility-scale asset base, venture-funded burn rate, failed SPAC
- Strategy: Software monetization of third-party DERs, first-mover in ancillary services, data center partnerships
Investment criteria and standard for VPP/Aggregator
# Criteria Best Metric Why This Metric Good Great Elite
1 Scale GW under management Direct measure of market position; determines negotiating power with ISOs and utilities 1 GW 5 GW 10+ GW
2 Market Access # of ISOs/markets active Revenue diversification; more markets = more revenue stacking opportunities per customer 3 6 All 9 US + Canada
3 Monetization Efficiency Revenue per kW-year ($) Shows how well they extract value from assets; indicates product mix quality $50 $80 $120+
4 Customer Economics LTV:CAC ratio Single best measure of unit economics sustainability; can they scale profitably? 3:1 5:1 8:1+
5 Technical Performance Dispatch reliability (%) % of committed MW actually delivered; determines ISO penalties and reputation 90% 95% 98%+ 6 Response Capability Portfolio-weighted response time Faster response = access to higher-margin ancillary services <60 min <10 min <1 min
7 Customer Stickiness Net revenue retention (%) Combines churn + expansion; shows if customers grow or leave 100% 110% 120%+
8 Competitive Moat # of exclusive utility contracts Hard-to-replicate relationships; recurring revenue with barriers 3 7 12+
9 Growth Velocity YoY capacity growth (%) Market momentum; ability to scale 20% 40% 60%+
10 Profitability Path Gross margin (%) Revenue minus customer payments; shows business model health before operating costs 25% 35% 45%+
EU vs US Market:
The EU is already scaling up their system-wide flexibility with greater speed than the US due to supporting regulations and interconnected infrastructure.
notes that liberalized EU markets incentivize producers and consumers to participate, boosting flexibility, with smart meters enabling time-of-use pricing for demand shifting.
- Market Design: liberalized EU markets incentivize producers and consumers to participate, boosting flexibility, with smart meters enabling time-of-use pricing for demand shifting.
- Interconnected Grid: the EU’s robust, interconnected grid, leading to fewer, shorter blackouts, which is crucial for stable industrial power.
The US has significant untapped flexibility from customers, with studies showing potential for large-scale load curtailment (e.g., 100 GW) with minimal impact.
- Grid Edge Focus: Rapid DER (Distributed Energy Resource) growth makes flexibility at the “grid edge” critical for US utilities
https://a16z.com/decentralizing-the-electric-grid/
“Because of the grid’s inherent fragility, careful consideration must be made to assets connected to it, aligning reliable supply with forecasted demand. The growth of intermittent power sources (unreliable supply) coinciding with the rise of “electrification” (spiky demand) is causing serious challenges.” — a16z
Conclusion
So far, flexibility has been dominated by macro-flexibilities, i.e. large, industrial-scale assets (>200 kW) connected at the transmission or high-voltage distribution level. These assets were attractive because they were straightforward to identify, contract, and dispatch.
That model is now hitting structural limits. Macro flexibility is no longer sufficient, leading to electricity undersupply and cascading issues such as delayed grid connections. This increases system fragility and is emerging as a key bottleneck to AI-driven load growth.
The next frontier is therefore inevitable: micro-flexibilities. This refers to small, behind-the-meter assets in the 1 to 10 kW range, including EV chargers, heat pumps, HVAC systems, batteries, and household appliances, connected to medium- and low-voltage grids. In aggregate, these assets represent orders of magnitude more capacity than macro sources, but are significantly harder to access.
Most current approaches to acquiring this flexibility leave substantial value on the table, opening an opportunity for the flexibility owners to fill this gap and engage with the ecosystem. An aggregator that directly engages a critical mass of owners, independent of supplier or device brand, creates a powerful pull dynamic.
Once users are aggregated horizontally, both energy companies and OEMs are economically incentivized to participate, rather than attempting to control the customer relationship from the outset.
At the center of it, I believe that DePINs have the greatest opportunity to disrupt this sector and create long term upside by unlocking scalability through crypto-native infrastructures and incentives. By increasing capacity and opening new ways to access flexibility, this niche will innovate the current electricity market and allow AI to continue reshaping the world without constraints.
The Inflection Point in Electricity Flexibility: Macro Assets to Distributed Intelligence was originally published in IOSG Ventures on Medium, where people are continuing the conversation by highlighting and responding to this story.