Bitcoin price today trades near $71,800, up roughly 2.9% over the past month. A bullish pattern on Bitcoin’s (BTC) daily chart now points to an 11% breakout target.
Yet the data behind the rally tells a cautious story. Bitcoin open interest has dropped, spot outflows have halved, and long-side conviction is well below earlier levels. The structure is ready. The fuel is not.
Bitcoin Price Builds Breakout Structure as RSI Hints at a Pullback
On the daily chart, the Bitcoin price has formed a clear rounded bottom pattern with a slightly upward-slanting neckline. The cup completed its formation after weeks of gradual recovery from late March lows. Since the April 9 local peak, a consolidation has started that could align with the handle if the pattern continues.
However, momentum tells similar but a more aggressive story. The Relative Strength Index (RSI), a measure of buying and selling pressure, currently sits at 58.44. Between March 4 and April 9, price printed a lower high while RSI printed a higher high. That is a hidden bearish divergence, a pattern that often hints at downtrend continuation.
Want more token insights like this? Sign up for Editor Harsh Notariya’s Daily Crypto Newsletter here.
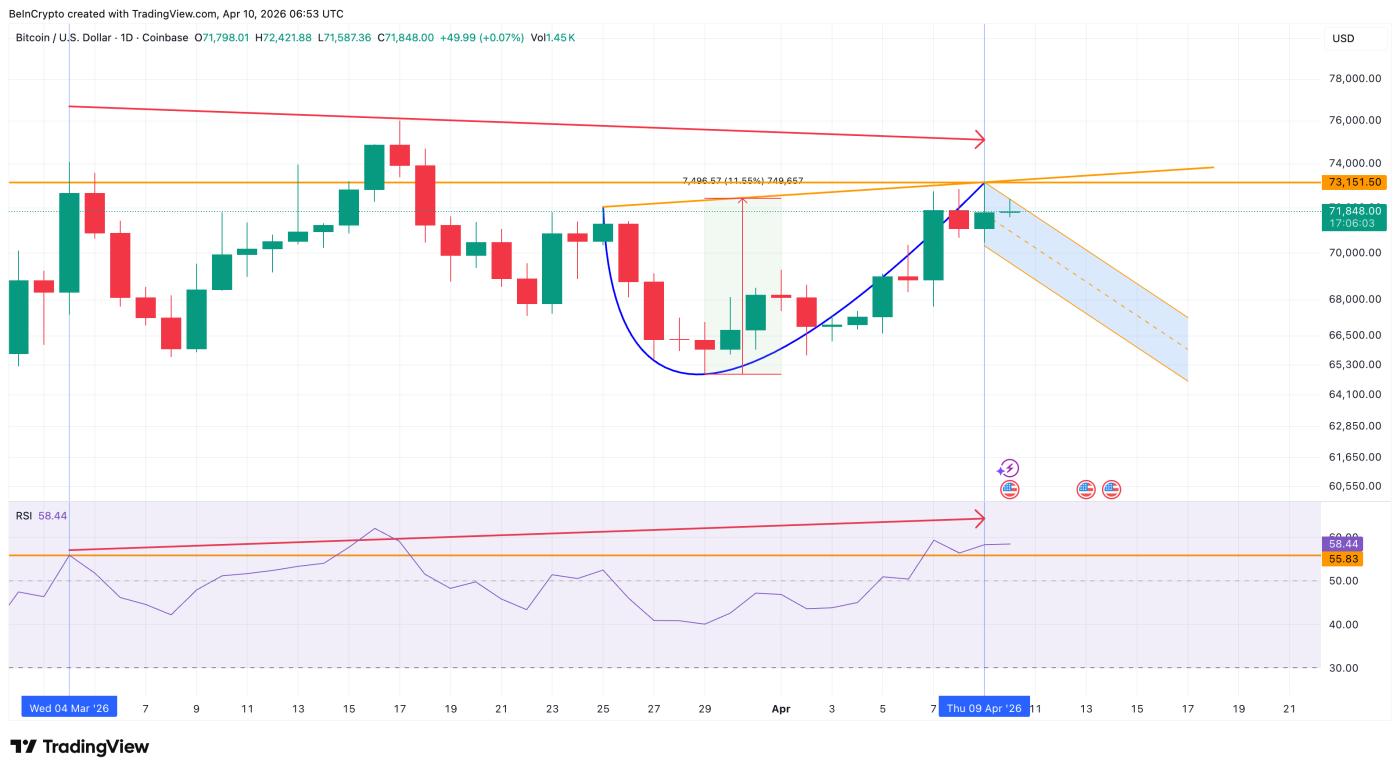 RSI Hidden Divergence: TradingView
Despite being up 2.9% month on month, BTC remains down 17% year to date. The divergence suggests the recent pullback (consolidation into handle) may have further to run before any Bitcoin breakout attempt. While the structure looks constructive, whether it stalls or accelerates depends on the derivatives and spot side.
Derivatives Cool Off and Spot Flows Weaken by More Than Half
The comparison between April 8 and today reveals how quickly conviction has faded. On April 8, when BTC traded near $72,300, total open interest stood at $27.39 billion. The BTC funding rate, which measures the cost of holding long positions, sat at 0.007%. Aggressive long bias or sentiment was driving the rally.
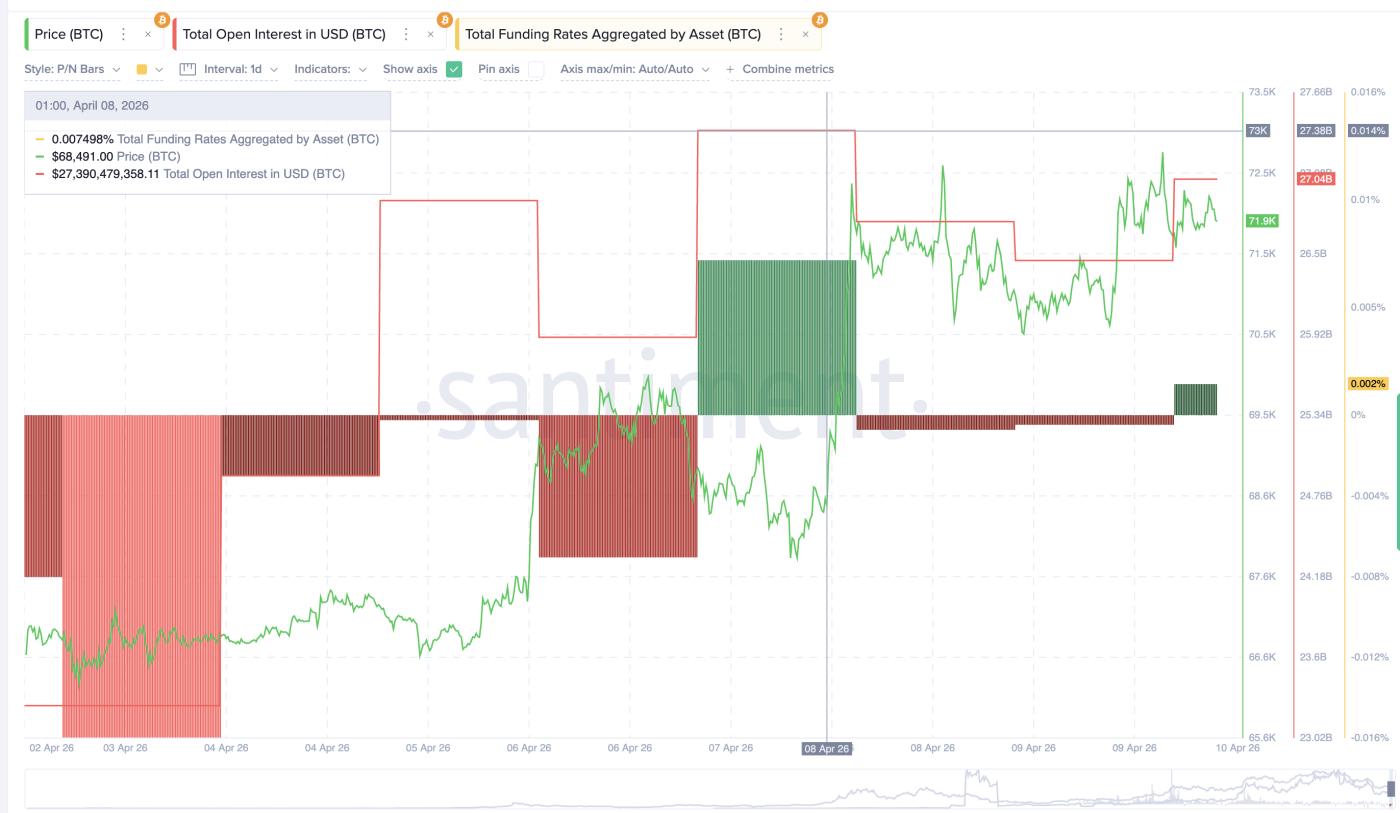 BTC Derivatives April 8 Snapshot: Santiment
Today, at a similar price near $71,900, open interest has slipped to $27.04 billion. Funding has dropped to just 0.002%. Fewer traders are betting on further upside at these levels. That absence of leverage is a double-edged sword. It means less fuel to push higher, but it also means fewer positions to liquidate if prices drop as the sentiment is still long-biased.
Meanwhile, Bitcoin exchange flows confirm the spot side is weakening too, alongside bullish sentiment. Glassnode data shows the exchange net position change, a metric that tracks exchange flows, peaked at negative 80,352 BTC on March 26. The metric tracks tokens moving in and out of exchanges. That figure has since dropped to negative 36,221 on April 9, a decline of over 50%.
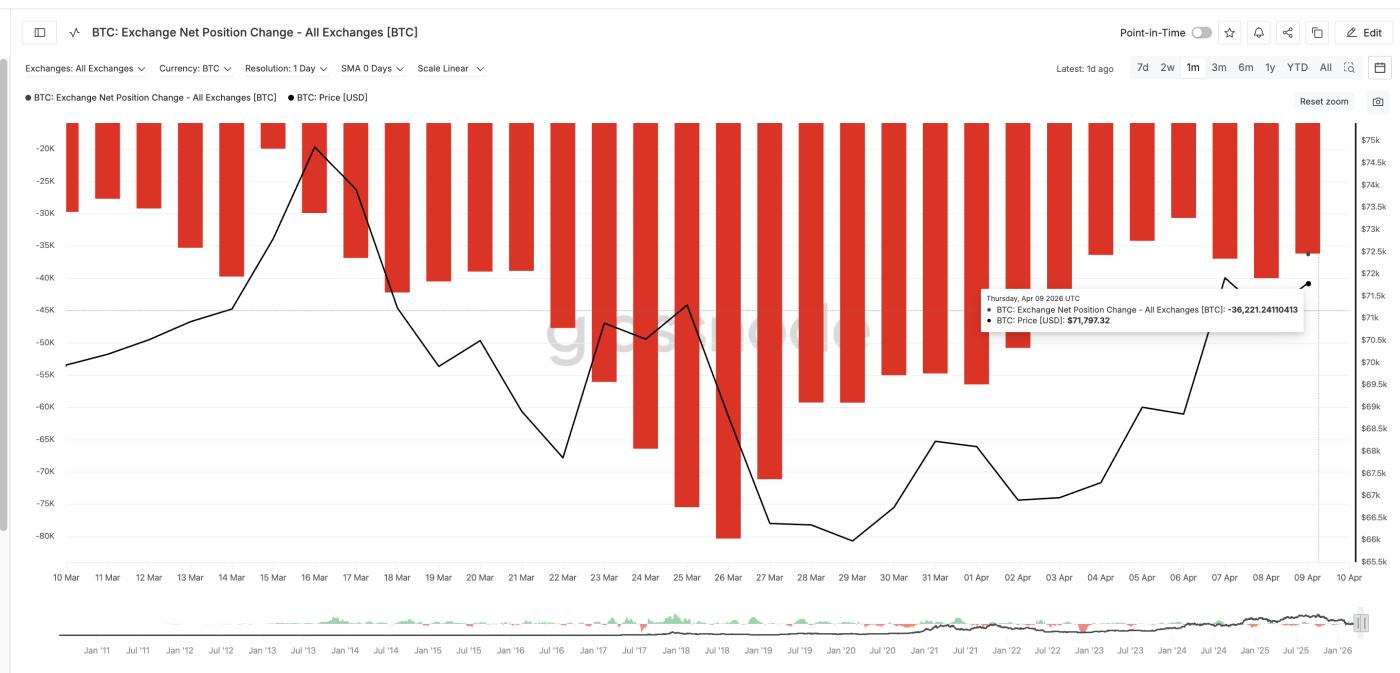 BTC Exchange Net Position Change: Glassnode
During the March 22 to March 25 rally from $67,860 to $71,303, exchange outflows were at their strongest. Yet as prices approach similar territory now, spot buyers are not showing the same urgency. The breakout structure exists. The question is whether enough conviction remains to push through.
Bitcoin Price Levels Where Conviction Must Show Up
The daily BTC chart with Fibonacci levels maps the exact zone where the pattern resolves. Bitcoin price prediction models center on the $73,151 to $73,240 range. That is where the neckline of the rounded bottom and the 0.618 Fibonacci retracement converge.
A clean daily close above $73,240 would confirm the breakout. The measured move from the pattern projects roughly 11%, which would place the target near $81,720. That level is where fresh conviction from derivatives and spot markets would need to follow through.
Yet with open interest down, funding near flat, and exchange outflows halved, the fuel gap is the primary risk. If Bitcoin price fails to reclaim $73,151, the pullback deepens as the RSI sign is still active. The first Bitcoin support level sits at $70,065. However, below that, $64,920 is the line where the entire bullish structure breaks.
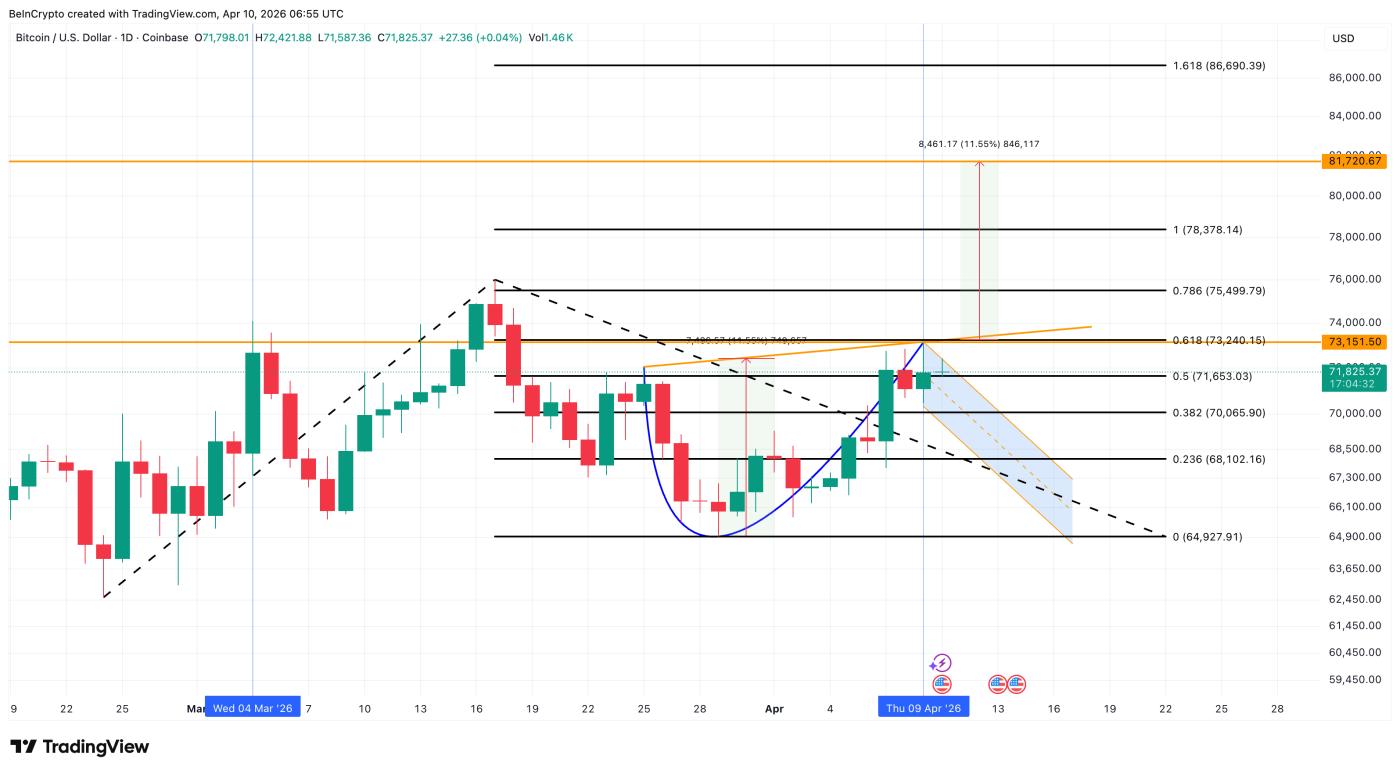 Bitcoin Price Analysis: TradingView
A daily close above $73,240 activates the $81,720 target and aligns structure with momentum. A rejection keeps BTC trapped below its neckline for now. And in the absence of massive leverage and clear directional bias, BTC could then continue trading in a range.