Crypto Expert: Bitcoin's daily chart shows continued bullish momentum on April 15th; buying on pullbacks to support levels is the prudent strategy! Latest market analysis and trading suggestions.
Bitcoin is currently priced at 74,600. Most losses in BTC trading are not due to market conditions, but rather to mindset. Greed leads to greed, and panic to panic during dips; chasing highs and lows results in repeated losses. Like the current market, even though the trend is clearly bullish, some people try to short at the top, only to get wiped out; others hold long positions but fear a pullback, panicking and taking profits at the slightest fluctuation, ultimately miss the pump on the entire upward wave. Don't let emotions override judgment; use stop-loss orders and focus on earning money you understand.
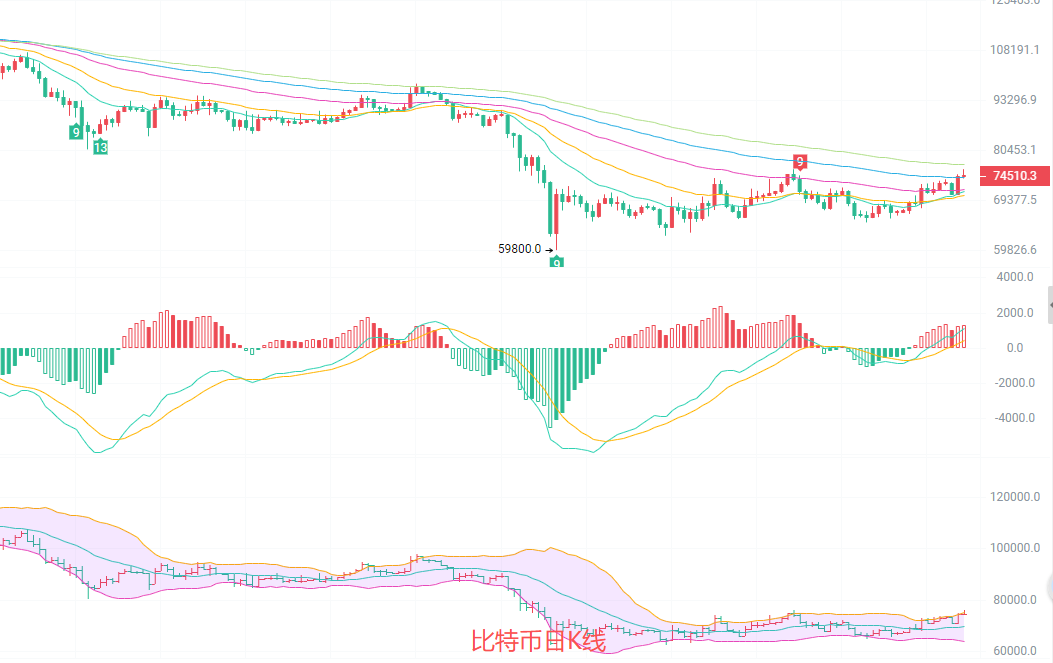
Since starting from a low of 59800, the daily candlestick chart has shown a clear upward trend, currently successfully breaking above the EMA15 and EMA30 moving averages, establishing a preliminary bullish trend. The MACD histogram continues to expand, with the DIF and DEA lines remaining above the zero line and showing no divergence signals. The Bollinger Bands are gradually widening, with the price moving towards the upper band, indicating that the upward momentum at the daily level is still being released. The upper resistance level is seen at 75000-76000, while the lower support level is seen around the middle Bollinger Band at 70500.
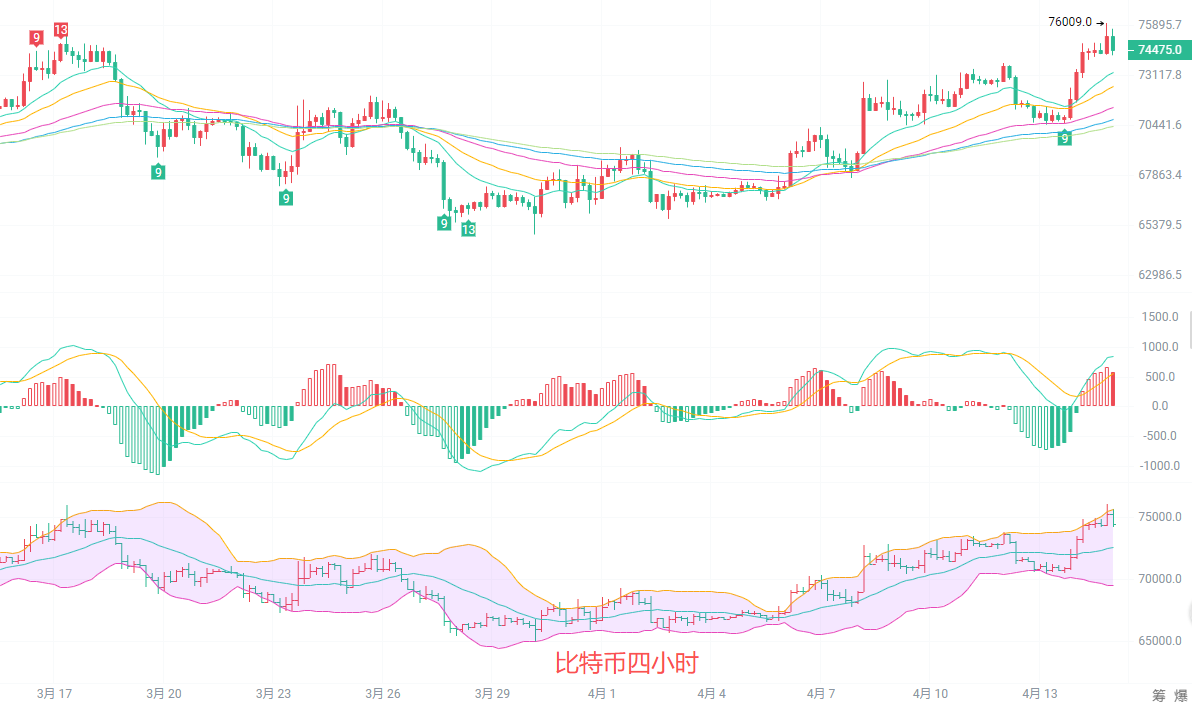
The 4-hour candlestick chart shows a standard bullish moving average arrangement, with the EMA15, EMA30, and EMA60 successively diverging upwards, forming a solid support zone. The MACD histogram remains above the zero line, showing a slight decline but without a death cross, indicating that bullish momentum has not completely weakened. The Bollinger Bands are widening upwards, with the price moving along the upper band. Support lies near the EMA15 at 73300. As long as this level holds, the 4-hour uptrend will remain intact. Therefore, as long as the price retraces but doesn't break support, it can continue to rise.
Short-term trading strategy: Follow the long-term trend, use small stop-loss orders, and trade quickly.
The support level is 73600-74000, with a stop loss at 73100 and a target of 75300-75900.
The upside target is 75500-76000, with a stop loss at 76500 and a target of 74100-73700.
In the crypto, those who are prescient reap the rewards, those who are slow to react get the scraps, and those who are oblivious end up losing everything.
For specific operations, please refer to real-time market data. For more information and details, please contact the author. There may be a delay in article publication; this advice is for reference only, and you assume all risk.