Ethereum is trading at a critical level as charts show strong resistance near $2,350 to $2,400 and immediate support around $2,295. If bulls fail to hold this structure, $ETH could slide toward lower support zones, with some traders eyeing $2,030 as the next key downside target.
Ethereum Faces Key Test at $2,350 as Breakout Stalls
Ethereum is struggling to retake the $2,350 to $2,400 zone, according to a chart shared by market commentator Ted on X. The chart shows $ETH trading near $2,332 on the 2 day timeframe against TetherUS on Binance. That leaves the token just below a red resistance band that has already rejected price several times.
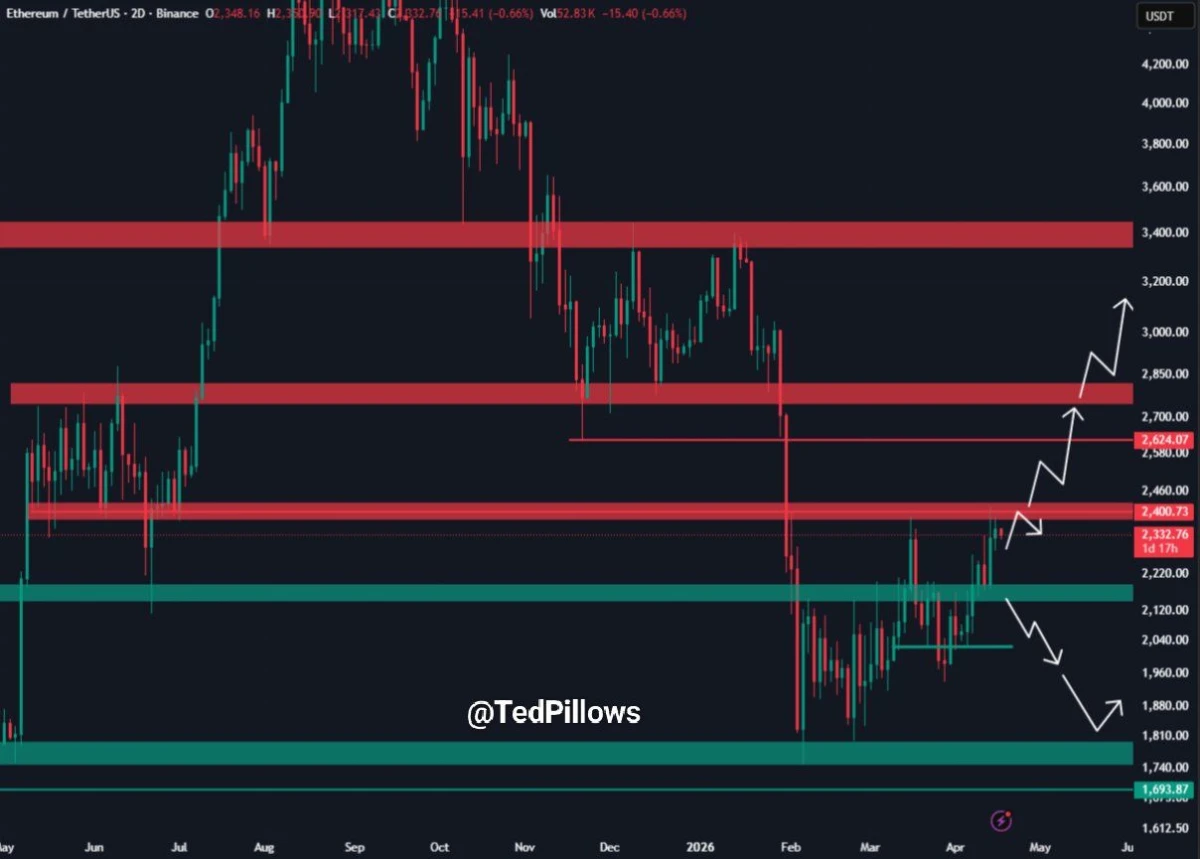
Ethereum / TetherUS 2D. Source: TradingView, Ted on X
The posted analysis says weak ETF buying is limiting momentum. As a result, Ethereum has not yet confirmed a breakout above that resistance area. Instead, the price remains stuck between nearby resistance and lower support, which keeps the short term structure fragile.
If $ETH cannot reclaim and hold the $2,350 to $2,400 range, the chart points to a possible move back below $2,200. That level sits close to a green support zone shown on the chart. A failure there could expose lower support near the $1,740 area, which marked the bottom of the last major drop.
At the same time, the chart outlines a bullish recovery path if buyers regain control. In that scenario, $ETH would first need to break above $2,400, then push through the next resistance near $2,700. After that, the chart suggests a possible climb toward the $3,000 to $3,200 area.
For now, the setup remains undecided. Ethereum is testing a key reclaim zone, but it has not cleared it yet. Therefore, the next move likely depends on whether buyers can turn the $2,350 to $2,400 band into support instead of another rejection.
Ethereum Holds $2,295 Support as Traders Watch for Wave (2) Pullback
Ethereum is still trading above the $2,295 level, according to a chart shared by MCO Global on X. The one hour ETHUSD chart shows price near $2,325 while short term support remains intact. That keeps the current structure stable for now, even as the market tests a tight range below recent highs.
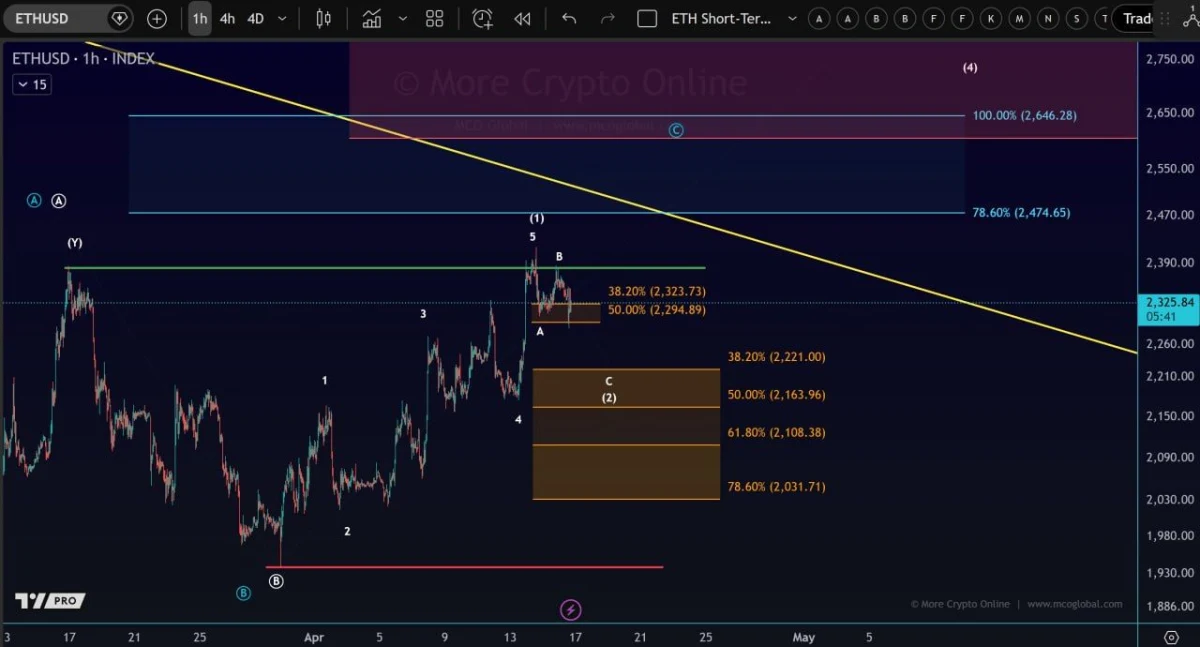
The chart marks $2,295 as the key line in the short term. Price has already pulled back into that area after failing to hold above the recent local top near $2,390. So far, buyers have defended the zone, which suggests Ethereum has not confirmed a deeper correction yet.
However, the posted analysis warns that a break below $2,295 could shift the setup lower into a wave (2) retracement. In that case, the chart highlights several downside levels between $2,221 and $2,031. The main support target sits near $2,030, which MCO Global describes as the ideal area for wave (2) to find support.
The chart also shows Fibonacci retracement levels inside that lower range. Those include about $2,221 at the 38.2% level, $2,164 at the 50% level, $2,108 at the 61.8% level, and $2,031 at the 78.6% level. Together, those marks outline the main correction zone if Ethereum loses its current floor.
At the same time, resistance remains overhead. Ethereum is trading below a descending trendline and under a broader target area between about $2,475 and $2,646. Therefore, even if $2,295 holds, bulls still need a stronger move to break the falling resistance line and reopen the path toward higher levels.
For now, the chart keeps the focus on one number. Ethereum is holding $2,295, but that support is under pressure. If it fails, traders may look for the next wave (2) support closer to $2,030.